Abstract
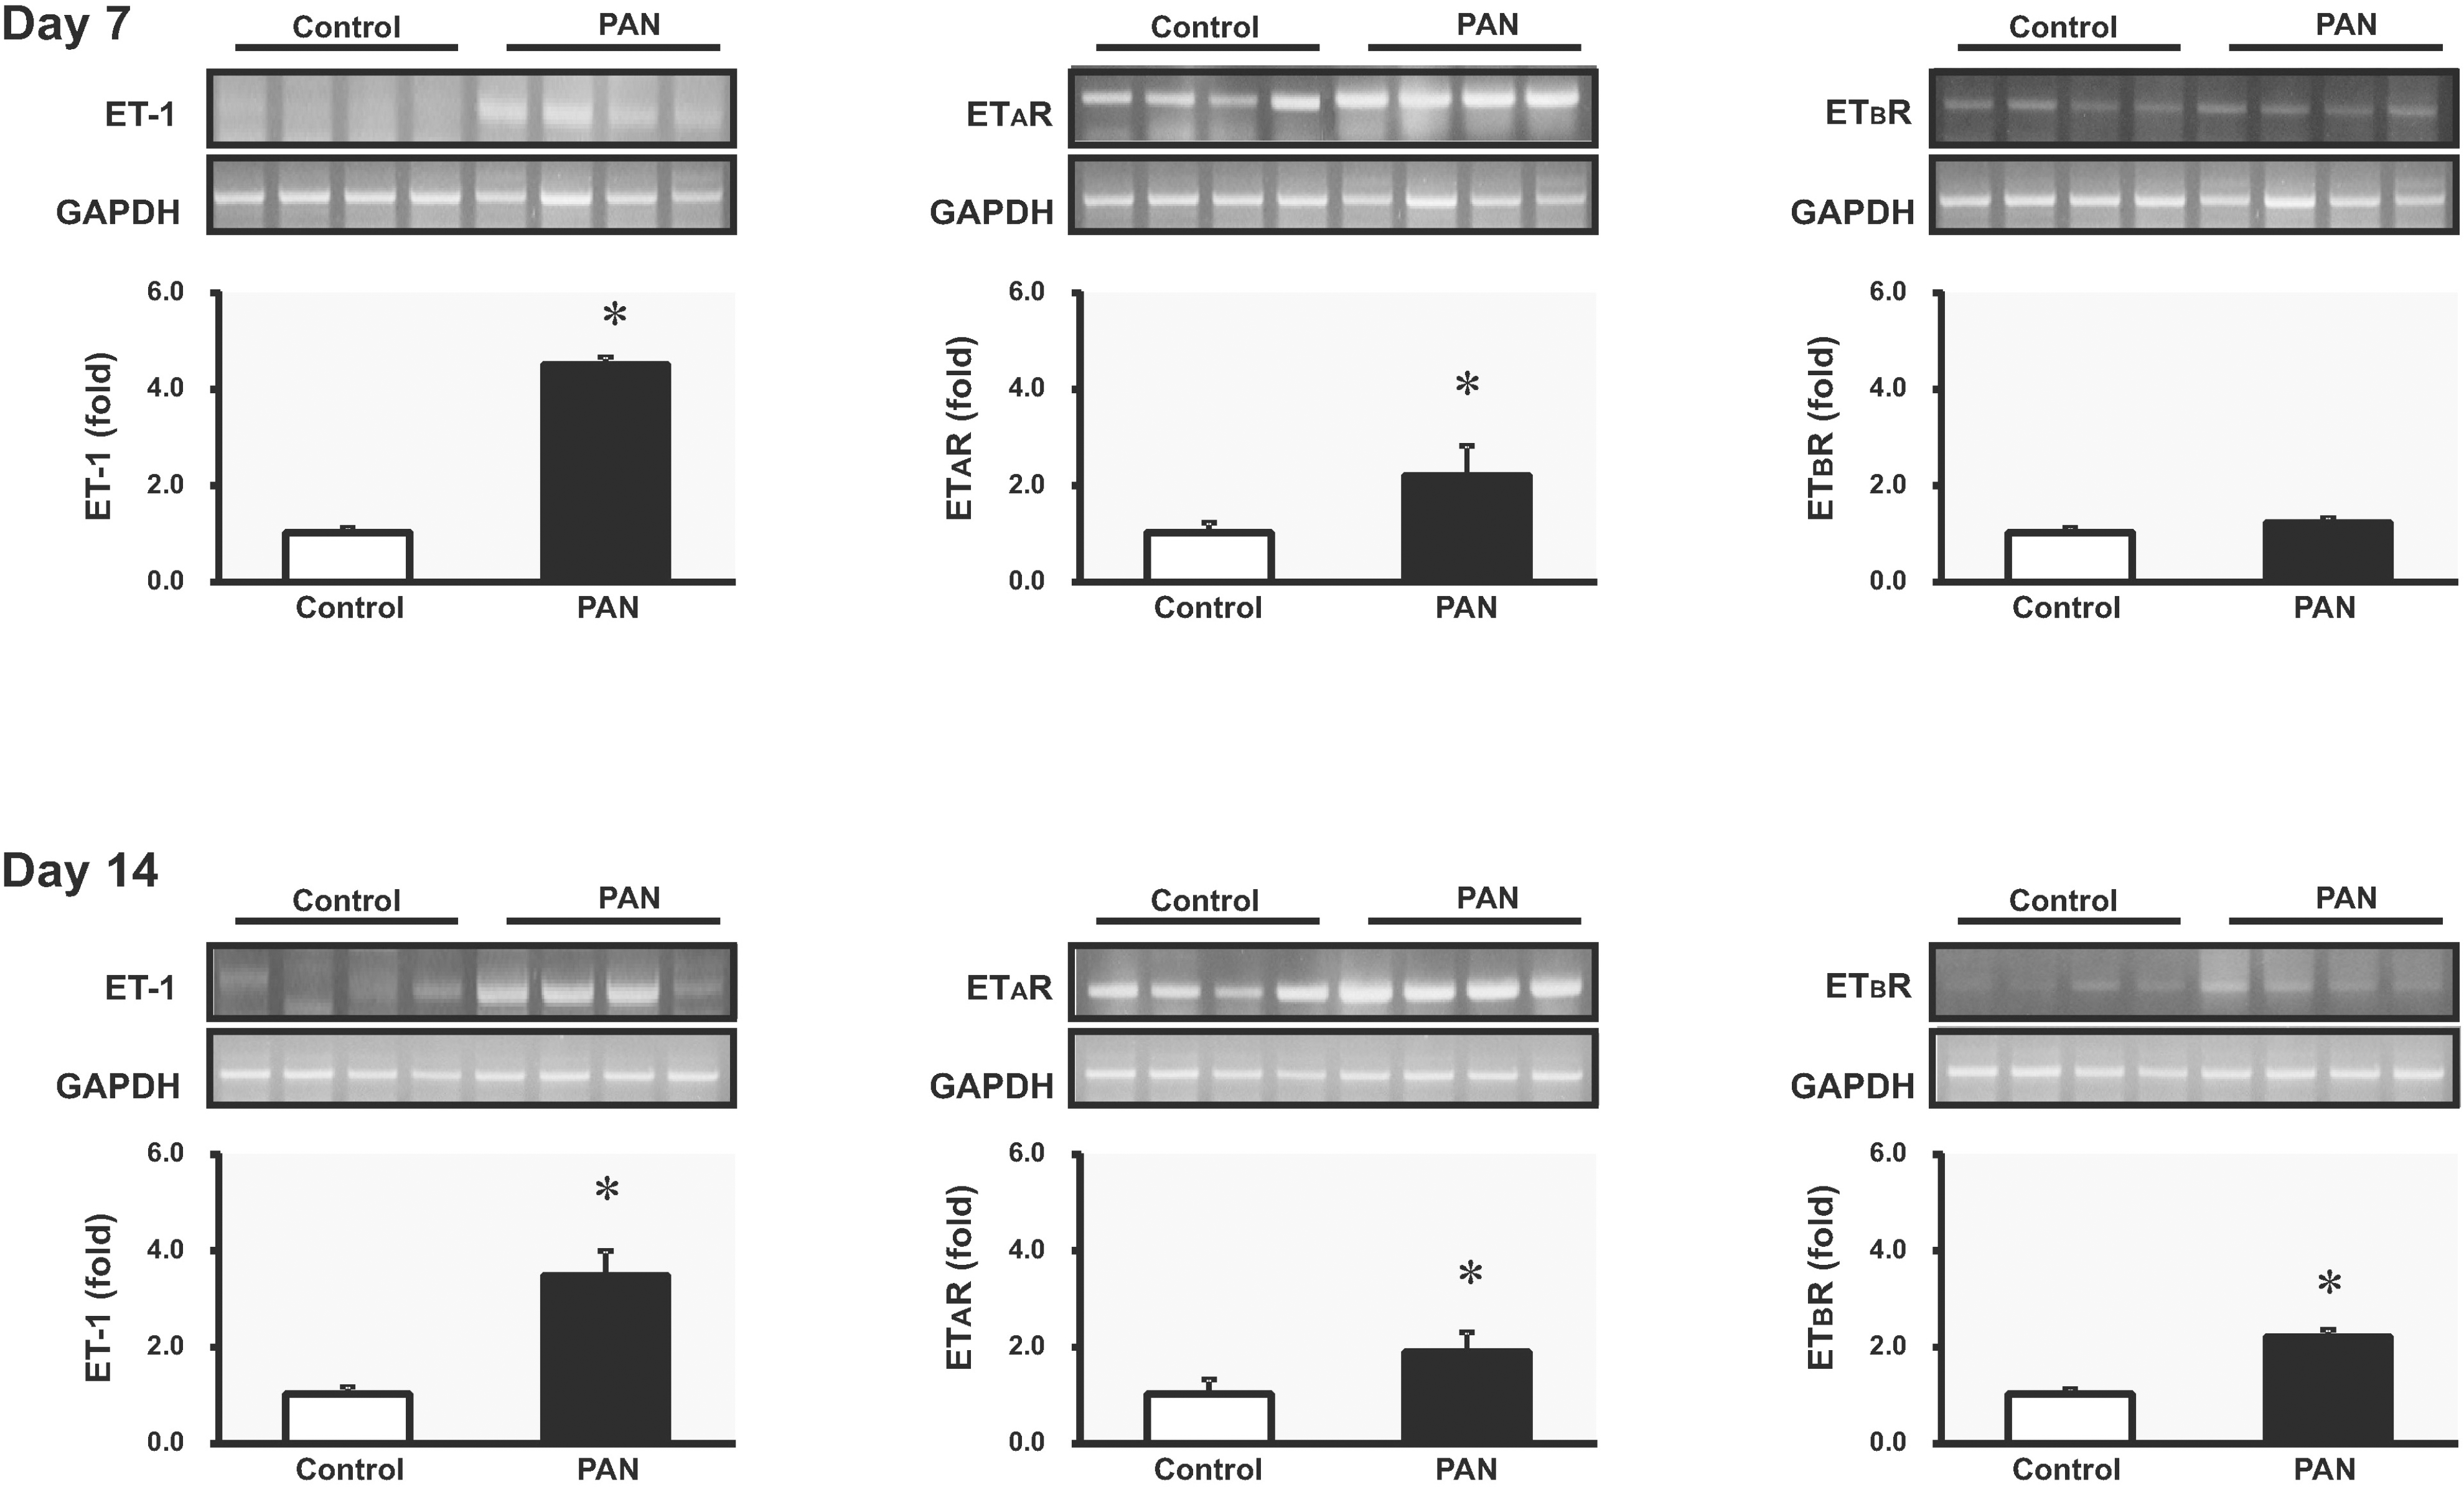
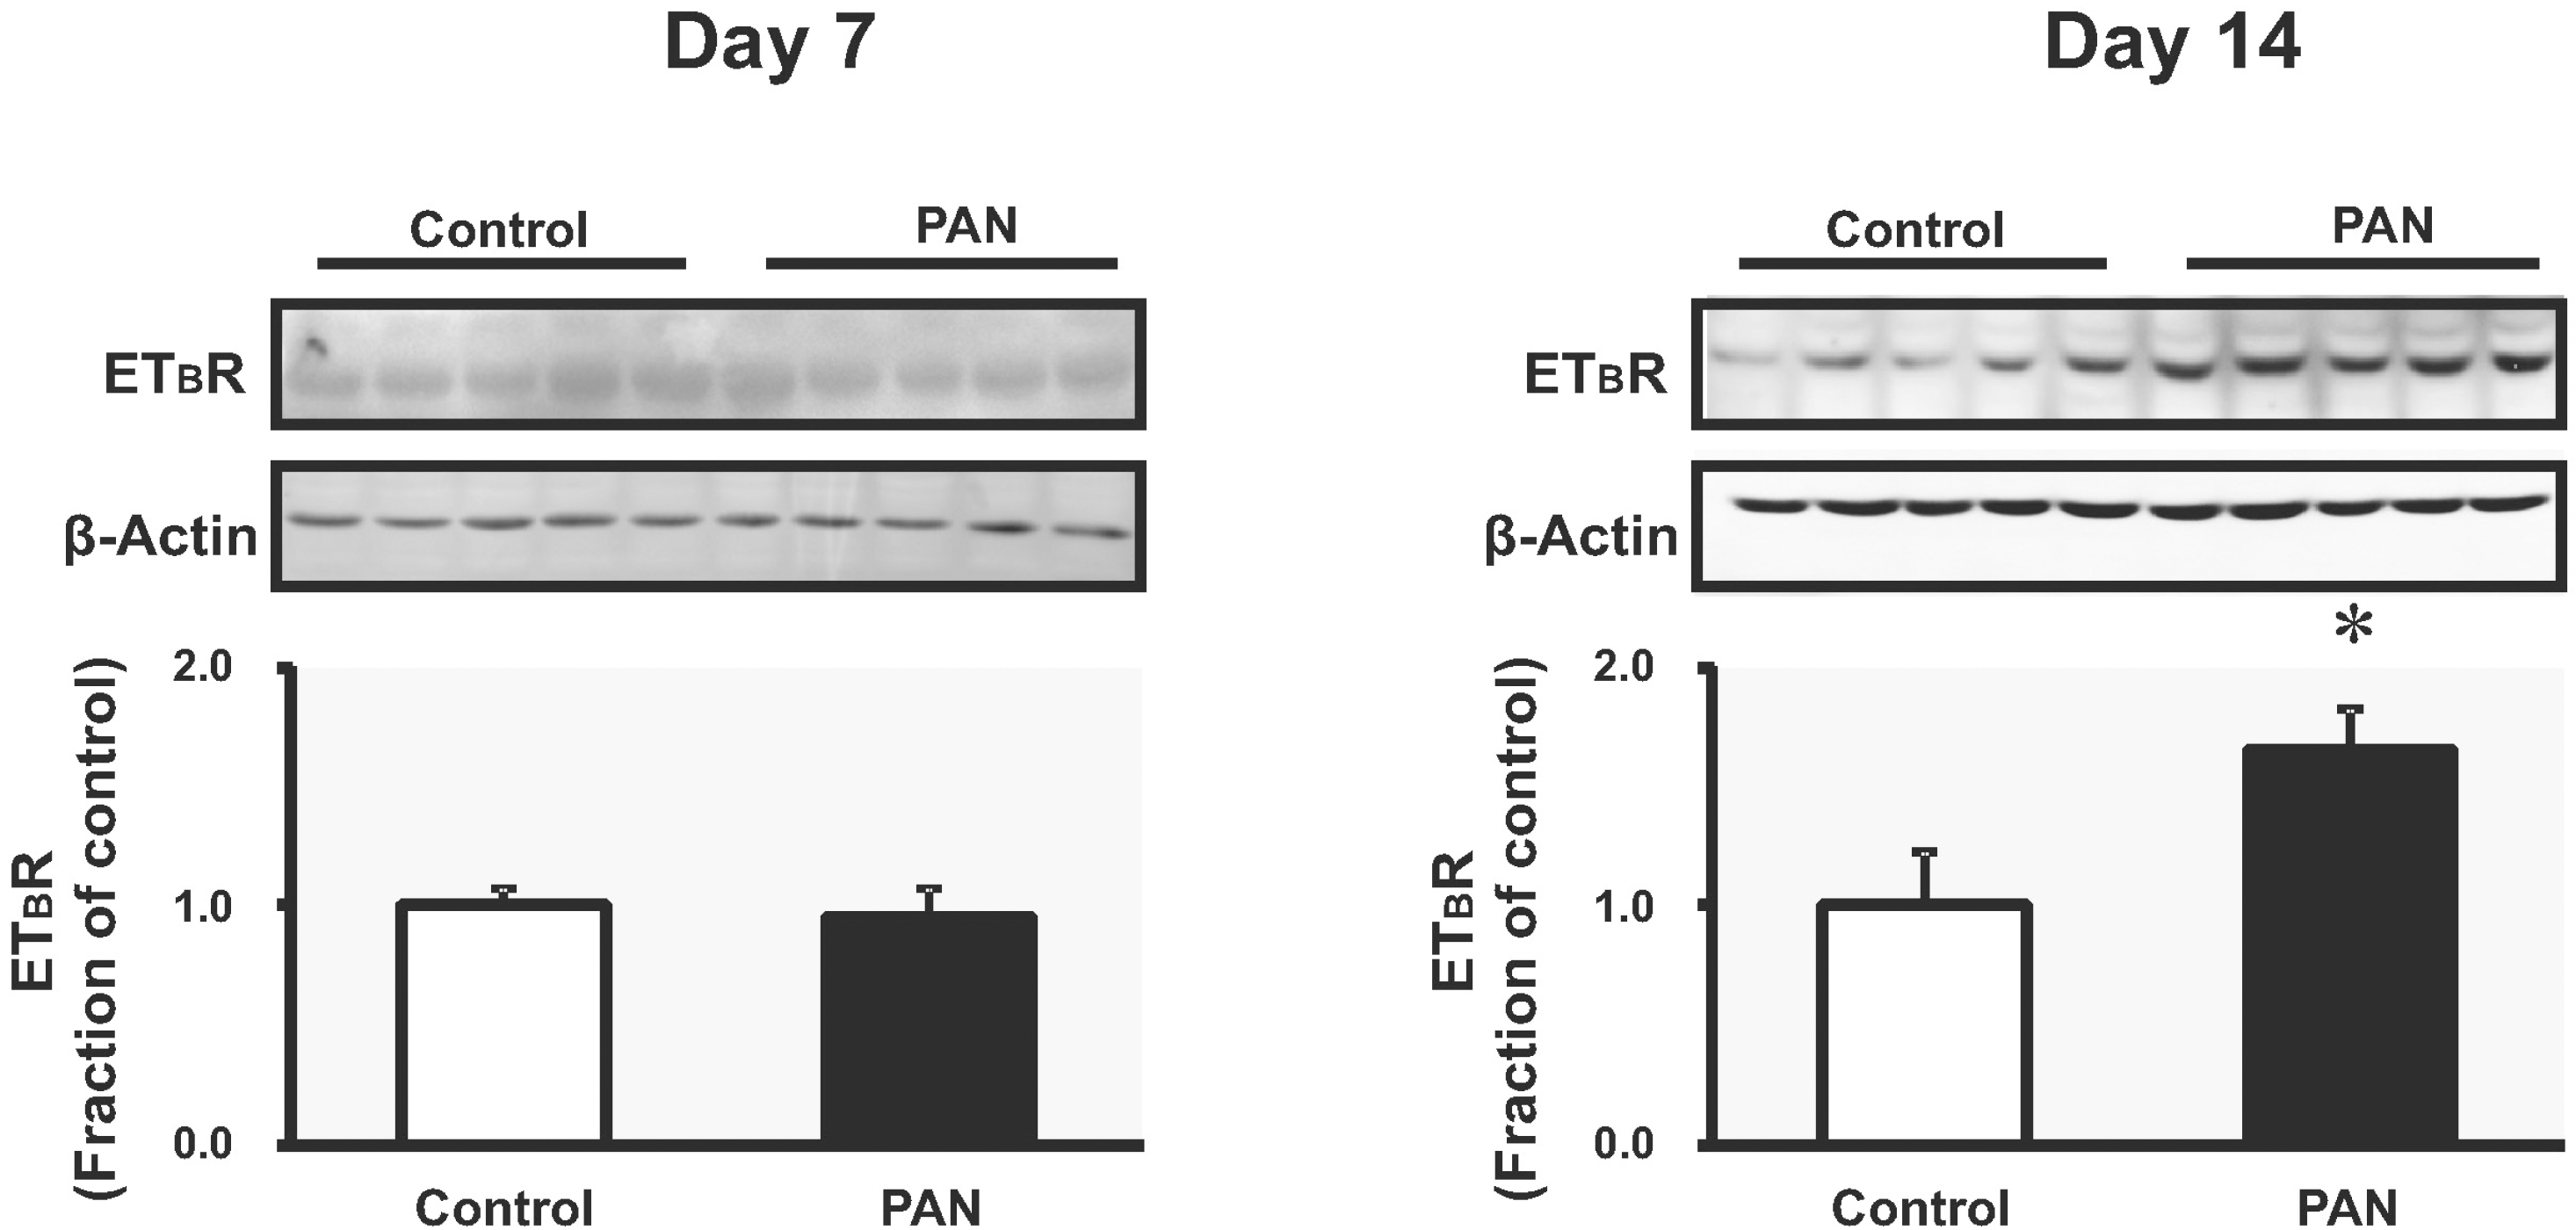
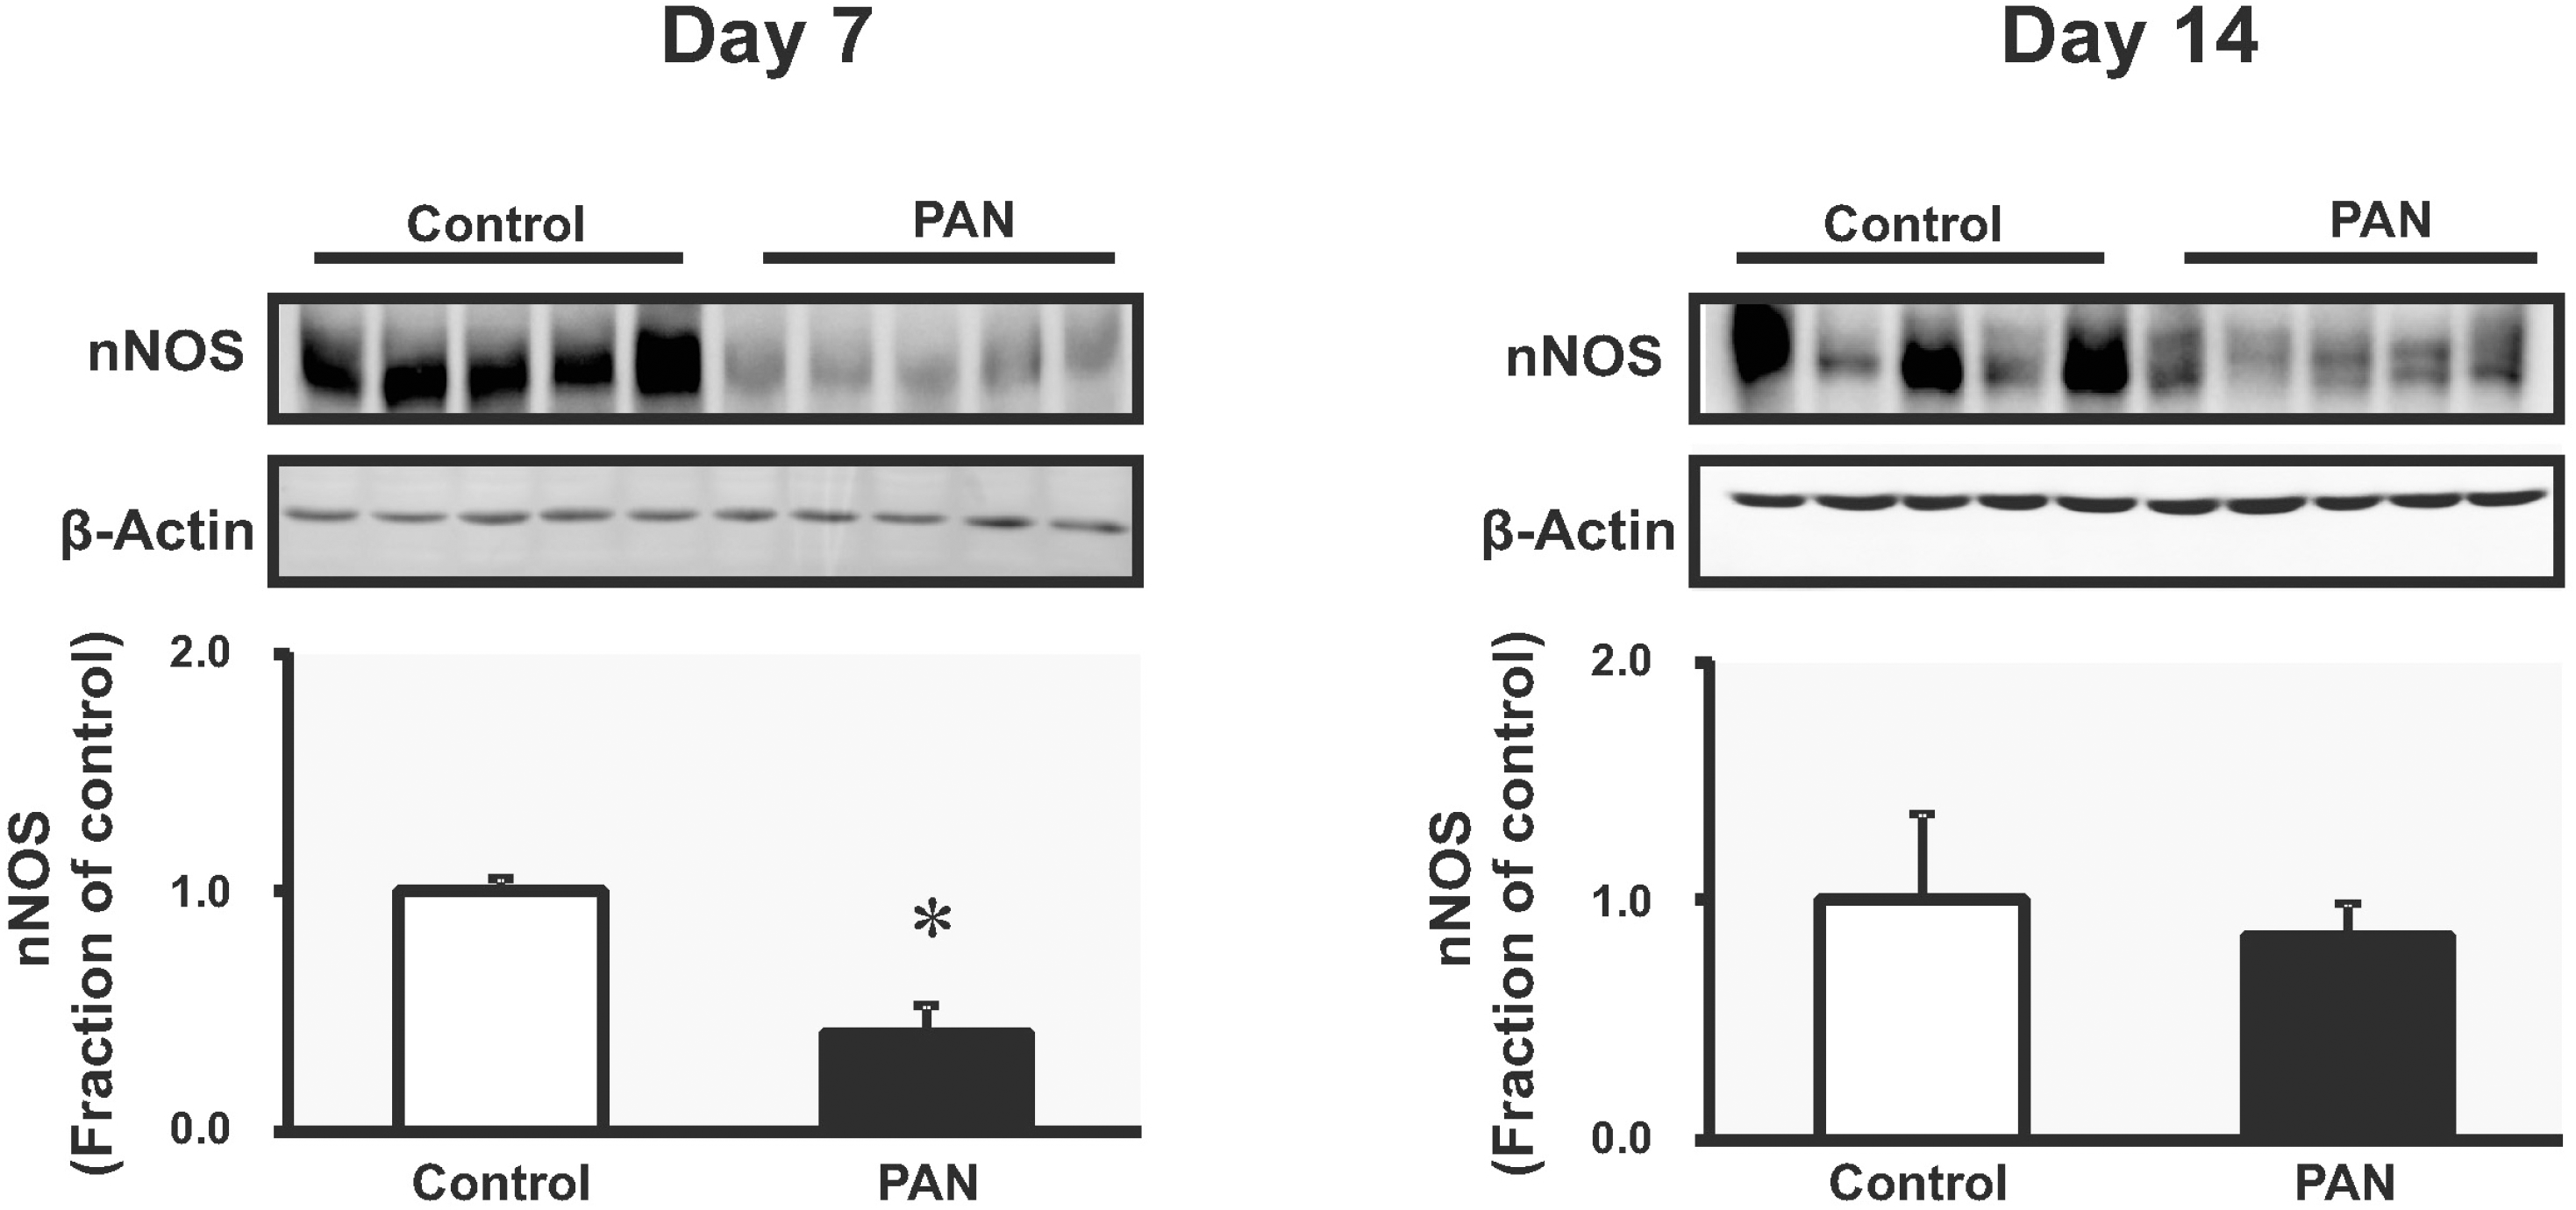
The collecting duct endothelin (ET) system, which involves ET-1 and its two receptors, may play a role in the regulation of renal sodium in association with the nitric oxide synthase (NOS) system. We determined whether sodium retention is associated with changes in the endothelin and NOS systems at different stages (i.e., a sodium retaining stage and a compensatory stage) of nephrotic syndromes. On day 7 after puromycin aminonucleoside (PAN) injection, urinary sodium excretion was decreased, ascites had developed, and there was a positive sodium balance. ET-1 mRNA expression was increased in the inner medulla of the kidney, whereas protein expression of ET receptor type B (ETBR) was unchanged. The expression of neuronal NOS (nNOS) was decreased in the inner medulla. On day 14, urinary sodium excretion was unchanged compared with controls. The expression of ETBR increased, while nNOS expression in the inner medulla was comparable to controls. These findings suggest that decreased nNOS plays a role in the development of sodium retention in the nephrotic syndrome. Recovery of nNOS and increased renal ETBR synthesis may promote sodium excretion in later stages of the nephrotic syndrome (on day 14).
Go to : 
References
1. Vande Walle JG, Donckerwolcke RA. Pathogenesis of edema formation in the nephrotic syndrome. Pediatr Nephrol. 2001; 16:283–293.

2. Deschenes G, Doucet A. Collecting duct Na, K-ATPase activity correlates with urinary sodium excretion in rat nephrotic syndrome. J Am Soc Nephrol. 2000; 11:604–615.
3. Kim SW, Schou UK, Peters CD, de Seigneuxs S, Kwon TH, Knepper MA, Jonassen TE, Frokiaer J, Nielsen S. Increased apical targeting of renal epithelial sodium channel subunits and decreased expression of type 2 11beta-hydroxysteroid dehydrogenase in rats with CCl4-induced decompensated liver cirrhosis. J Am Soc Nephrol. 2005; 16:3196–3210.
4. Kim SW, Wang W, Sassen MC, Choi KC, Han JS, Knepper MA, Jonassen TE, Frokiaer J, Nielsen S. Biphasic changes of epithelial sodium channel abundance and trafficking in common bile duct ligation-induced liver cirrhosis. Kidney Int. 2006; 69:89–98.

5. Marsen TA, Schramek H, Dunn MJ. Renal actions of endothelin: Linking cellular signaling pathways to kidney disease. Kidney Int. 1994; 45:336–344.

6. Tsukahara H, Ende H, Magazine HI, Bahou WF, Goligorsky MS. Molecular and functional characterization of the non-isopeptide-selective ETB receptor in endothelial cells. Receptor coupling to nitric oxide synthase. J Biol Chem. 1994; 269:21778–21785.

8. Abassi Z, Gurbanov K, Rubinstein I, Better OS, Hoffman A, Winaver J. Regulation of intrarenal blood flow in experimental heart failure: role of endothelin and nitric oxide. Am J Physiol. 1998; 274:F766–F774.
9. Zou AP, Cowley AW Jr. Nitric oxide in renal cortex and medulla. An in vivo microdialysis study. Hypertension. 1997; 29:194–198.
10. Romero JC, Lahera V, Salom MG, Biondi ML. Role of the endothelium-dependent relaxing factor nitric oxide on renal function. J Am Soc Nephrol. 1992; 2:1371–1387.

11. Bugaj V, Pochynyuk O, Mironova E, Vandewalle A, Medina JL, Stockand JD. Regulation of the epithelial Na+ channel by endothelin-1 in rat collecting duct. Am J Physiol Renal Physiol. 2008; 295:F1063–F10670.
12. Livak KJ, Schmittgen TD. Analysis of relative gene expression data using real-time quantitative PCR and the 2(-Delta Delta C(T)) Method. Methods. 2001; 25:402–408.
13. Stoos BA, Carretero OA, Farhy RD, Scicli G, Garvin JL. Endothelium-derived relaxing factor inhibits transport and increases cGMP content in cultured mouse cortical collecting duct cells. J Clin Invest. 1992; 89:761–765.

14. Plato CF, Garvin JL. Nitric oxide, endothelin and nephron transport: potential interactions. Clin Exp Pharmacol Physiol. 1999; 26:262–268.

15. Plato CF, Pollock DM, Garvin JL. Endothelin inhibits thick ascending limb chloride flux via ET(B) receptor-mediated NO release. Am J Physiol Renal Physiol. 2000; 279:F326–F333.

16. Pollock DM, Pollock JS. Evidence for endothelin involvement in the response to high salt. Am J Physiol Renal Physiol. 2001; 281:F144–F150.

17. Hoffman A, Abassi ZA, Brodsky S, Ramadan R, Winaver J. Mechanisms of big endothelin-1-induced diuresis and natriuresis: role of ET(B) receptors. Hypertension. 2000; 35:732–739.
18. Stricklett PK, Hughes AK, Kohan DE. Endothelin-1 stimulates NO production and inhibits cAMP accumulation in rat inner medullary collecting duct through independent pathways. Am J Physiol Renal Physiol. 2006; 290:F1315–F1319.

19. Nakano D, Pollock JS, Pollock DM. Renal medullary ETB receptors produce diuresis and natriuresis via NOS1. Am J Physiol Renal Physiol. 2008; 294:F1205–F1211.

20. Kohan DE. The renal medullary endothelin system in control of sodium and water excretion and systemic blood pressure. Curr Opin Nephrol Hypertens. 2006; 15:34–40.

Go to : 
 | Fig. 1.The expression of ET-1, ETAR and ETBR mRNA in kidney. Fluorographs show ethidium bromide stained agarose gels containing reverse transcription-PCR products, and columns show real-time PCR data representing control and PAN-induced nephrotic syndrome groups (mean±SEM, n=8 each). ∗p<0.05 vs. control. |
 | Fig. 2.The expression of ETBR in kidney. Immunoblotting data of ETBR in inner medulla was unchanged in PAN-treated rats compared with controls; it was increased on day 14 (mean±SEM, n=8 each). ∗p<0.05 vs. control. |
 | Fig. 3.The expression of neuronal NOS in kidney. On day 7, nNOS protein expression was decreased. On day 14, nNOS protein expression was increased compared with controls (mean±SEM, n=8 each). ∗p<0.05 vs. control. |
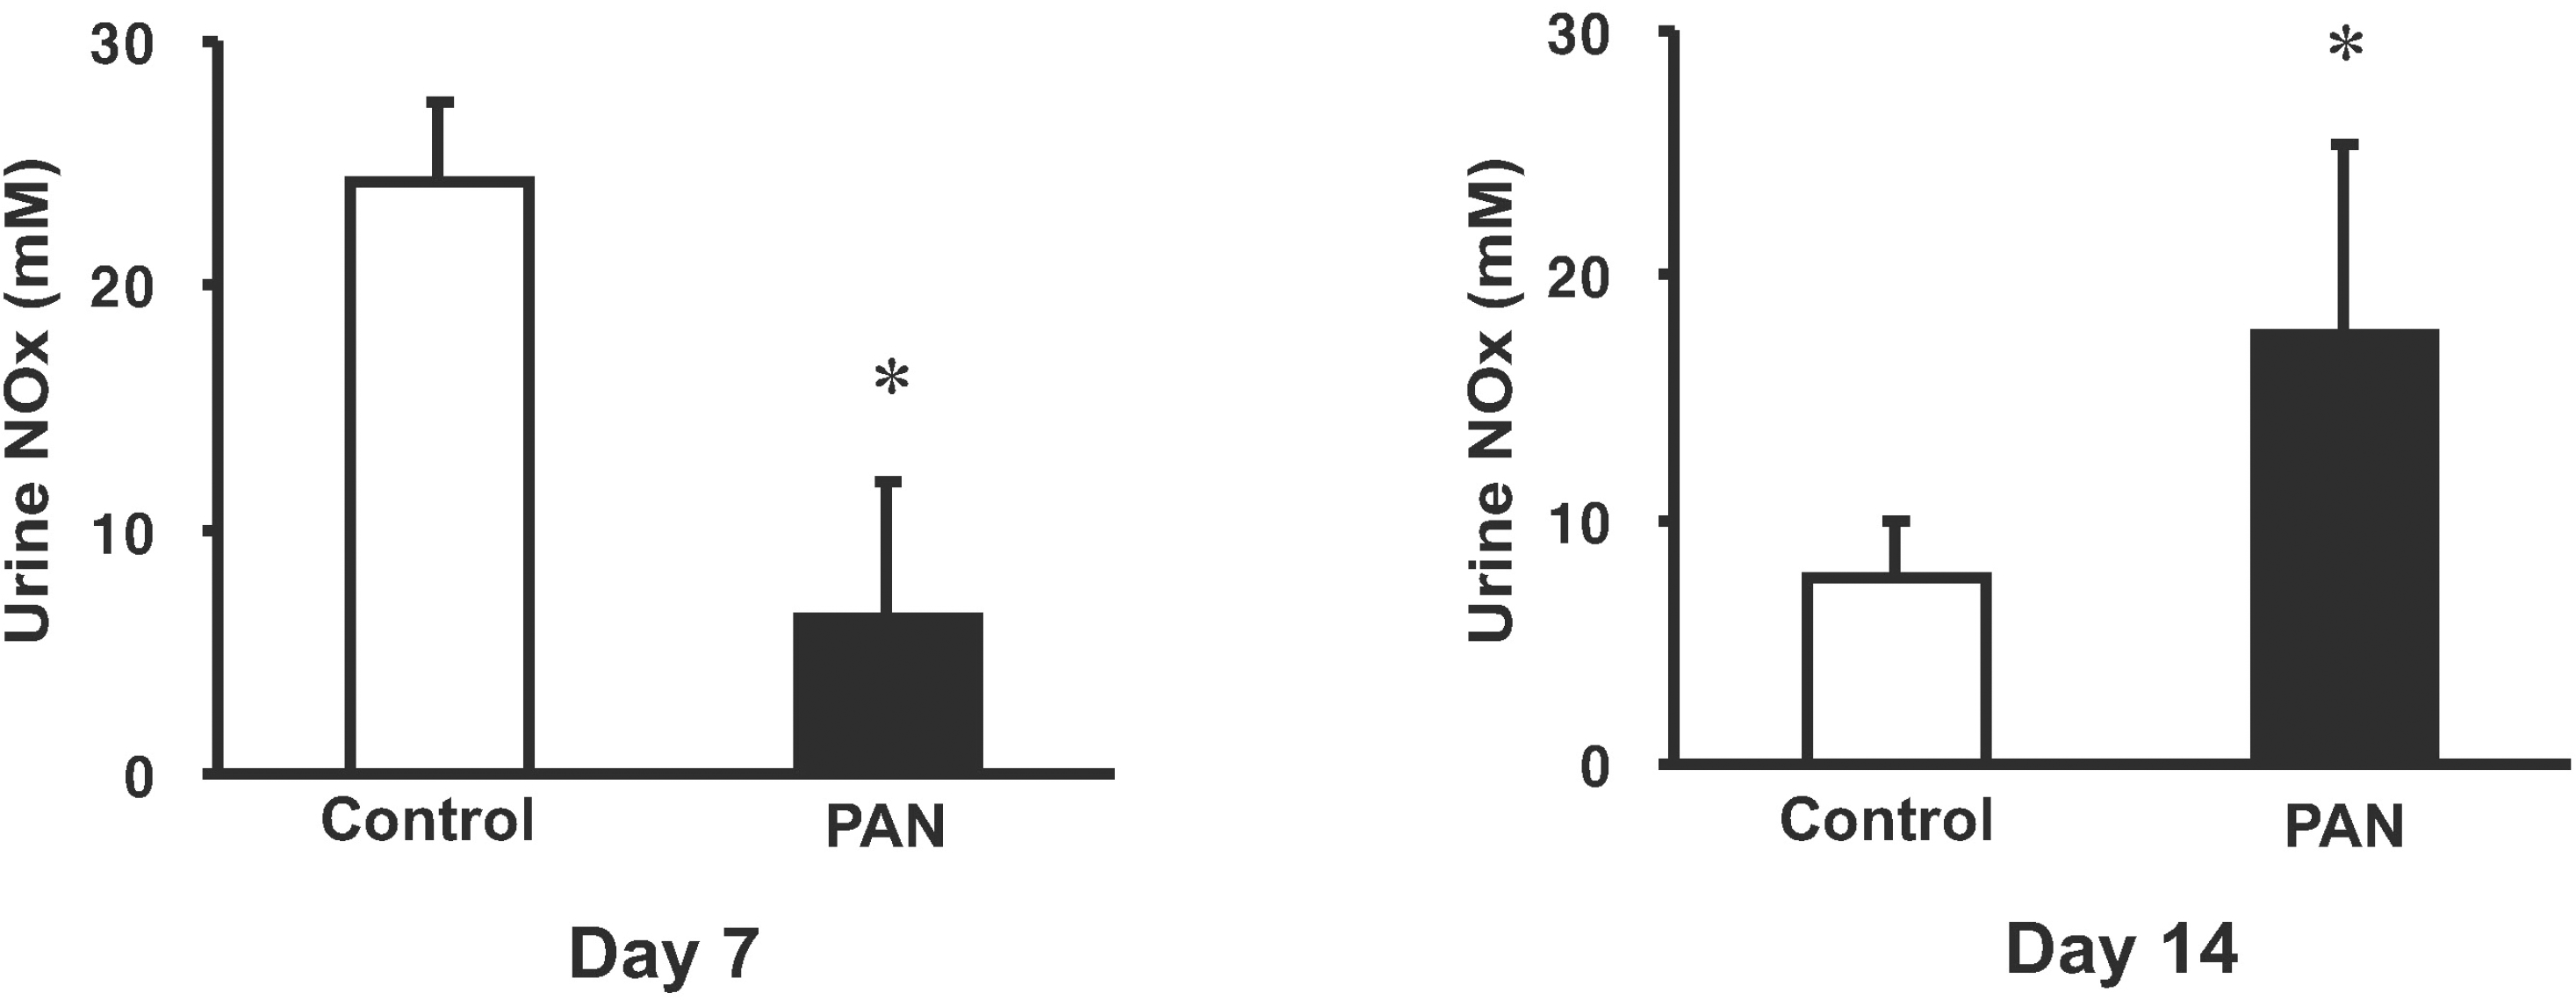
 | Fig. 4.Amount of urinary nitric oxide metabolite (NOx). Data are the mean±SEM of 8 rats for each group. ∗p<0.05 vs. control. |
Table 1.
Primers used in the polymerase chain reaction
Table 2.
Changes in renal function
| Day 7 | Day 14 | |||
|---|---|---|---|---|
| Control (n=8) | PAN (n=8) | Control (n=8) | PAN (n=8) | |
| Body weight (g) | 170±10 | 214±8∗ | 195±4 | 171±18∗ |
| Pcr (mg/dl) | 0.25±0.06 | 0.41±0.16∗ | 0.31±0.05 | 0.17±0.05∗ |
| Ccr (ml/min) | 1.47±0.4 | 0.84±0.32∗ | 1.25±0.09 | 1.90±0.74∗ |
| UNaV (mEq/day) | 2.88±0.30 | 0.62±0.24∗ | 2.79±0.30 | 3.57±0.82 |
| FENa (%) | 0.92±0.12 | 0.48±0.09∗ | 1.12±0.15 | 1.02±0.35 |
| Na balance(mmol/day) | –1.38±0.29 | 0.31±0.09∗ | –1.57±0.35 | –2.27±0.79 |
Values are expressed as mean±SEM. These values were measured on the last day of the experiment. P-Cr, plasma creatinine; Ccr, creatinine clearance; UNaV, rate of urinary sodium excretion; FENa, fractional excretion of sodium into urine; Na balance, the difference between dietary sodium intake and urinary sodium excretion.
Table 3.
Protein expression of nitric oxide synthase and soluble guanylyl cyclase in the kidney
| Day 7 | Day 14 | |||
|---|---|---|---|---|
| Control (n=5) | PAN (n=5) | Control (n=5) | PAN (n=5) | |
| eNOS | 1.00±0.08 | 1.17±0.08 | 1.00±0.20 | 1.26±0.34 |
| nNOS | 1.00±0.05 | 0.41±0.12∗ | 1.00±0.05 | 0.81±0.13 |
| iNOS | 1.00±0.08 | 0.98±0.10 | 1.00±0.07 | 1.13±0.08 |
| sGC | 1.00±0.20 | 1.20±0.21 | 1.00±0.14 | 0.96±0.12 |


 PDF
PDF ePub
ePub Citation
 Print
Print


 XML Download