Abstract
OLETF (Otsuka Long-Evans Tokushima Fatty) rats are characterized by obesity-related insulin resistance, which is a phenotype of type 2 diabetes. Sulfonylurea drugs or benzoic acid derivatives as inhibitors of the ATP-sensitive potassium (KATP) channel are commercially available to treat diabetes. The present study compared sulfonylurea drugs (glimepiride and gliclazide) with one of benzoic acid derivatives (repaglinide) in regard to their long-term effect on ameliorating insulin sensitivity in OLETF rats. Each drug was dissolved and fed with drinking water from 29 weeks of age. On high glucose loading at 45 weeks of age, response of blood glucose recovery was the greatest in the group treated with glimepiride. On immunohistochemistry analysis for the Kir6.2 subunit of KATP channels, insulin receptor β-subunits, and glucose transporters (GLUT) type 2 and 4 in liver, fat and skeletal muscle tissues, the sulfonylurea drugs (glimepiride and gliclazide) were more effective than repaglinide in recovery from their decreased expressions in OLETF rats. From these results, it seems to be plausible that KATP-channel inhibitors containing sulfonylurea moiety may be much more effective in reducing insulin resistance than those with benzoic acid moiety. In contrast to gliclazide, non-tissue selectivity of glimepiride on KATP channel inhibition may further strengthen an amelioration of insulin sensitivity unless considering other side effects.
Go to : 
REFERENCES
Abel ED., Peroni O., Kim JK., Kim YB., Boss O., Hadro E., Minnemann T., Shulman GI., Kahn BB. Adipose-selective targeting of the GLUT4 gene impairs insulin action in muscle and liver. Nature. 409:729–733. 2001.

Ashcroft FM. ATP-sensitive potassium channelopathies: focus on insulin secretion. J Clin Invest. 115:2047–2058. 2005.

Bajaj M., Defronzo RA. Metabolic and molecular basis of insulin resistance. J Nucl Cardiol. 10:311–323. 2003.

Boyd JJ., Contreras I., Kern M., Tapscott EB., Downes DL., Frisell WR., Dohm GL. Effect of a high-fat-sucrose diet on in vivo insulin receptor kinase activation. Am J Physiol. 259:E111–116. 1990.
Eisenberg ML., Maker AV., Slezak LA., Nathan JD., Sritharan KC., Jena BP., Geibel JP., Andersen DK. Insulin receptor (IR) and glucose transporter 2 (GLUT2) proteins form a complex on the rat hepatocyte membrane. Cell Physiol Biochem. 15:51–58. 2005.

Handberg A., Vaag A., Damsbo P., Beck-Nielsen H., Vinten J. Expression of insulin regulatable glucose transporters in skeletal muscle from type 2 (non-insulin-dependent) diabetic patients. Diabetologia. 33:625–627. 1990.

Hughes VA., Fiatarone MA., Fielding RA., Kahn BB., Ferrara CM., Shepherd P., Fisher EC., Wolfe RR., Elahi D., Evans WJ. Exercise increases muscle GLUT-4 levels and insulin action in subjects with impaired glucose tolerance. Am J Physiol. 264:E855–862. 1993.

Kahn BB. Lilly lecture 1995. Glucose transport: pivotal step in insulin action. Diabetes. 45:1644–1654. 1996.

Kawamori R., Morishima T., Kubota M., Matsuhisa M., Ikeda M., Kamada T. Influence of oral sulfonylurea agents on hepatic glucose uptake. Diabetes Res Clin Pract. 28(Suppl):S109–113. 1995.

Kawano K., Hirashima T., Mori S., Saitoh Y., Kurosumi M., Natori T. Spontaneous long-term hyperglycemic rat with diabetic complications. Otsuka Long-Evans Tokushima Fatty (OLETF) strain. Diabetes. 41:1422–1428. 1992.

Kern PA., Saghizadeh M., Ong JM., Bosch RJ., Deem R., Simsolo RB. The expression of tumor necrosis factor in human adipose tissue. Regulation by obesity, weight loss, and relationship to lipoprotein lipase. J Clin Invest. 95:2111–2119. 1995.

Koike T., Tomoda F., Kinuno H., Inoue H., Takata M. Abnormal renal structural alterations during the development of diabetes mellitus in Otsuka Long-Evans Tokushima Fatty rats. Acta Physiol Scand. 184:73–81. 2005.

Kumar N., Dey CS. Gliclazide increases insulin receptor tyrosine phosphorylation but not p38 phosphorylation in insulin-resistant skeletal muscle cells. J Exp Biol. 205:3739–3746. 2002.

Lebovitz HE., Feinglos MN., Bucholtz HK., Lebovitz FL. Potentiation of insulin action: a probable mechanism for the anti-diabetic action of sulfonylurea drugs. J Clin Endocrinol Metab. 45:601–604. 1977.

Marin P., Rebuffe-Scrive M., Smith U., Bjorntorp P. Glucose uptake in human adipose tissue. Metabolism. 36:1154–1160. 1987.

Miki T., Nagashima K., Tashiro F., Kotake K., Yoshitomi H., Tamamoto A., Gonoi T., Iwanaga T., Miyazaki J., Seino S. Defective insulin secretion and enhanced insulin action in KATP channel-deficient mice. Proc Natl Acad Sci U S A. 95:10402–10406. 1998.
Minami K., Morita M., Saraya A., Yano H., Terauchi Y., Miki T., Kuriyama T., Kadowaki T., Seino S. ATP-sensitive K+ channel-mediated glucose uptake is independent of IRS-1/phosphatidylinositol 3-kinase signaling. Am J Physiol Endocrinol Metab. 285:E1289–1296. 2003.
Mori Y., Komiya H., Kurokawa N., Tajima N. Comparison of the effects of glimepiride and glibenclamide on adipose tissue tumour necrosis factor-alpha mRNA expression and cellularity. Diabetes Obes Metab. 6:28–34. 2004.

Muller G., Satoh Y., Geisen K. Extrapancreatic effects of sulfonylureas-a comparison between glimepiride and conventional sulfonylureas. Diabetes Res Clin Pract. 28(Suppl):S115–137. 1995.
Pedersen O., Bak JF., Andersen PH., Lund S., Moller DE., Flier JS., Kahn BB. Evidence against altered expression of GLUT1 or GLUT4 in skeletal muscle of patients with obesity or NIDDM. Diabetes. 39:865–870. 1990.

Rodriguez E., Pulido N., Romero R., Arrieta F., Panadero A., Rovira A. Phosphatidylinositol 3-kinase activation is required for sulfonylurea stimulation of glucose transport in rat skeletal muscle. Endocrinology. 145:679–685. 2004.
Proks P., Reimann F., Green N., Gribble F., Ashcroft F. Sulfonylurea stimulation of insulin secretion. Diabetes. 51(Suppl 3):S368–376. 2002.

Schernthaner G., Grimaldi A., Di Mario U., Drzewoski J., Kempler P., Kvapil M., Novials A., Rottiers R., Rutten GE., Shaw KM. GUIDE study: double-blind comparison of once-daily gliclazide MR and glimepiride in type 2 diabetic patients. Eur J Clin Invest. 34:535–542. 2004.

Toide K., Man ZW., Asahi Y., Sato T., Nakayama N., Noma Y., Oka Y., Shima K. Glucose transporter levels in a male spontaneous non-insulin-dependent diabetes mellitus rat of the Otsuka Long-Evans Tokushima Fatty strain. Diabetes Res Clin Pract. 38:151–160. 1997.

UKPDS. Intensive blood-glucose control with sulfonylureas or insulin compared with conventional treatment and risk of complications in patients with type 2 diabetes (UKPDS 33). UK Prospective Diabetes Study (UKPDS) Group. Lancet. 352:837–853. 1998.
Go to : 
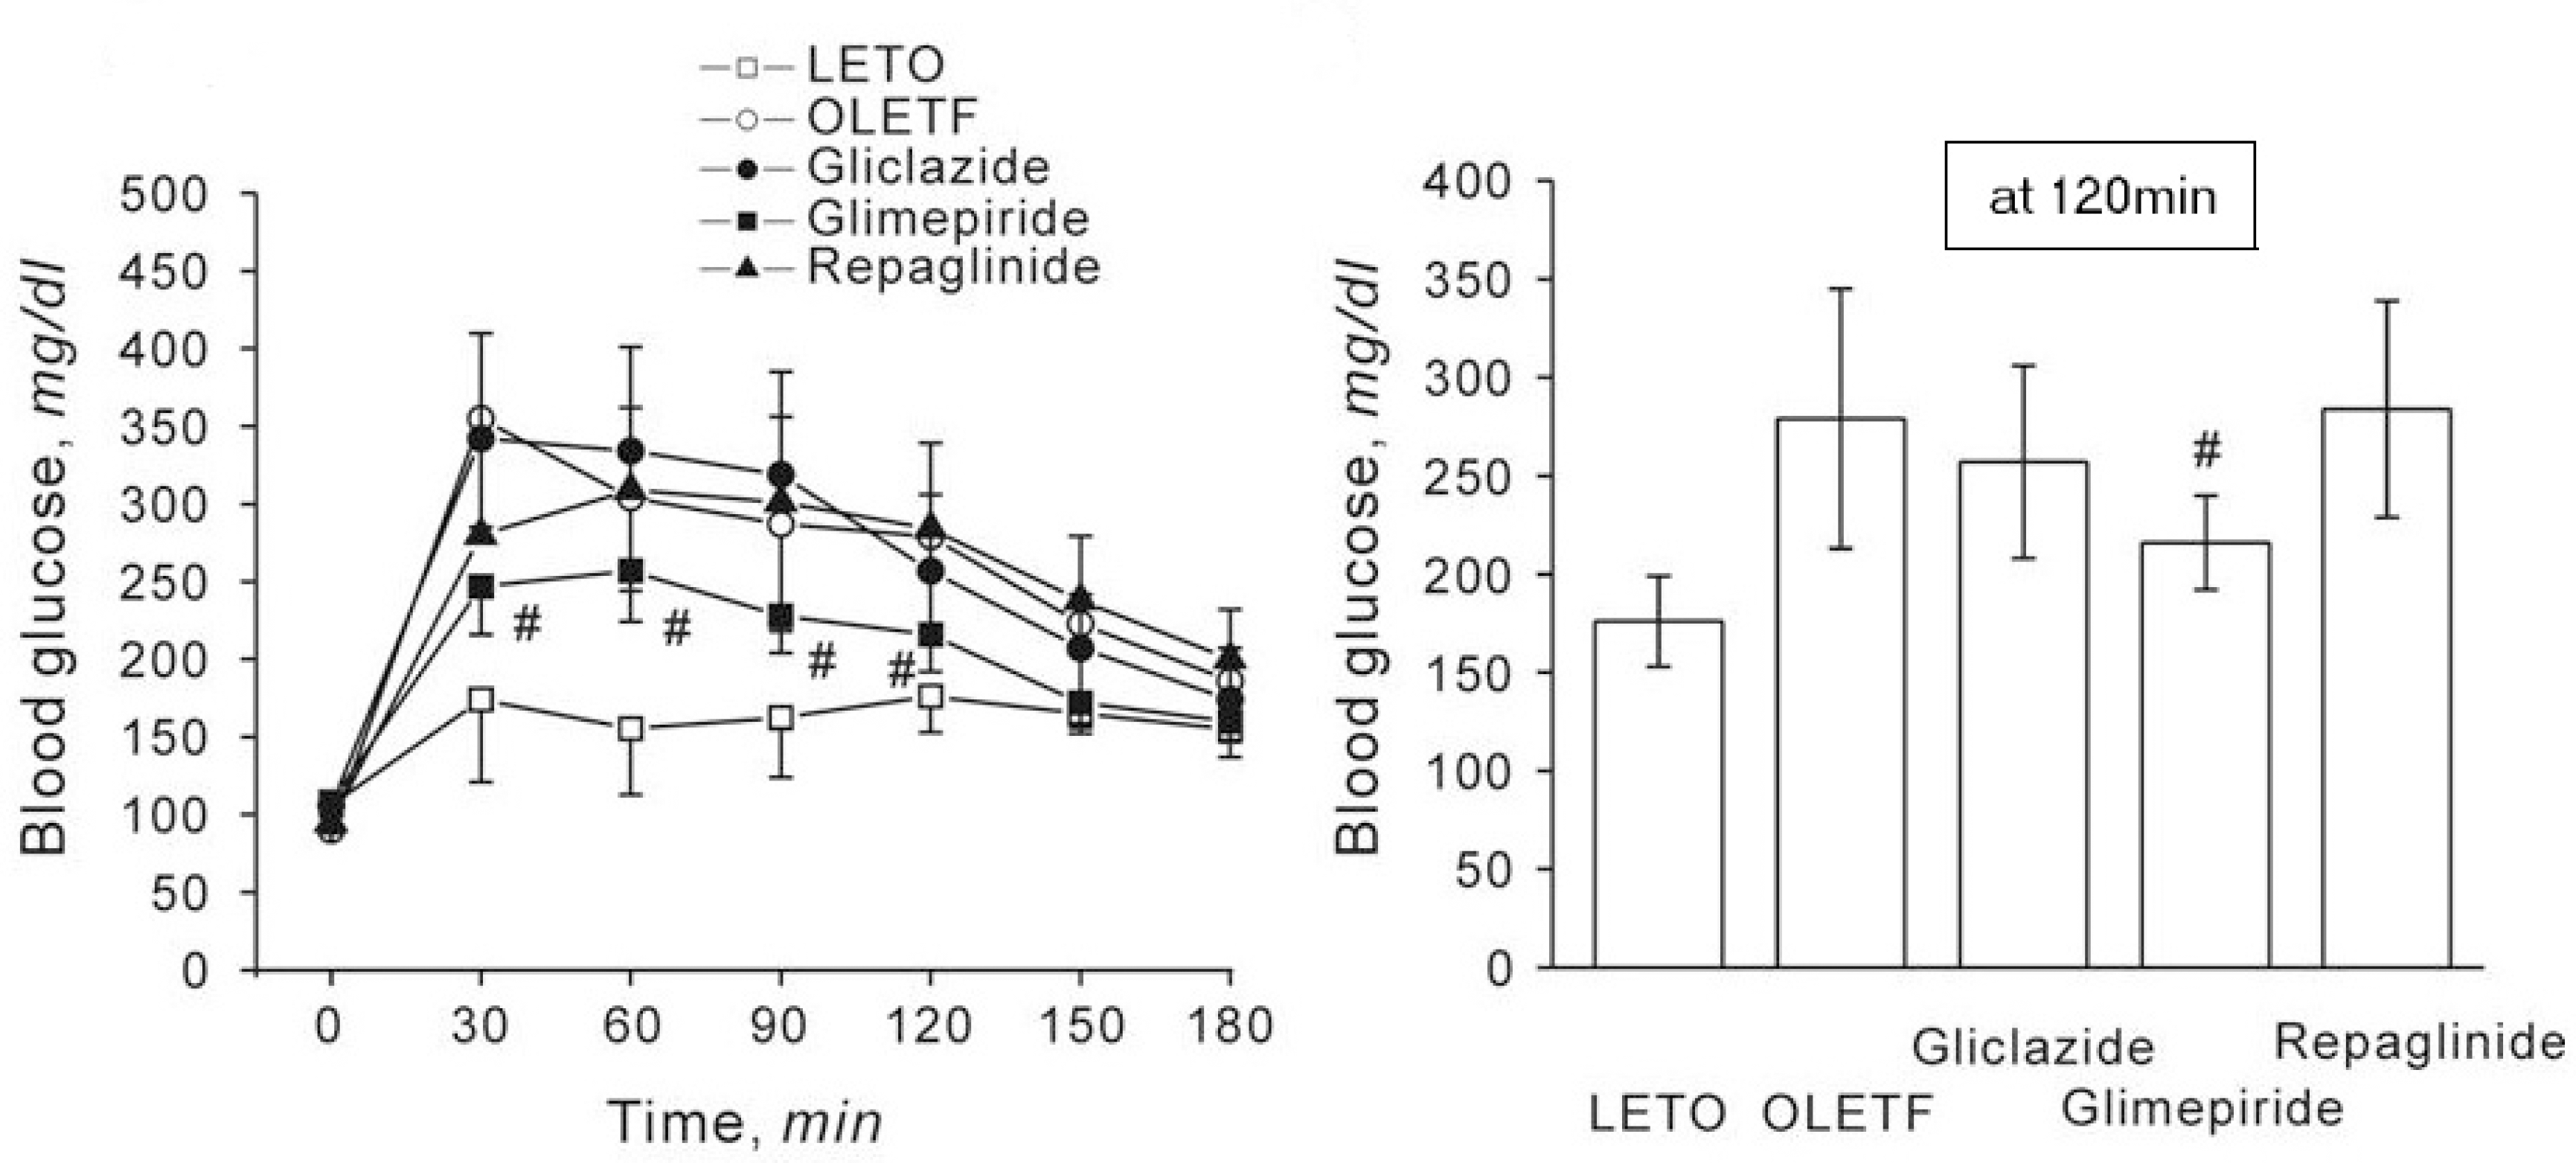 | Fig. 1.Effect of gliclazide, glimepiride or repaglinide on changes in blood glucose level in response to high glucose loading (2 g/kg, i.p.) in LETO and OLETF rats. Each drug was dissolved in drinking water during 29 through 44 weeks of age. The experiments were done with rats aged at 45 weeks, after fasting for 12 h before the experiments. Data represent mean±S.E. # p<0.05 compared to the value of OLETF control rats at the same time period. n=7 except LETO group (n=5). |
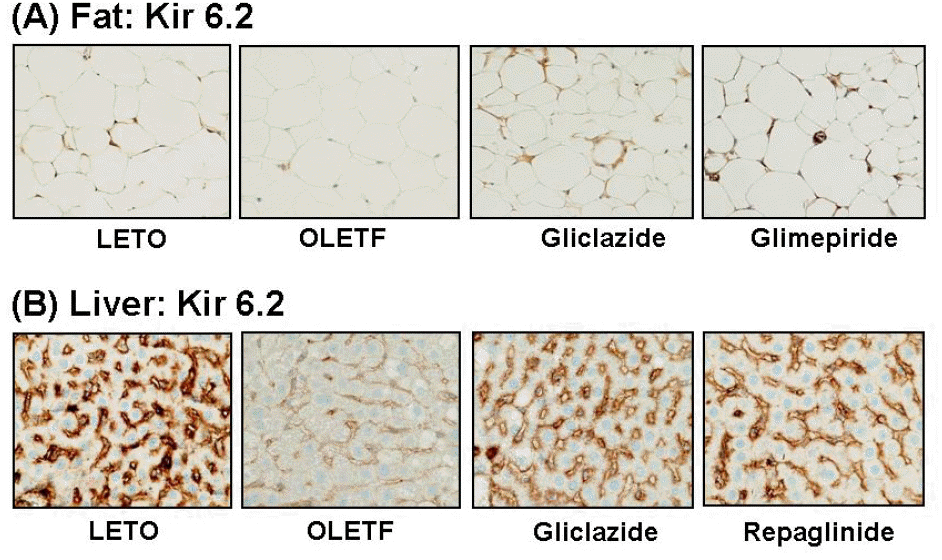 | Fig. 2.Representative photomicrographs of Kir6.2 staining in murine fat and liver. (A) Kir6.2 is expressed in the cell membrane of adipocytes in LETO rat, whereas Kir6.2 staining is markedly reduced in OLETF rat. It is recovered by treatment with gliclazide or glimepiride. (B) Kir6.2 is expressed on the sinusoids of hepatocytes in LETO rat, but it is markedly reduced in OLETF rat. Staining is increased at the sinusoids by treatment with gliclazide, repaglinide or glimepiride. |
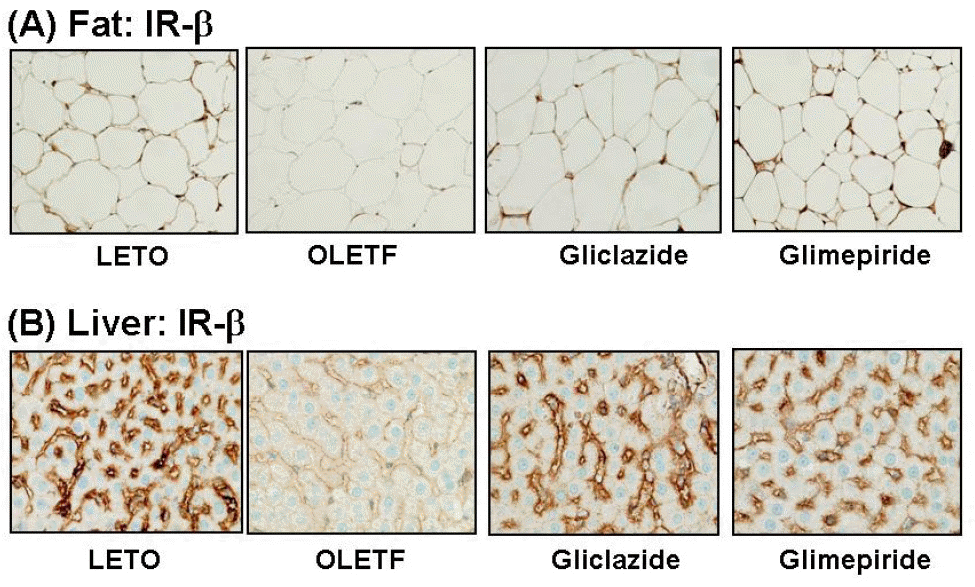 | Fig. 3.Representative photomicrographs of IR-β staining in murine fat and liver. (A) IR-β is expressed in the cell membrane of adipocytes of LETO rat, whereas staining is less in the cytoplasmic membrane in OLETF rat. It is recovered by treatment with gliclazide or glimepiride. (B) IR-β is strongly expressed on the sinusoids of hepatocytes in LETO rat, but it is markedly reduced in OLETF rat. Staining is increased at the sinusoids by treatment with gliclazide or glimepiride. |
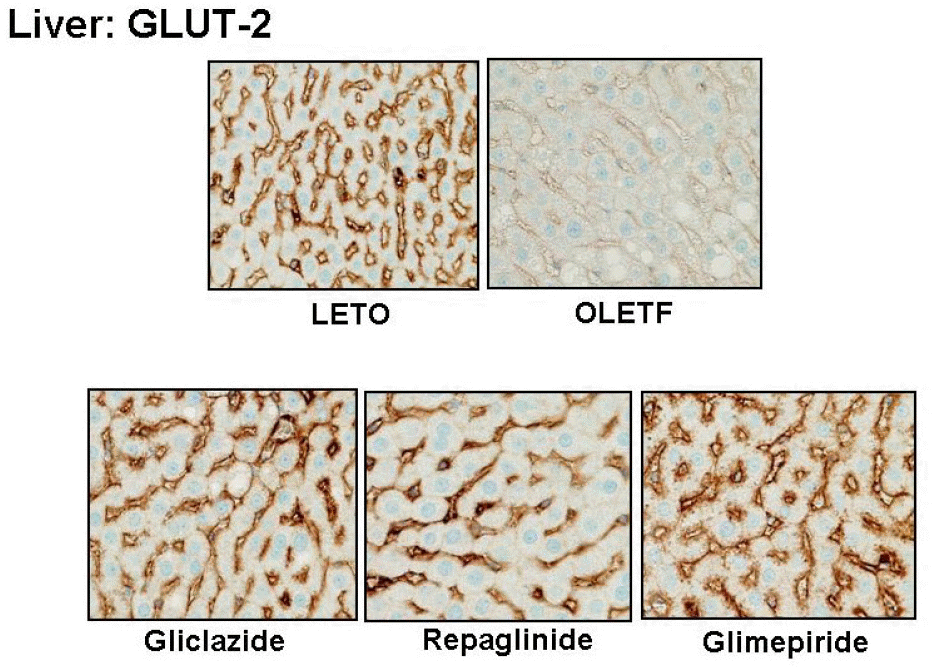 | Fig. 4.Representative photomicrographs of GLUT-2 staining in murine liver. GLUT-2 is expressed in the sinusoids of hepatocytes in LETO rat, whereas GLUT-2 immunoreactivity is reduced in OLETF rat. In the groups treated with gliclazide, repaglinide, or glimepiride, GLUT-2 expression is enhanced. |
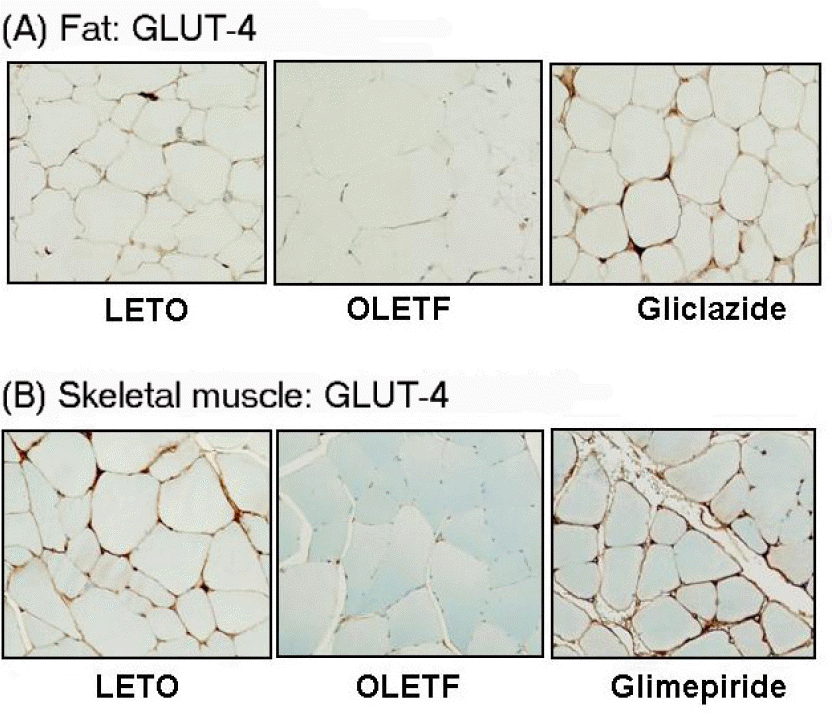 | Fig. 5.Representative photomicrographs of GLUT-4 staining in murine fat and skeletal muscles. (A) GLUT-4 is expressed in the cell membrane of adipocytes in LETO rat, whereas staining is faintly present in OLETF rat. In the groups treated with gliclazide or glimepiride, expression of GLUT-4 is markedly increased. (B) GLUT-4 is expressed in the sarcolemma of skeletal muscles of LETO rat, whereas staining is reduced in OLETF rat. In the groups treated with gliclazide or glimepiride, the expression of GLUT-4 is increased. |
Table 1.
Intensity of immunoflorescence of Kir6.2, IR-β, GLUT2, and GLUT4 in rat fat, liver, and skeletal muscle tissues
| LETO (n=5) | OLETF(O) (n=7) | O+Gliclazide (n=7) | O+Glimepiride (n=7) | O+Repaglinide (n=7) | |
|---|---|---|---|---|---|
| (Fluorescence intensity, arbitrary units) | |||||
| Kir6.2 | |||||
| Fat | 3.0±0.45 | 2.7±0.45 | 5.7±0.67∗ | 5.0±1.00∗ | 2.3±0.2 |
| Liver | 3.5±0.41 | 3.0±0.58 | 5.7±0.88∗ | 5.7±0.33∗ | 4.7±0.88∗ |
| Muscle | 4.5±0.41 | 5.3±0.88 | 4.0±0.55 | 4.0±1.00 | 4.3±0.33 |
| IR-β | |||||
| Fat | 4.5±0.41 | 4.0±0.58 | 6.3±0.67∗ | 6.7±0.33∗ | 4.3±0.33 |
| Liver | 6.5±0.41 | 2.7±1.45 | 5.7±0.33∗ | 5.0±0.45∗ | 2.3±0.45 |
| Muscle | 3.5±0.41 | 3.7±0.88 | 2.7±0.33 | 3.3±0.88 | 3.0±0.58 |
| GLUT2 | |||||
| Liver | 4.0±0.34 | 1.0±0.12 | 4.0±0.33∗ | 4.7±0.33∗ | 4.2±0.67∗ |
| GLUT4 | |||||
| Fat | 4.0±0.82 | 3.0±0.88 | 5.0±0.65∗ | 5.0±0.67∗ | 4.3±0.58 |
| Muscle | 4.5±0.22 | 3.7±0.86 | 5.0±0.45∗ | 5.0±0.58∗ | 2.7±0.33 |


 PDF
PDF ePub
ePub Citation
 Print
Print


 XML Download