

 PDF
PDF ePub
ePub Citation
 Print
Print


Abstract
The present study was aimed to determine whether there is an altered regulation of tubular transporters in gentamicin-induced nephropathy. Sprague-Dawley male rats (200~250 g) were subcutaneously injected with gentamicin (100 mg/kg per day) for 7 days, and the expression of tubular transporters was determined by immunoblotting and immunohistochemistry. The mRNA and protein expression of OAT was also determined. Gentamicin-treated rats exhibited significantly decreased creatinine clearance along with increased plasma creatinine levels. Accordingly, the fractional excretion of sodium increased. Urine volume was increased, while urine osmolality and free water reabsorption were decreased. Immunoblotting and immunohistochemistry revealed decreased expression of Na+/K+ -ATPase, NHE3, NBC1, and AQP1 in the kidney of gentamicin-treated rats. The expression of OAT1 and OAT3 was also decreased. Gentamicin-induced nephropathy may at least in part be causally related with a decreased expression of Na+/K+-ATPase, NHE3, NBC1, AQP1 and OAT.
Go to : 
REFERENCES
Bae EH., Kim IJ., Oh YW., Bae WK., Park JW., Ma SK., Kim NH., Choi KC., Lee J., Kim SH., Kim SW. Increased expression of endothelin-1 and CYP11B2 in gentamicin-induced nephropathy in rat kidney. Korean J Nephrol. 26:660–668. 2007.
Bae EH., Lee KS., Lee J., Ma SK., Kim NH., Choi KC., Frokiaer J., Nielsen S., Kim SY., Kim SZ., Kim SH., Kim SW. Effects of alpha-lipoic acid on ischemia-reperfusion-induced renal dysfunction in rats. Am J Physiol Renal Physiol. 294:F272–280. 2008.
Baylis C., Rennke HR., Brenner BM. Mechanisms of the defect in glomerular ultrafiltration associated with gentamicin administration. Kidney Int. 12:344–353. 1977.

Bennett WM. Drug nephrotoxicity: an overview. Ren Fail. 19:221–224. 1997.
Besarab A., Silva P., Epstein FH. Multiple pumps for sodium reabsorption by the perfused kidney. Kidney Int. 10:147–153. 1976.
Gainza FJ., Minguela JI., Lampreabe I. Aminoglycoside- associated Fanconi's syndrome: an underrecognized entity. Nephron. 77:205–211. 1997.
Katz AI., Doucet A., Morel F. Na-K-ATPase activity along the rabbit, rat, and mouse nephron. Am J Physiol. 237:F114–120. 1979.
Lee J., Yoo KS., Kang DG., Kim SW., Choi KC. Gentamicin decreases the abundance of aquaporin water channels in rat kidney. Jpn J Pharmacol. 85:391–398. 2001.
Mahnensmith RL., Aronson PS. The plasma membrane sodium-hydrogen exchanger and its role in physiological and patho-physiological processes. Circ Res. 56:773–788. 1985.
Pastoriza-Munoz E., Bowman RL., Kaloyanides GJ. Renal tubular transport of gentamicin in the rat. Kidney Int. 16:440–450. 1979.
Preisig PA., Ives HE., Cragoe EJ Jr., Alpern RJ., Rector FC Jr. Role of the Na+/H+ antiporter in rat proximal tubule bicarbonate absorption. J Clin Invest. 80:970–978. 1987.
Soleimani M., Grassi SM., Aronson PS. Stoichiometry of Na+ -HCO-3 cotransport in basolateral membrane vesicles isolated from rabbit renal cortex. J Clin Invest. 79:1276–1280. 1987.
Sweet DH. Organic anion transporter (Slc22a) family members as mediators of toxicity. Toxicol Appl Pharmacol. 204:198–215. 2005.
Sweet DH., Chan LM., Walden R., Yang XP., Miller DS., Pritchard JB. Organic anion transporter 3 (Slc22a8) is a dicarboxylate exchanger indirectly coupled to the Na+ gradient. Am J Physiol Renal Physiol. 284:F763–769. 2003.
van Montfoort JE., Hagenbuch B., Groothuis GM., Koepsell H., Meier PJ., Meijer DK. Drug uptake systems in liver and kidney. Curr Drug Metab. 4:185–211. 2003.
Go to :
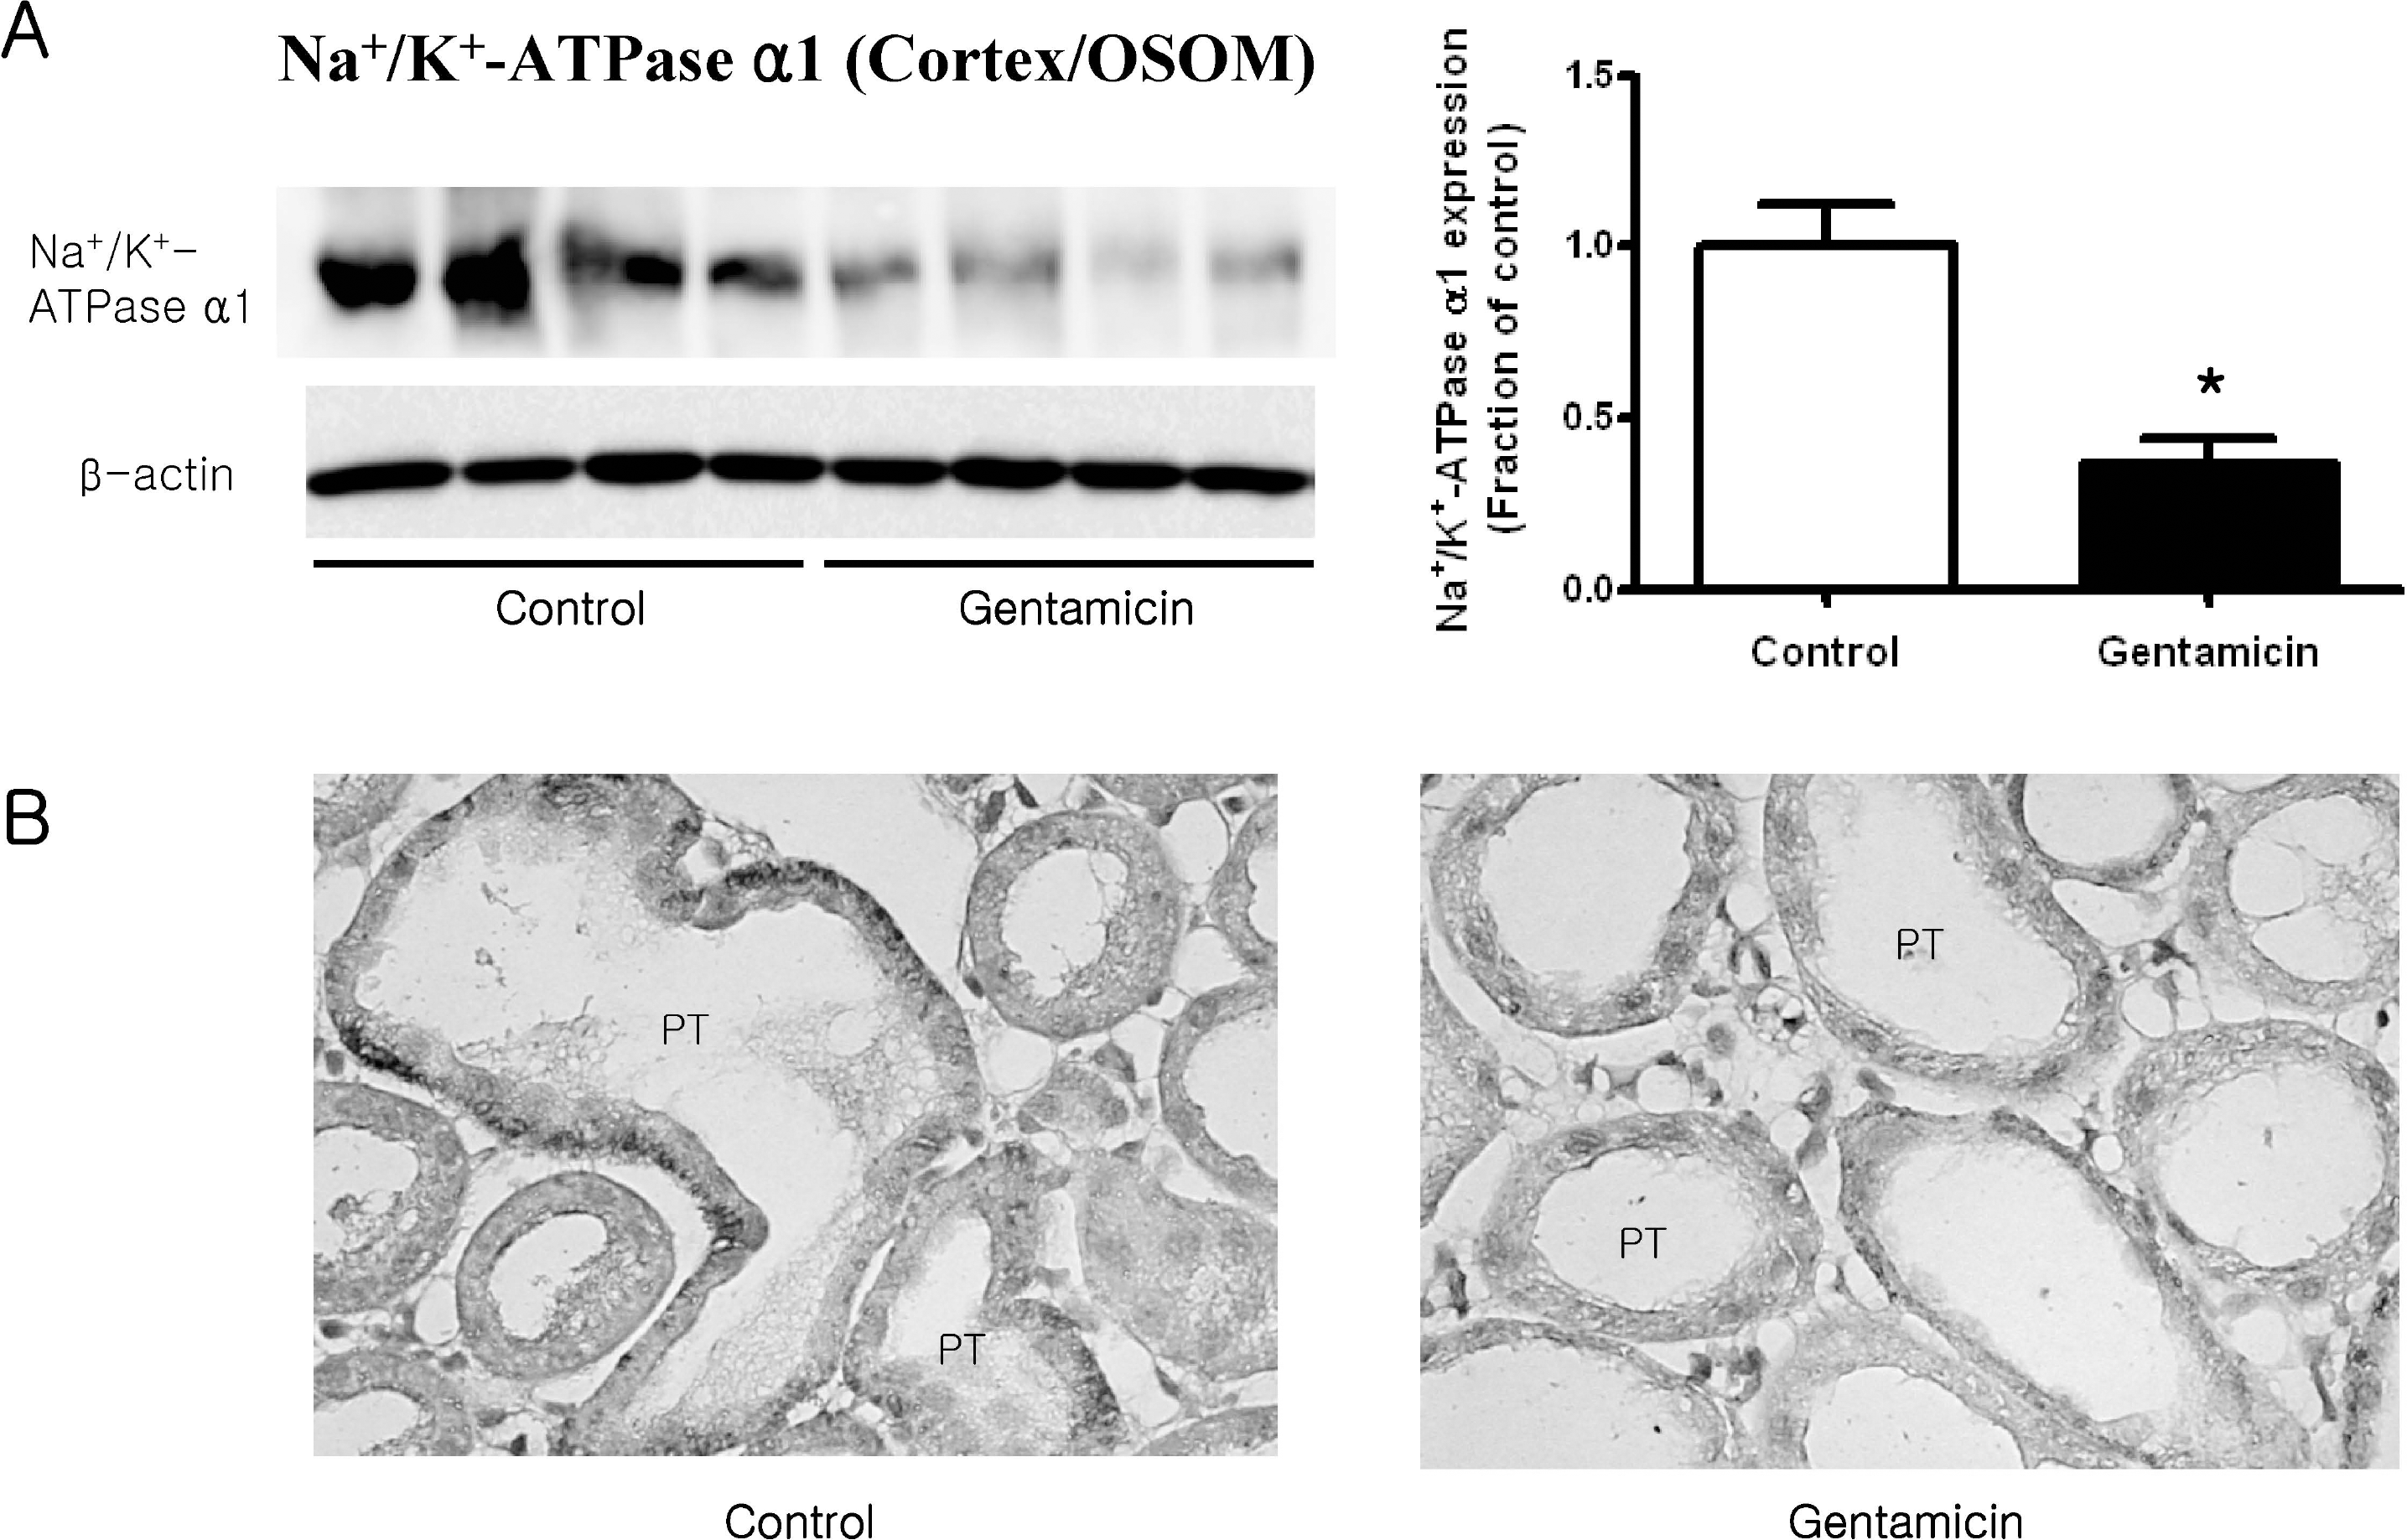 | Fig. 1.Expression of Na+/K+-ATPase in cortex/OSOM. (A) The expression of Na+/K+-ATPase was significantly decreased in gentamicin-treated rats, while that of β-actin remained unaltered. Each column represents mean±SEM of 4 rats (∗p<0.05, compared with control). (B) Immunostaining of Na+/K+-ATPase showed decreased expression in gentamicintreated rats. Magnification ×400. |
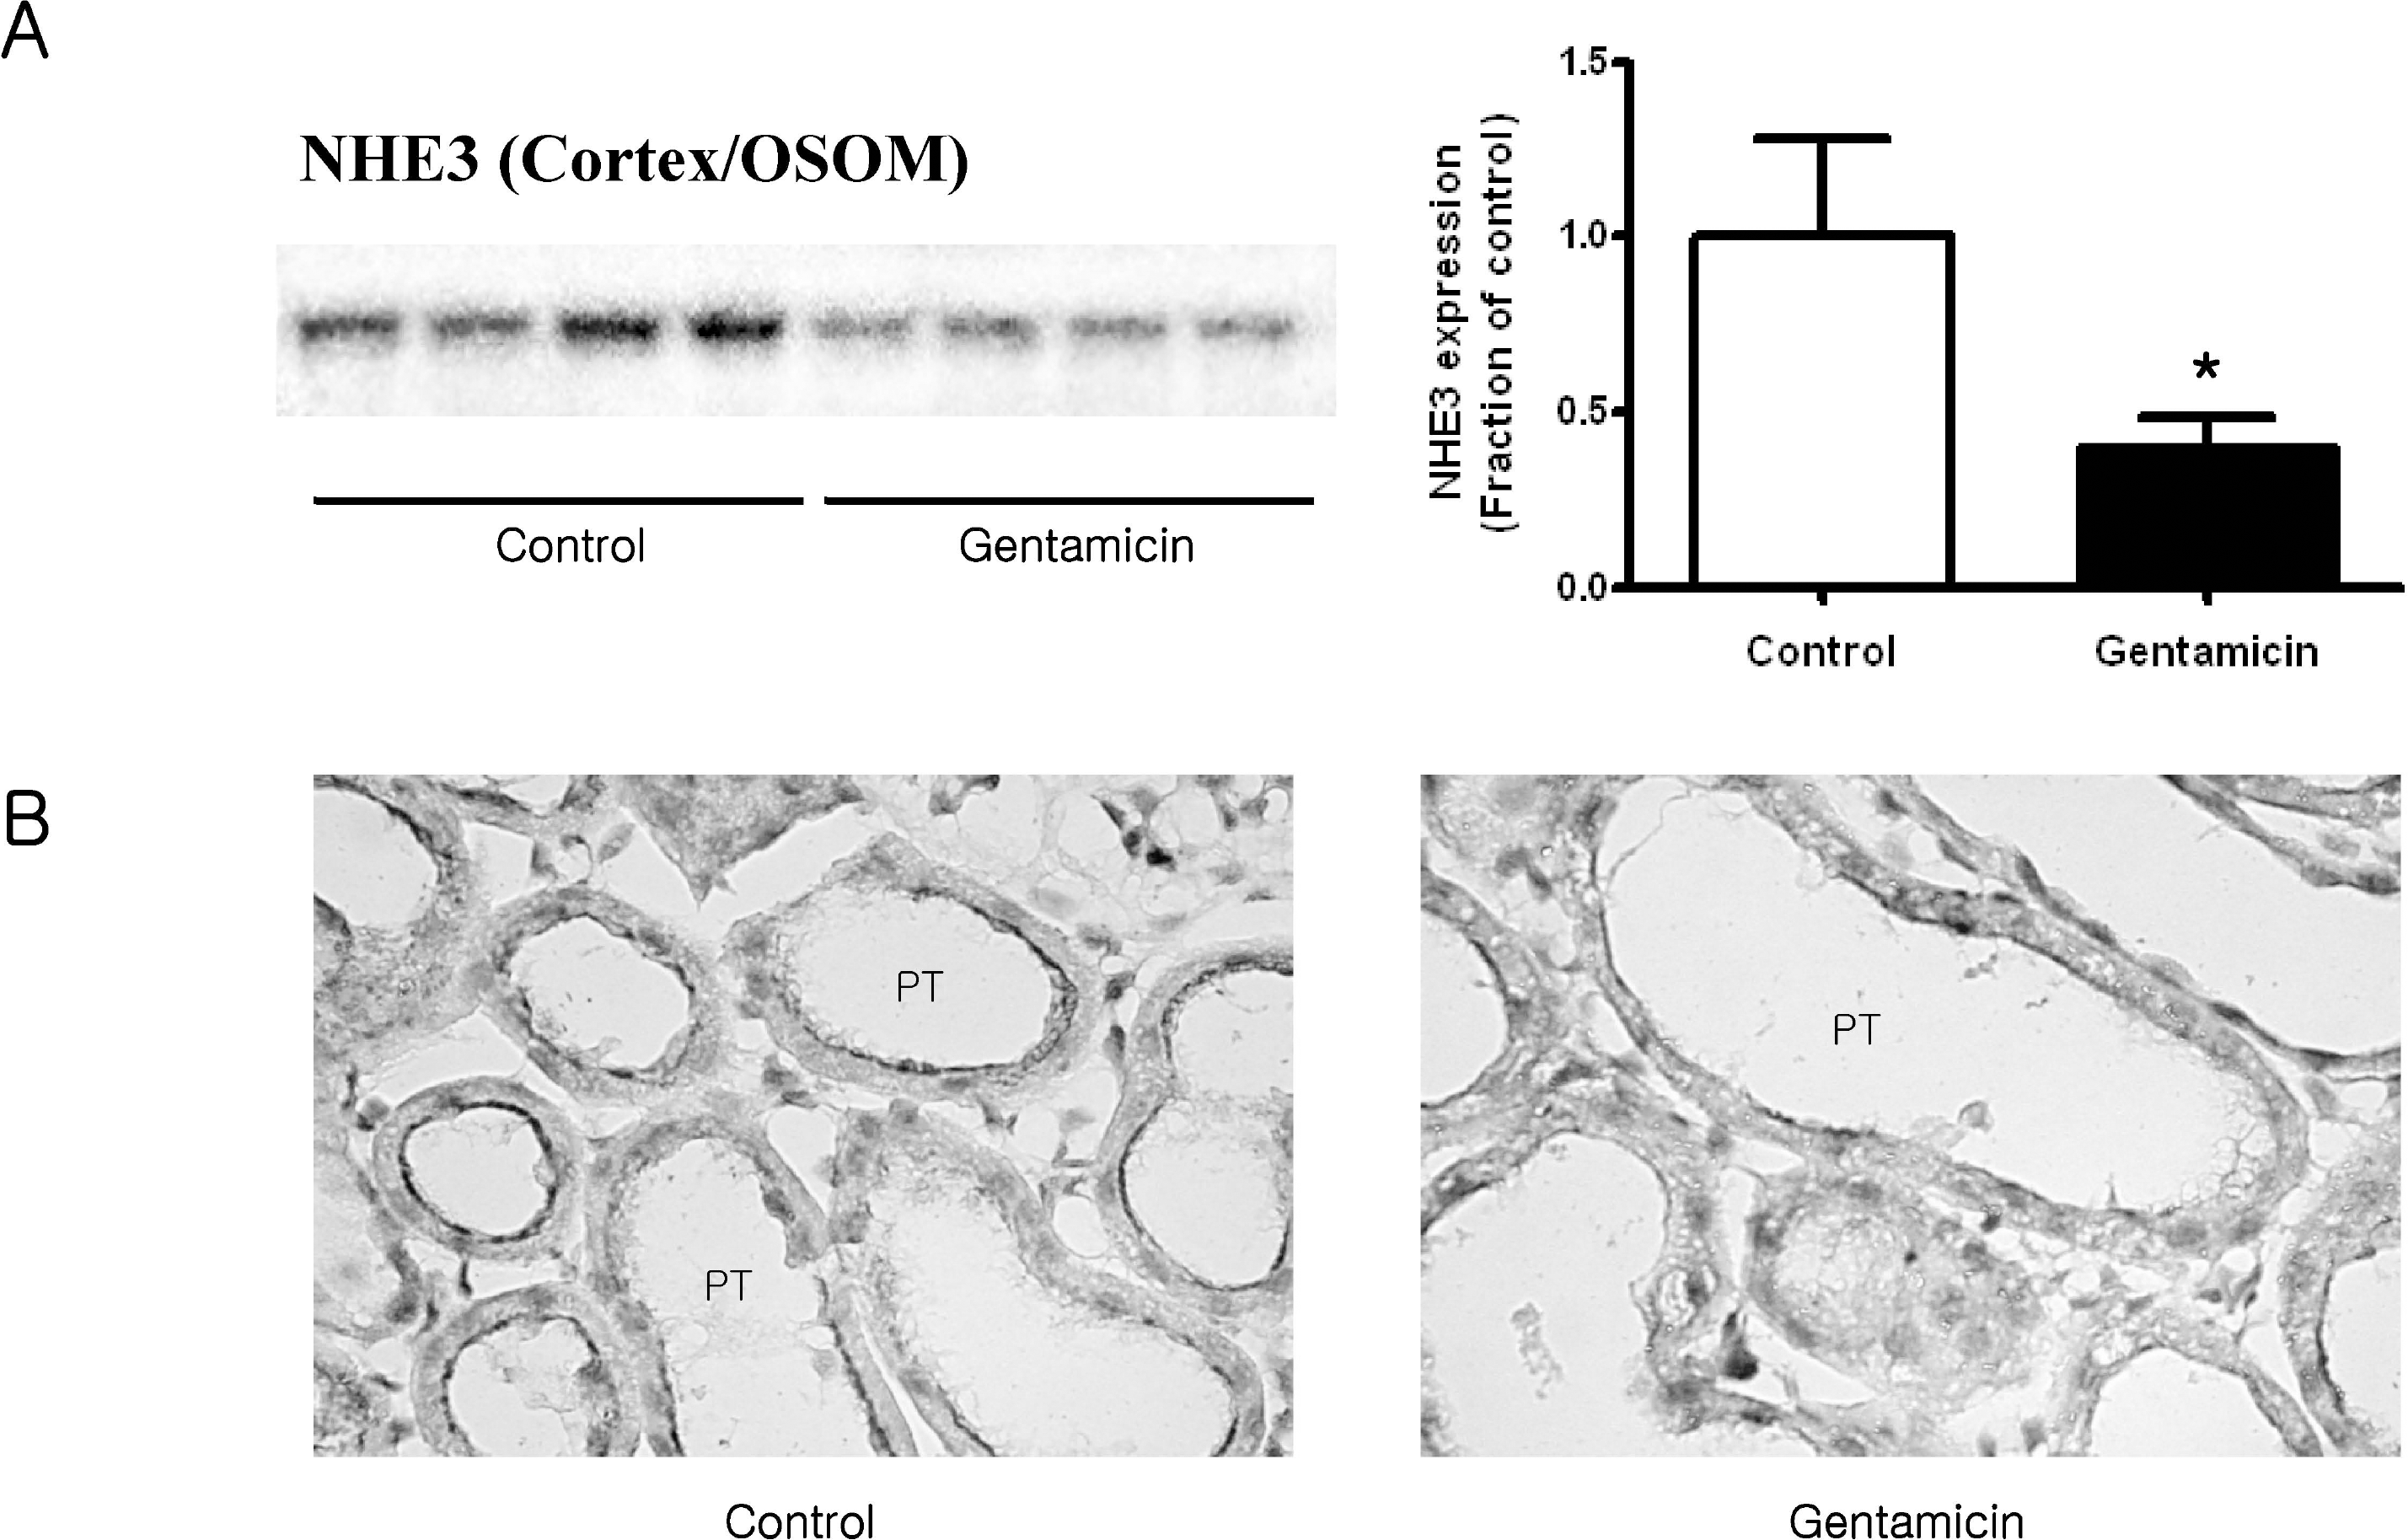 | Fig. 2.Expression of NHE3 in cortex/OSOM. (A) The protein expression of NHE3 was significantly decreased in gentamicin-treated rats. Each column represents mean±SEM of 4 rats (∗p <0.05, compared with control). (B) Immunostaining of NHE3 showed decreased expression in gentamicintreated rats. Magnification ×400. |
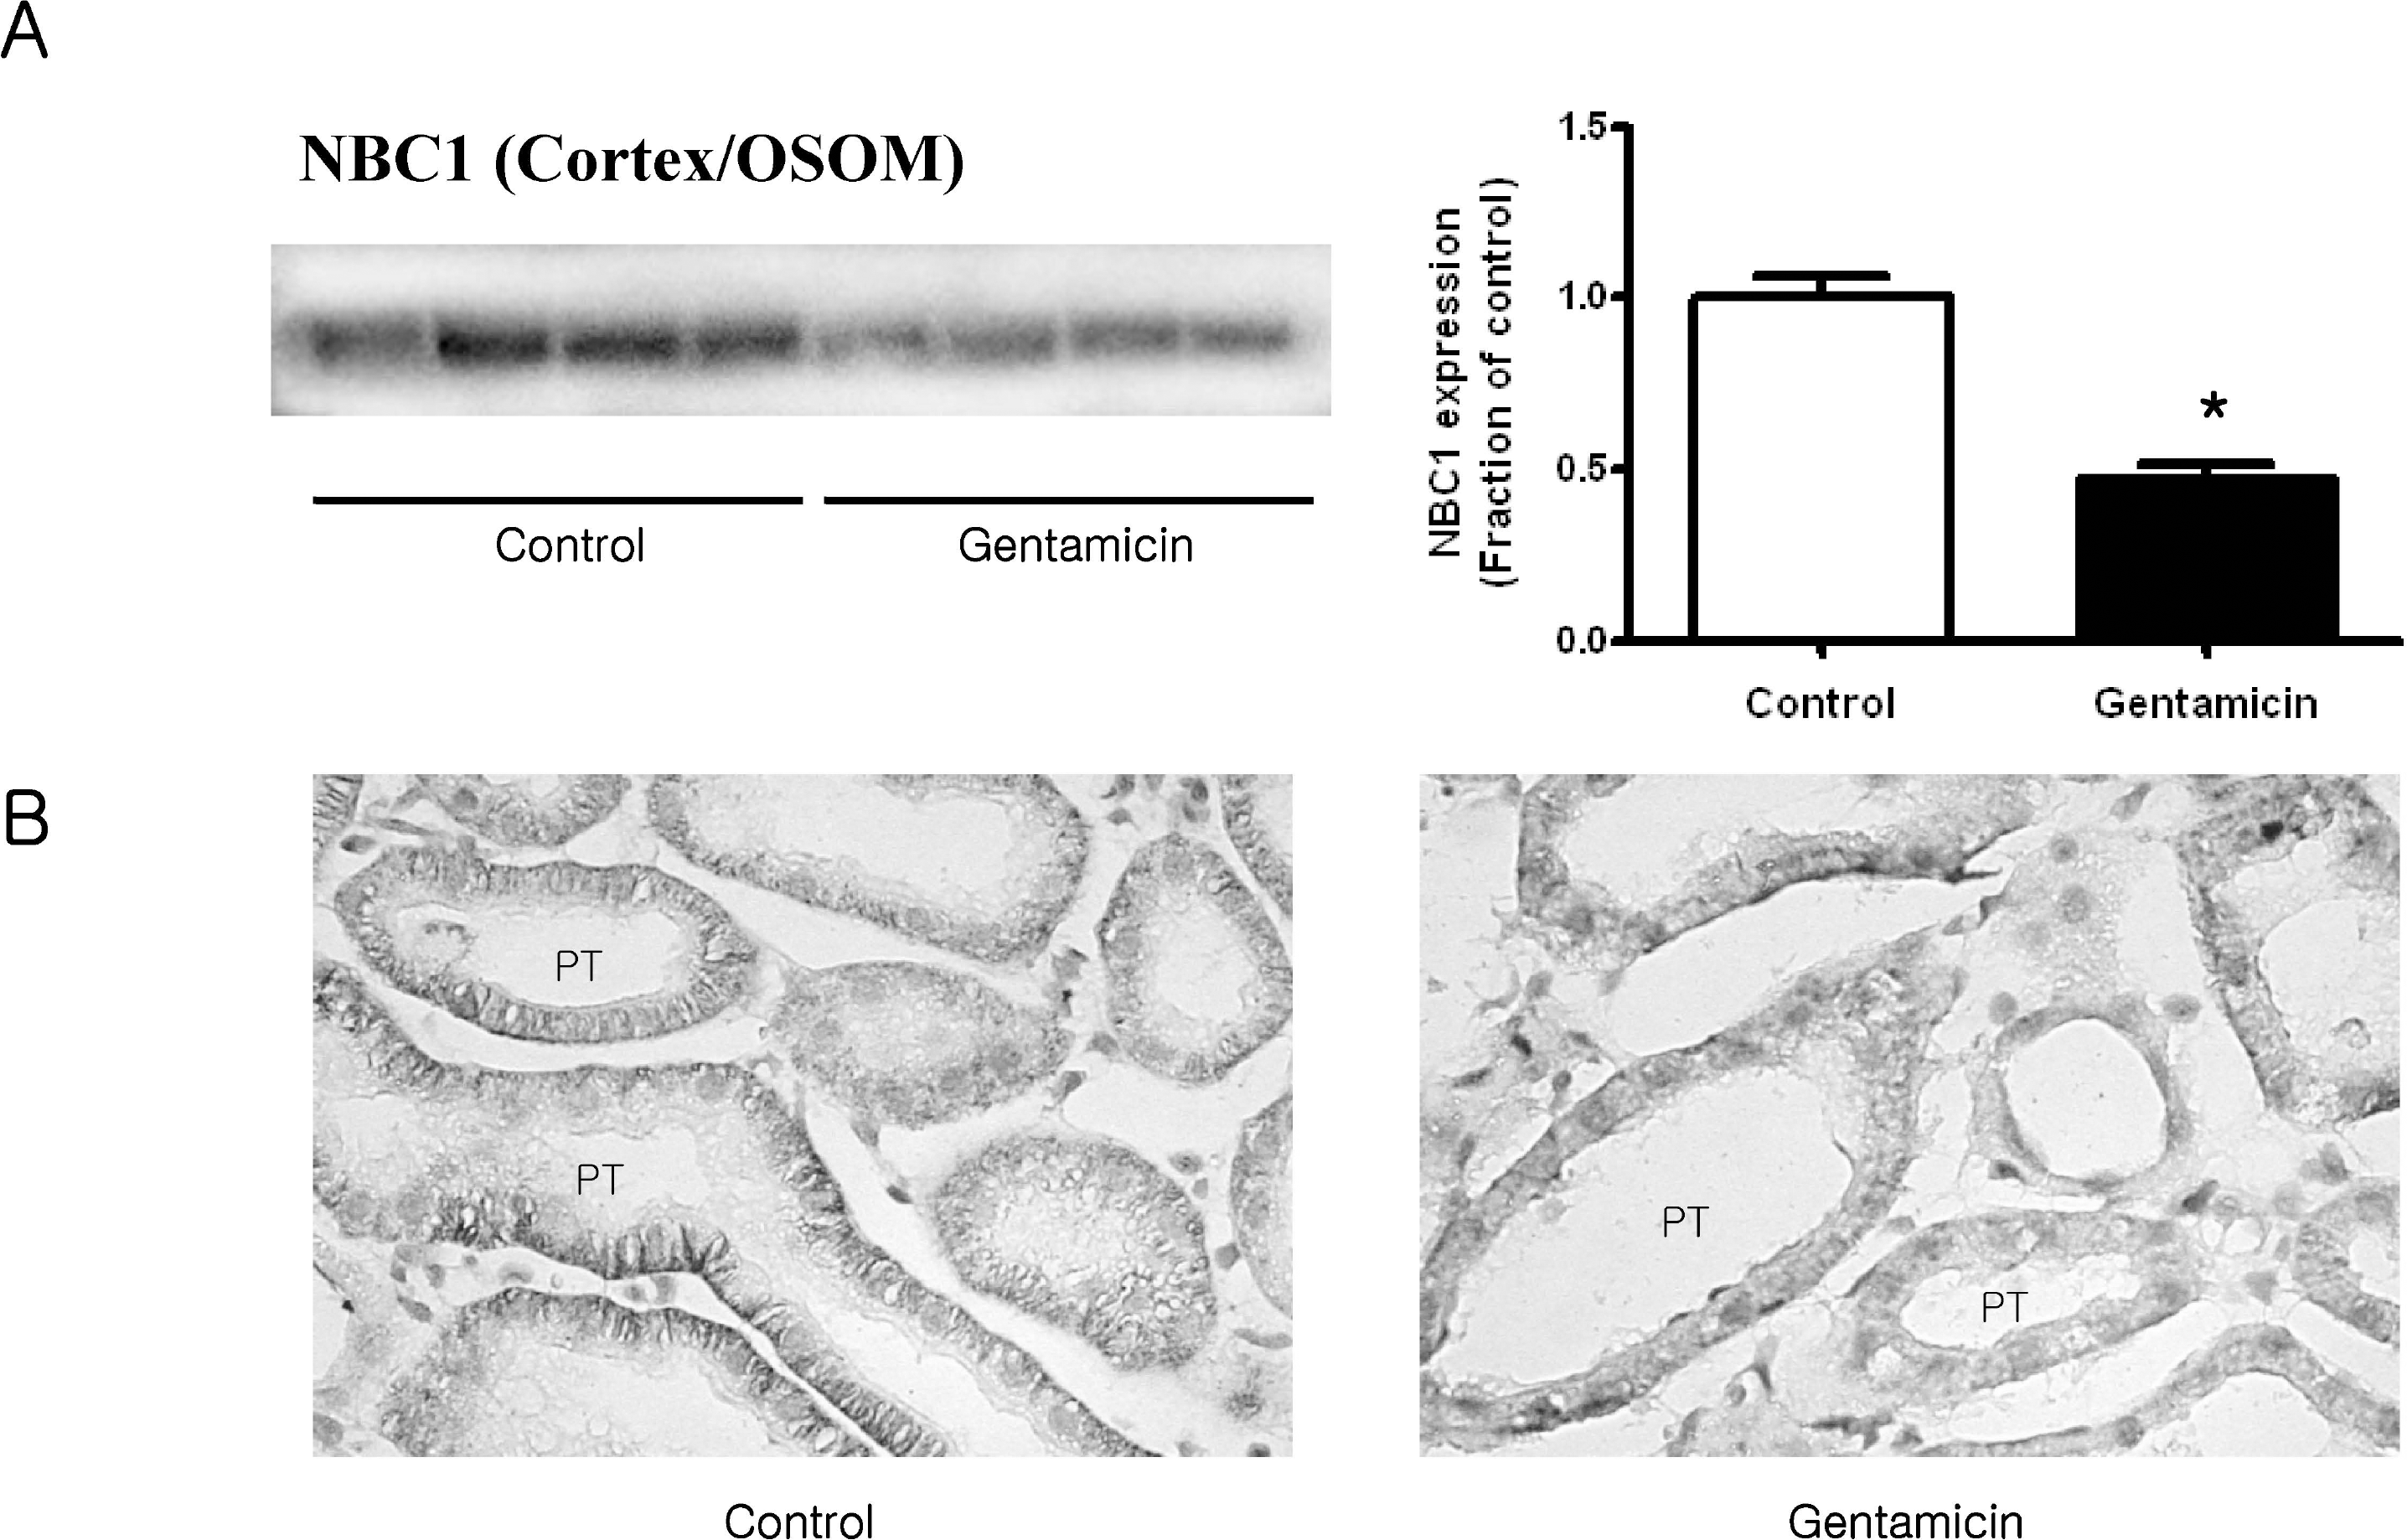 | Fig. 3.Expression of NBC1 in cortex/OSOM. (A) The protein expression of NBC1 was significantly decreased in gentamicin-treated rats. Each column represents mean±SEM of 4 rats (∗p <0.05, compared with control). (B) Immunostaining of NBC1 showed decreased expression in gentamicintreated rats. Magnification ×400. |
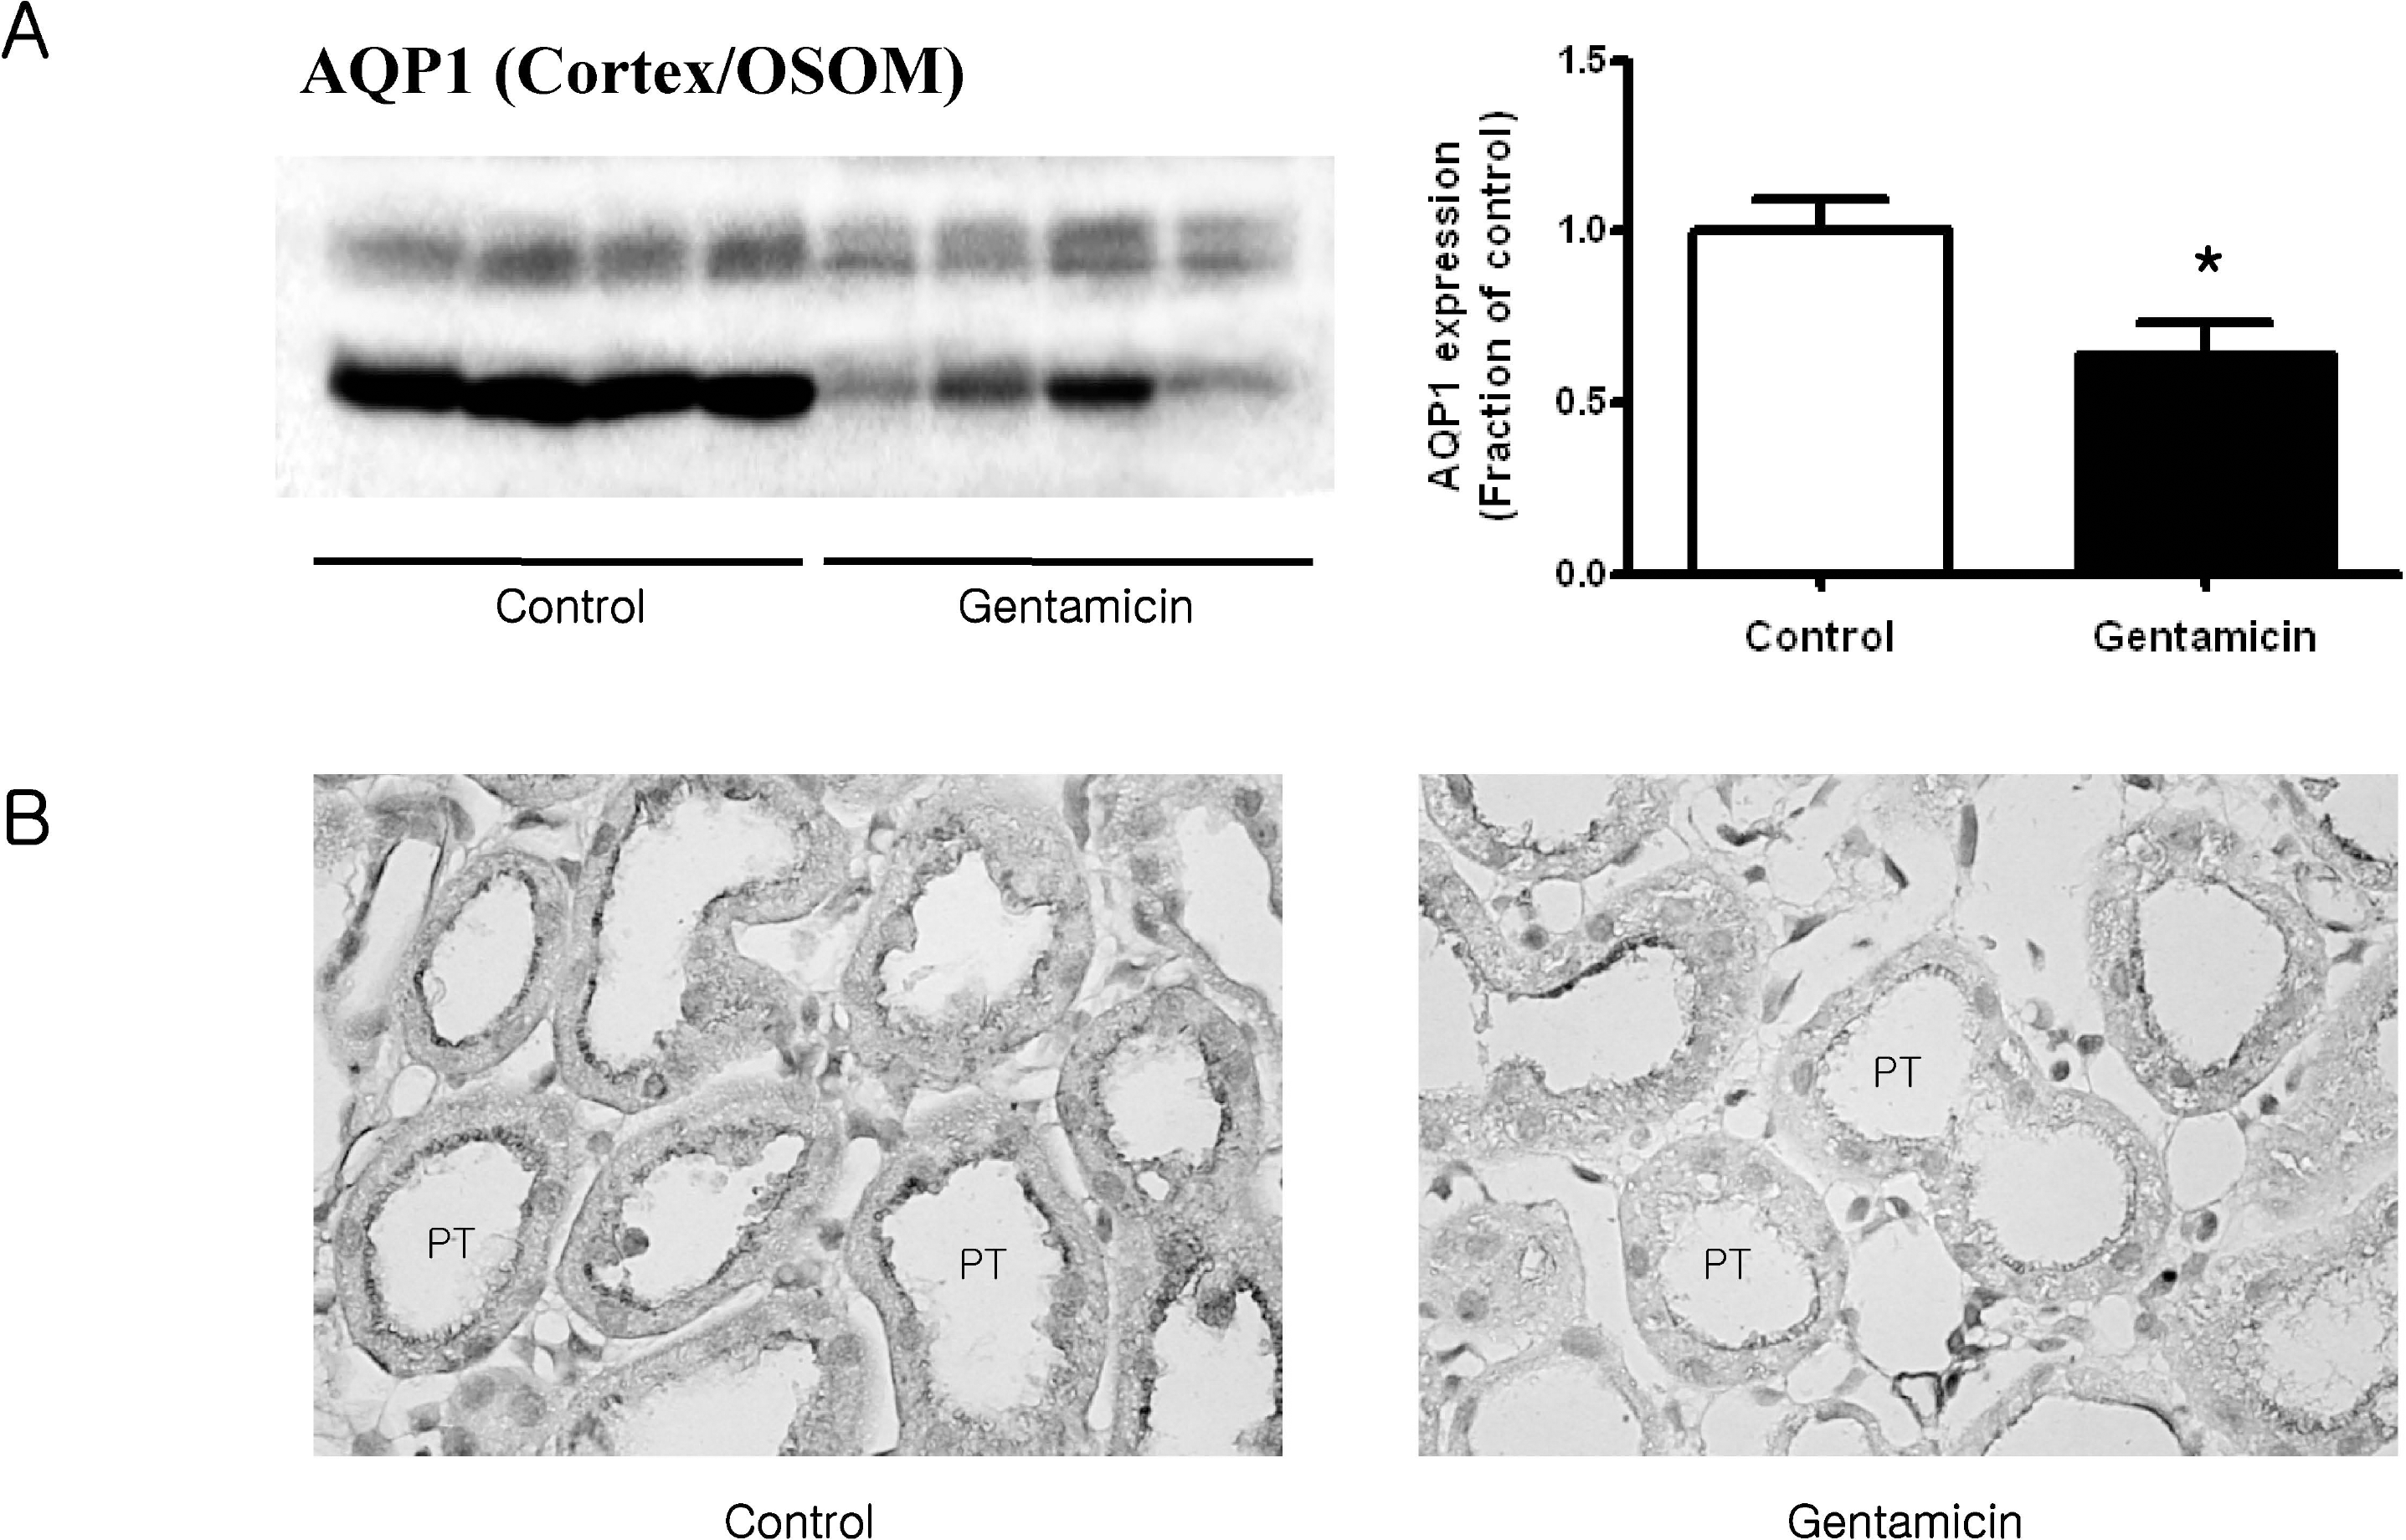 | Fig. 4.Expression of AQP1 in cortex/OSOM. (A) The protein expression of AQP1 was significantly decreased in gentamicin-treated rats. Each column represents mean±SEM of 4 rats (∗p <0.05, compared with control). (B) Immunostaining of AQP1 showed decreased expression in gentamicintreated rats. Magnification ×400. |
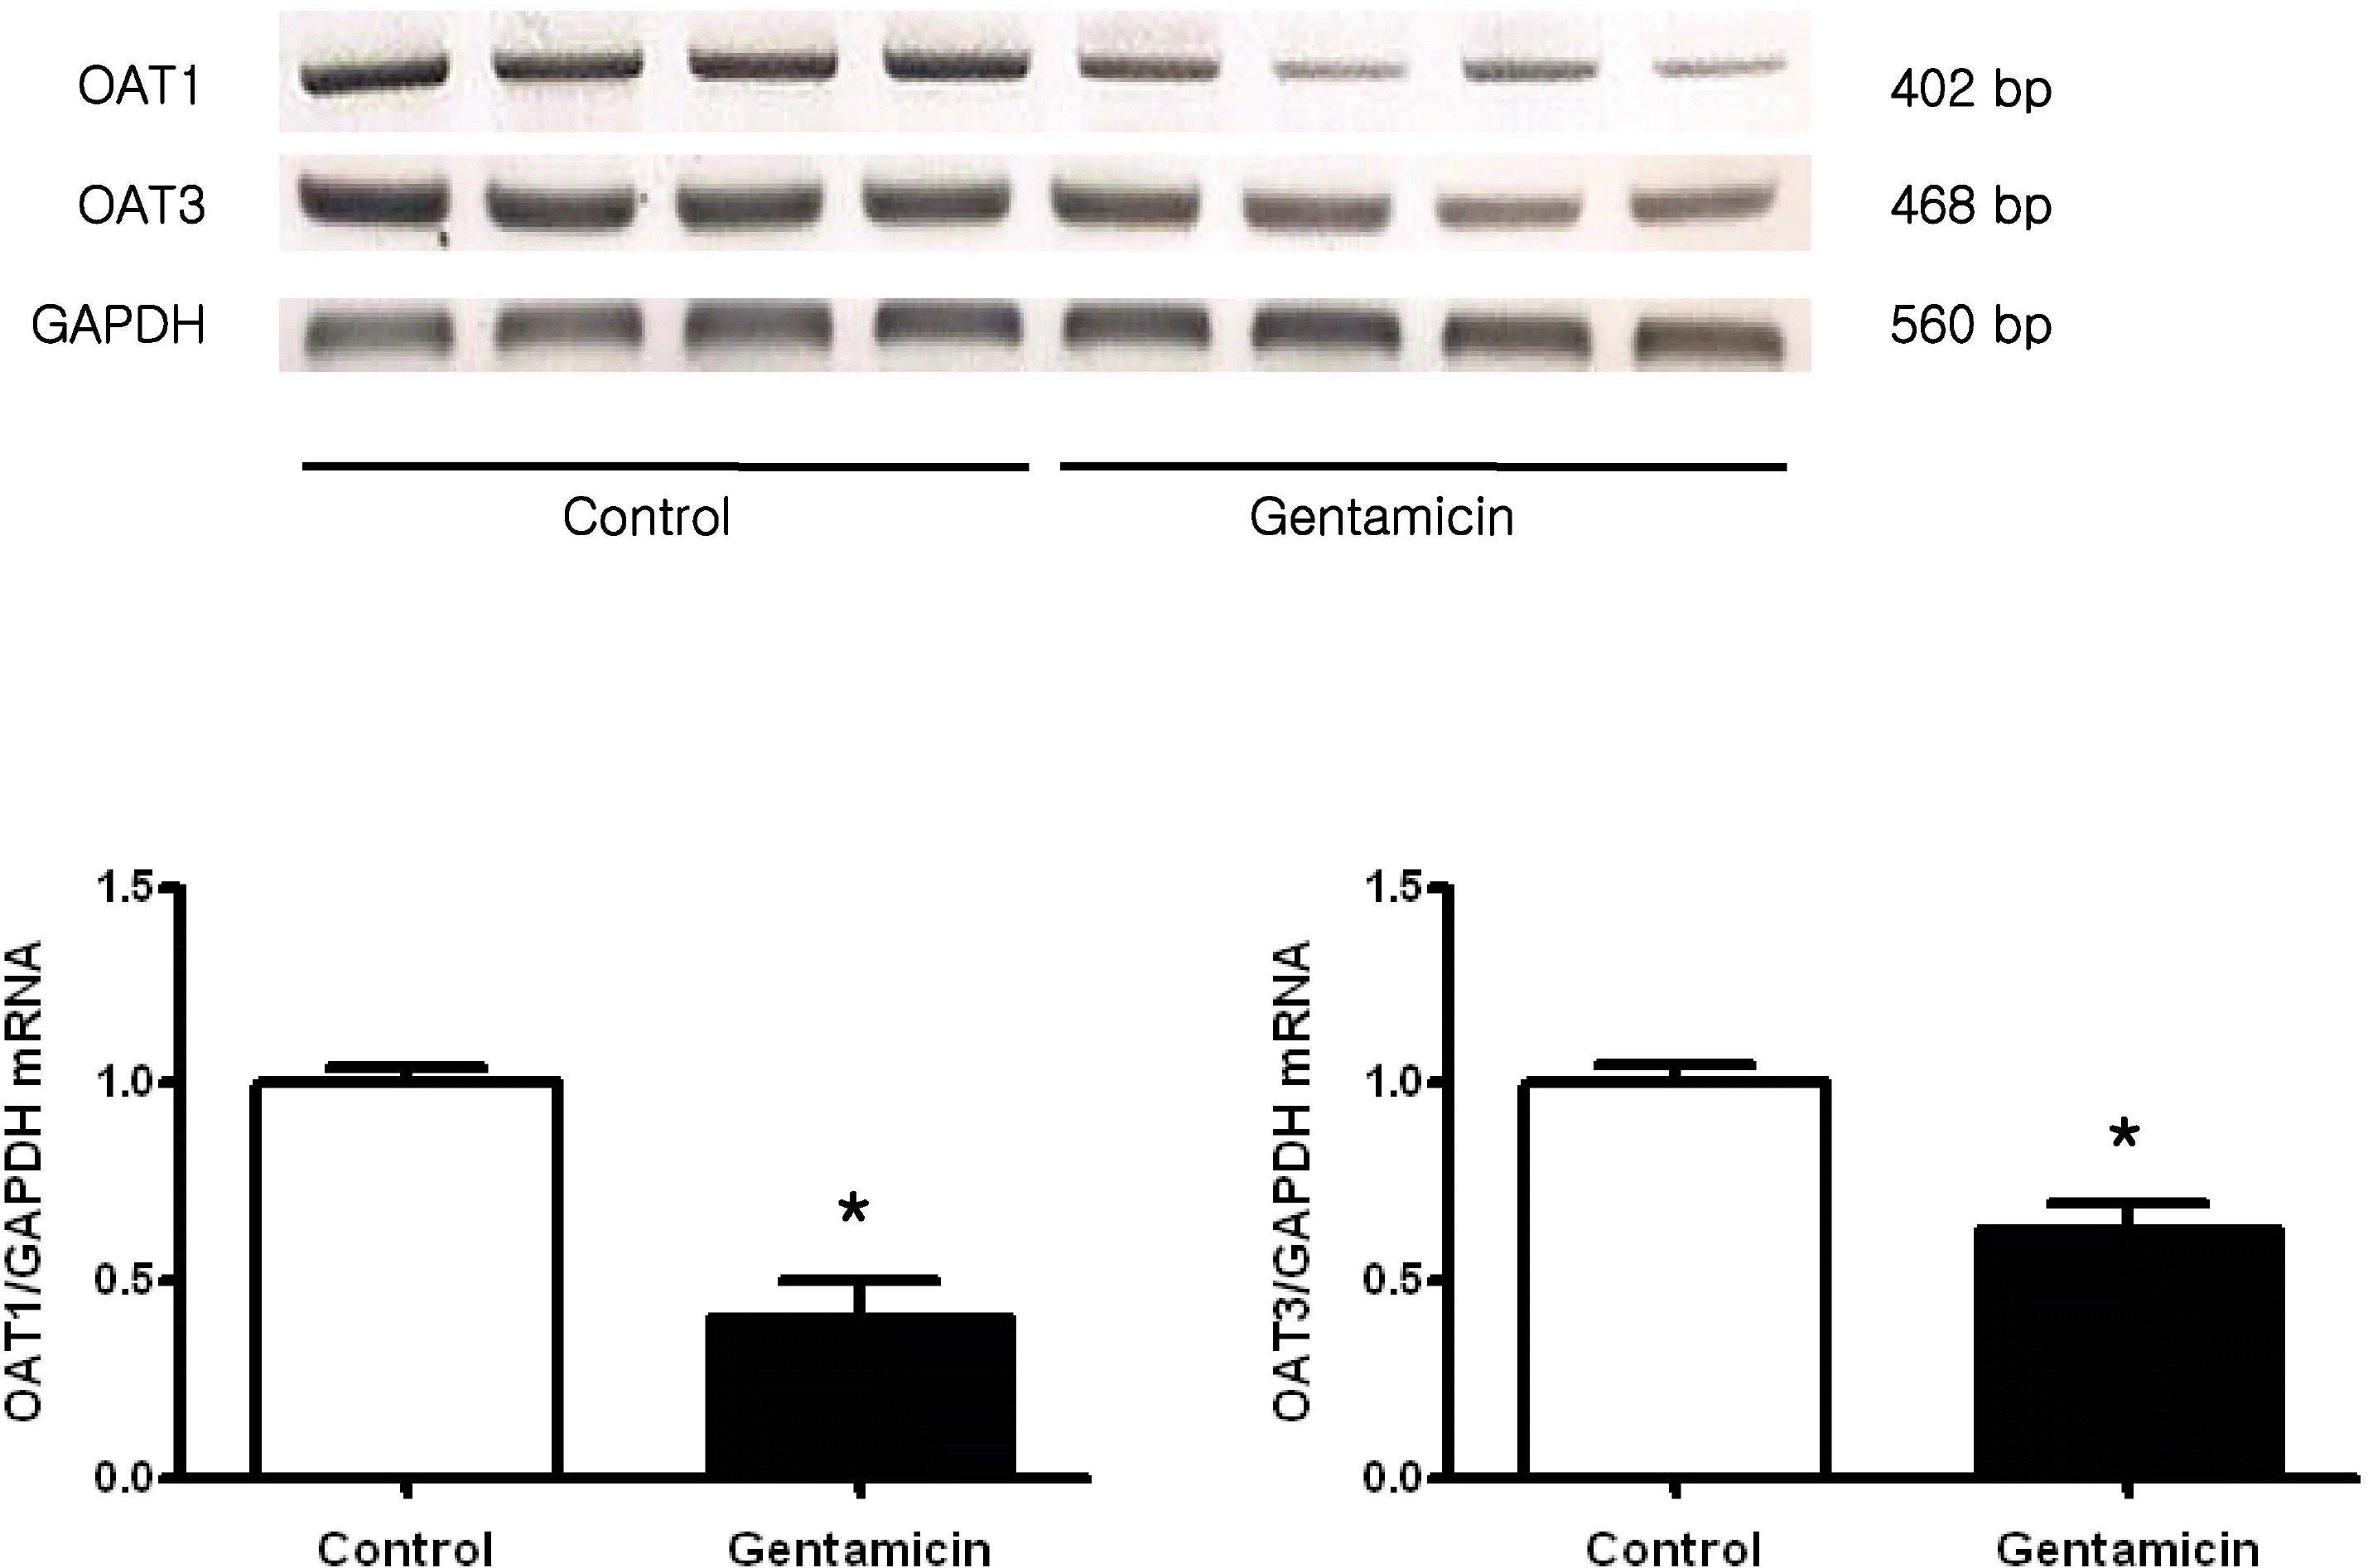 | Fig. 5.Expression of OAT1 and OAT3 mRNA in whole kidney. Each column represents mean±SEM of 4 rats (∗p <0.05, compared with control). |
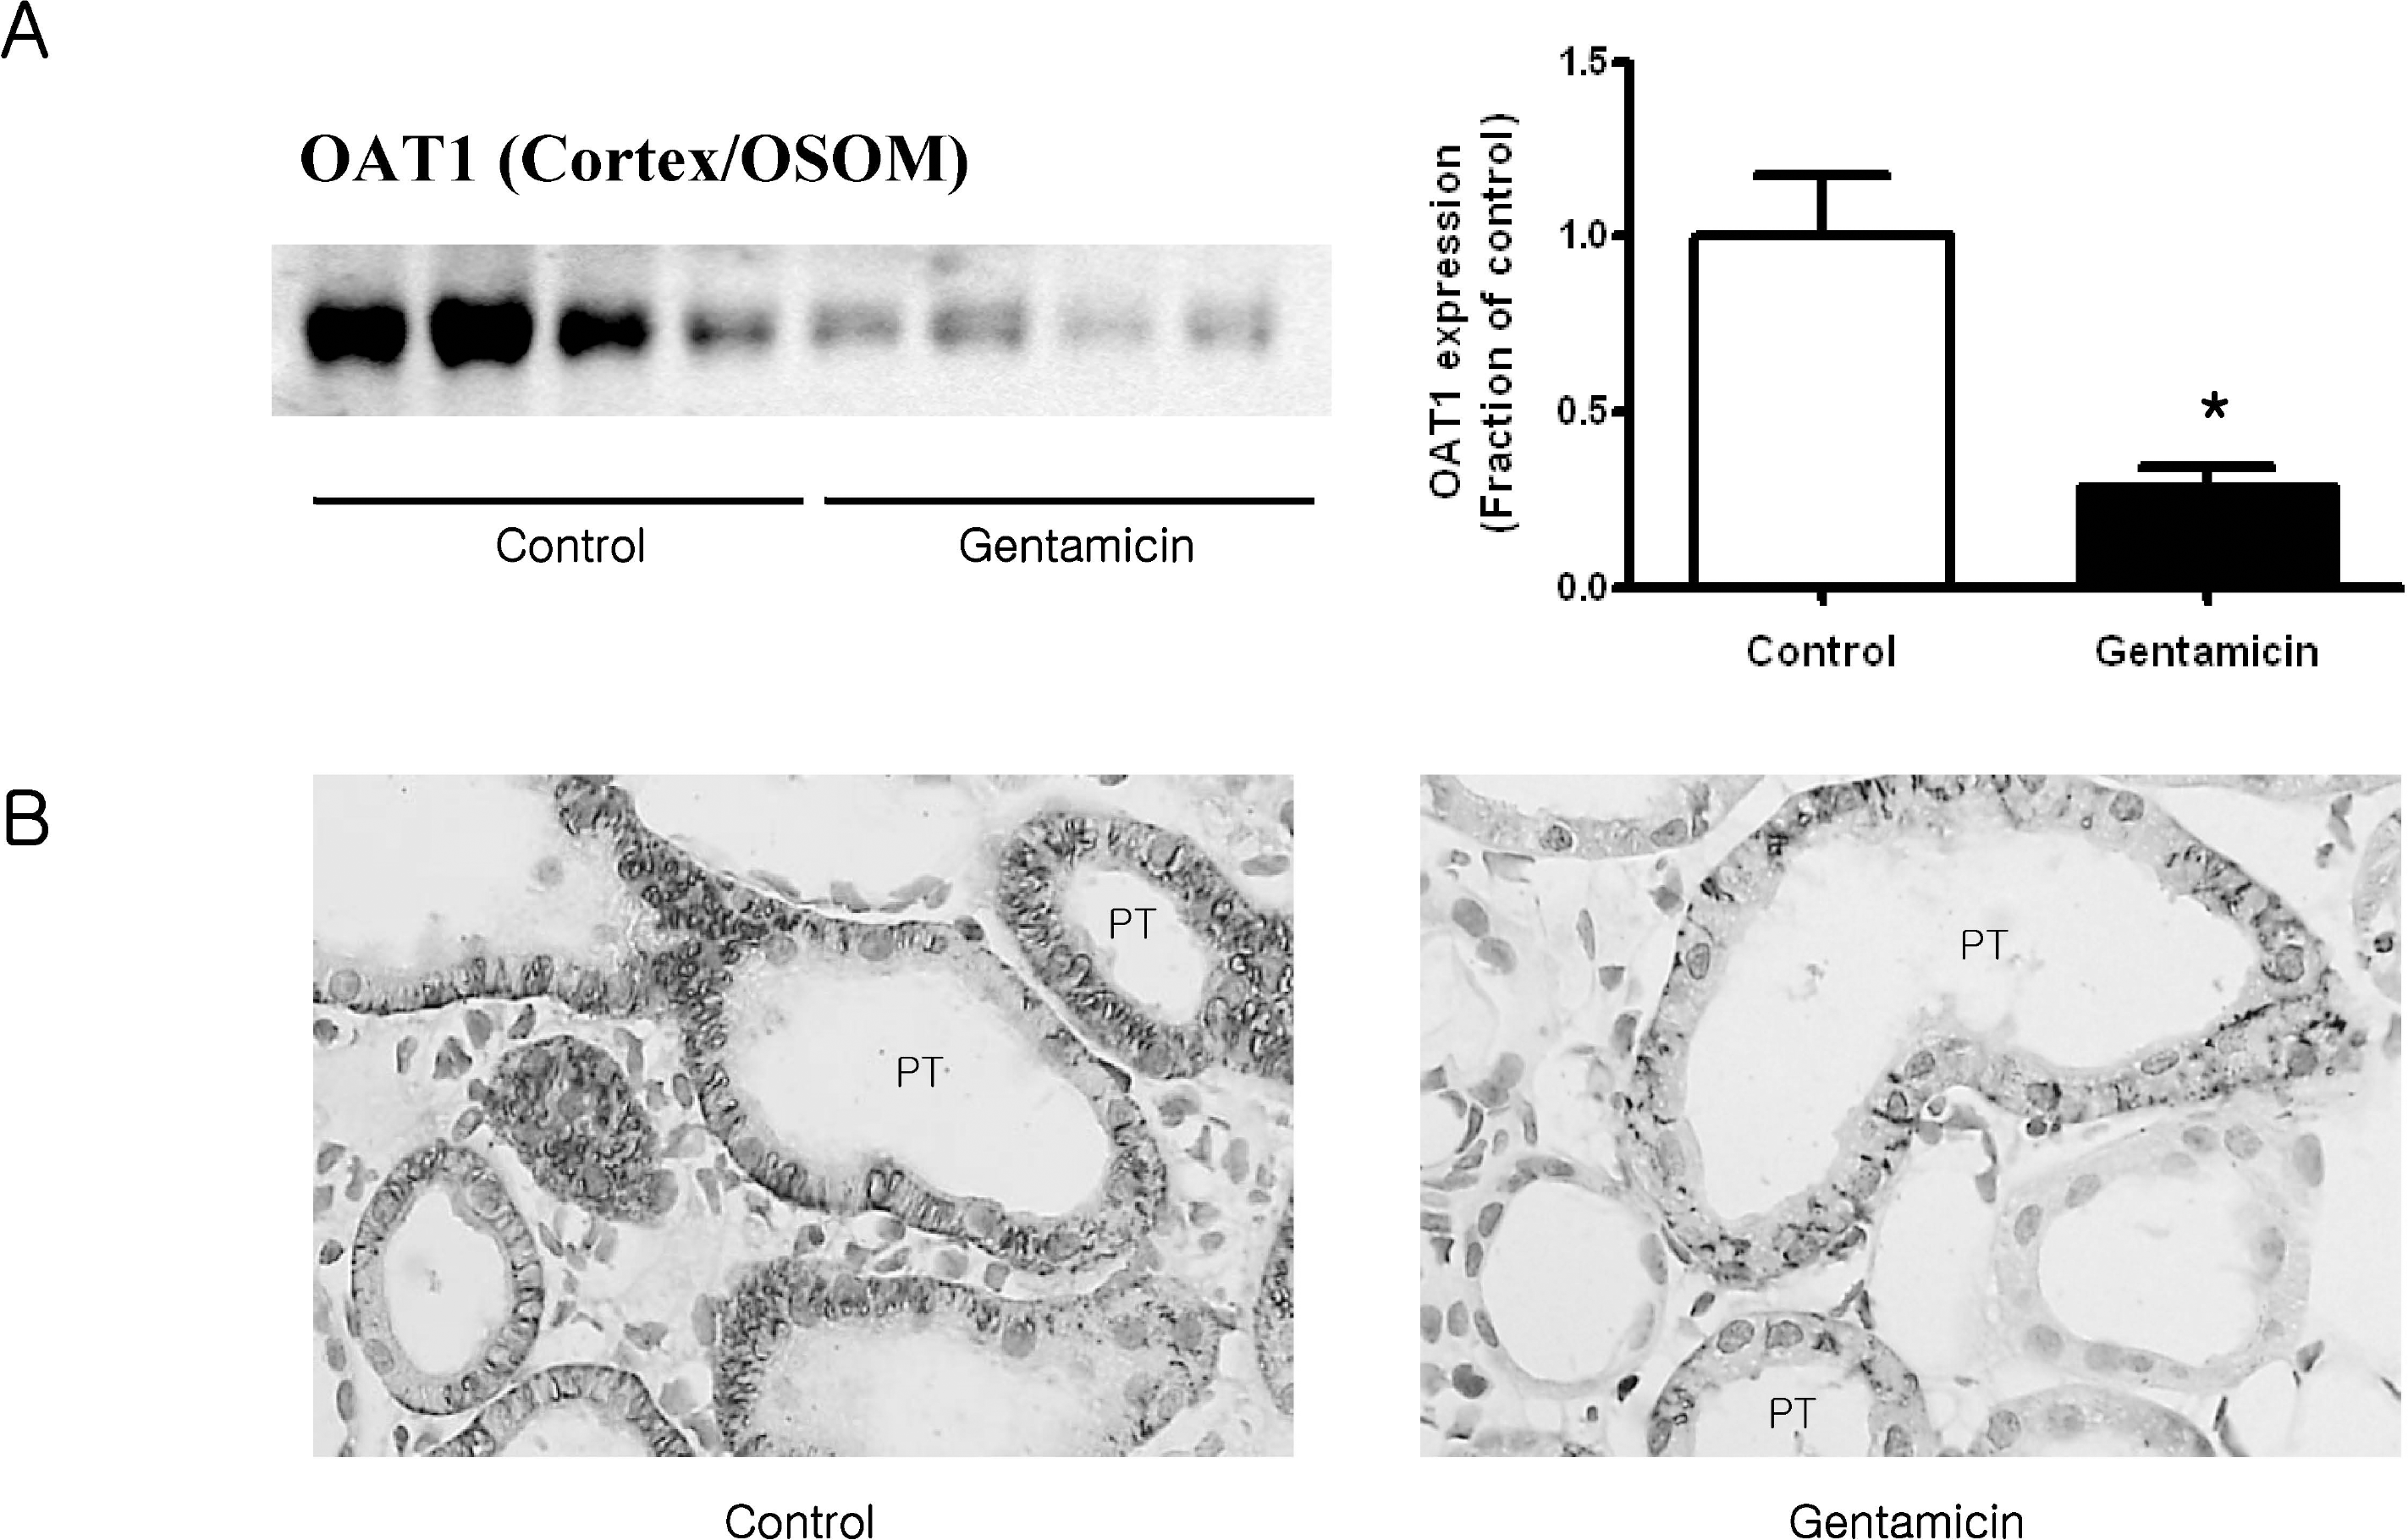 | Fig. 6.Expression of OAT1 in cortex/OSOM. (A) The protein expression of OAT1 was significantly decreased in gentamicin-treated rats. Each column represents mean±SEM of 4 rats (∗p<0.05, compared with control). (B) Immunostaining of OAT1 showed decreased expression in gentamicintreated rats. Magnification ×400. |
Table 1.
Urinary parameters in control and gentamicin-treated rats
| Control (n=4) | Gentamicin (n=4) | |
|---|---|---|
| Body weight (g) | 245±5 | 235±5 |
| UO (mL/day) | 9.9±0.9 | 24.9±1.4∗ |
| Pcr (mg/dL) | 0.55±0.03 | 1.08±0.19 |
| Ccr (mL/min) | 0.91±0.09 | 0.47±0.07∗ |
| PNa (mEq/L) | 140.2±0.3 | 140.3±1.5 |
| UNa×UO (mEq/day) | 2.58±0.23 | 2.39±0.28 |
| FENa (%) | 1.4±0.1 | 2.7±0.5∗ |
| Uosm (mosm/kgH2O) | 1613±43 | 712±77∗ |
| Posm (mosm/kgH2O) | 299±2 | 308±3∗ |
| U/P osm | 5.4±0.2 | 2.3±0.3∗ |
| TcH2O(μl/min/kg) | 123±15 | 94±16 |
Values are expressed as mean±SEM. The values were measured onthe last day of experiment. UO, urine output; Pcr, plasma creatinine; Ccr, creatinine clearance; PNa, plasma sodium; UNa×UO, urinary sodium excretion; FENa, fractional excretion of sodium; Uosm, urine osmolality; Psom, plasma osmolality; U/P osm, urine to plasma osmolality ratio; TcH2O, solute-free water absorption.
 XML Download