Abstract
Retinal prostheses are being developed to restore vision for the blind with retinal diseases such as retinitis pigmentosa (RP) or age-related macular degeneration (AMD). Among the many issues for prosthesis development, stimulation encoding strategy is one of the most essential electrophysiological issues. The more we understand the retinal circuitry how it encodes and processes visual information, the greater it could help decide stimulation encoding strategy for retinal prosthesis. Therefore, we examined how retinal ganglion cells (RGCs) in in-vitro retinal preparation act together to encode a visual scene with multielectrode array (MEA). Simultaneous recording of many RGCs with MEA showed that nearby neurons often fired synchronously, with spike delays mostly within 1 ms range. This synchronized firing – narrow correlation – was blocked by gap junction blocker, heptanol, but not by glutamatergic synapse blocker, kynurenic acid. By tracking down all the RGC pairs which showed narrow correlation, we could harvest 40 functional connectivity maps of RGCs which showed the cell cluster firing together. We suggest that finding functional connectivity map would be useful in stimulation encoding strategy for the retinal prosthesis since stimulating the cluster of RGCs would be more efficient than separately stimulating each individual RGC.
REFERENCES
Amthor FR., Takahashi ES., Oyster CW. Morphologies of rabbit retinal ganglion cells with concentric receptive fields. J Comp Neurol. 280:72–96. 1989a.

Amthor FR., Takahashi ES., Oyster CW. Morphologies of rabbit retinal ganglion cells with complex receptive fields. J Comp Neurol. 280:97–121. 1989b.

Arnett D., Spraker TE. Cross-correlation analysis of the maintained discharge of rabbit retinal ganglion cells. J Physiol (London). 317:29–47. 1981.

Brivanlou IH., Warland DK., Meister M. Mechanisms of concerted firing among retinal ganglion cells. Neuron. 20:527–539. 1998.

Brown SP., He S., Masland RH. Receptive field microstructure and dendritic geometry of retinal ganglion cells. Neuron. 27:371–383. 2000.

Caldwell JH., Daw NW. New properties of rabbit retinal ganglion cells. J Physiol (Lond.). 276:257–276. 1978.

DeVries SH., Baylor DA. Mosaic arrangement of ganglion cell receptive fields in rabbit retina. J Neurophysiol. 78:2048–2060. 1997.

Egert U., Schlosshauer B., Fennrich S., Nisch W., Fejtl M., Knott T., Muller T., Hammerle H. A novel organotypic long-term culture of the rat hippocampus on substrate-integrated multielectrode arrays. Brain Res Protoc. 2:229–242. 1998.

Guenther E., Herrmann T., Stett A. The retina sensor: An in vitro tool to study drug effects on retinal signaling. Taketani M, Baudry M, editors. ed,. Advances in Network Electrophysiology Using Multi-electrode Arrays. 1st ed.Springer;New York: p. p. 321–331. 2006.
Humayun MS., Weiland JD., Fujii GY., Greenberg R., Williamson R., Little J., Mech G., Cimmarusti V., Boemel GV., Dagnelie G., de Juan Jr E. Visual perception in a blind subject with a chronic microelectronic retinal prosthesis. Vis Res. 43:2573–2581. 2003.

Lowenstein JI., Montezuma SR., Rizzo III JF. Outer retinal degeneration: an electronic retinal prosthesis as a treatment strategy. Archives of Ophthalmology. 122:588–596. 2004.
Margolis DJ., Detwilder PB. Different mechanisms generate maintained activity in ON and OFF retinal ganglion cells. J Neurosci. 27:5994–6005. 2007.

Mastronarde DN. Interactions between ganglion cells in cat retina. J Neurophysiol. 49:350–365. 1983.

Meister M., Pine J., Baylor DA. Multi-neuronal signals from the retina: acquisition and analysis. J Neurosci Methods. 51:95–106. 1994.

Meister M., Lagnado L., Baylor DA. Concerted signaling by retinal ganglion cells. Science. 270:1207–1210. 1995.

Nakatani K., Tamura T., Yau KW. Light adaptation in retinal rods of the rabbit and two other nonprimate mammals. J Gen Physiol. 97:413–435. 1991.

Rizzo JF III., Wyatt J., Lowenstein J., Kelly S., Shire D. Perceptual efficacy of electrical stimulation of human retina with a microelectrode array during short-term surgical trials. Invest Ophthalmol Vis Sci. 44:5362–5369. 2003.
Seo J., Zhou J., Kim E., Koo K., Ye JH., Kim SJ., Chung H., Cho DD., Goo YS., Yu YS. A retinal implant system based on flexible polymer microelectrode array for electrical stimulation. Tombran-Tink J, Barnstable C, Rizzo JF, editors. ed,. Visual Prosthesis and Ophthalmic Devices: New Hope in Sight. 1st ed.Humana Press Inc;New Jersey: p. p. 107–119. 2007.

Stett A., Barth W., Weiss S., Haemmerle H., Zrenner E. Electrical multisite stimulation of isolated chicken retina. Vis Res. 40:1785–1795. 2000.
Zrenner E., Besch D., Bartz-Schmidt KU., Gekeler F., Gabriel VP., Kuttenkeuler C., Sachs H., Saier H., Wilhelm B., Wilke R. Subretinal chronic multi-electrode arrays implanted in blind patients. Invest Ophthalmol Vis Sci. 47:E Abstract 1538. 2006.
Fig. 2.
Spike-triggered averaging of the random checkerboard stimulus. Each stack of stimulus frames represents 300 ms, 200 ms, 100 ms, and 0 ms preceding an action potential. These sequences were then aligned and ensemble averaged.
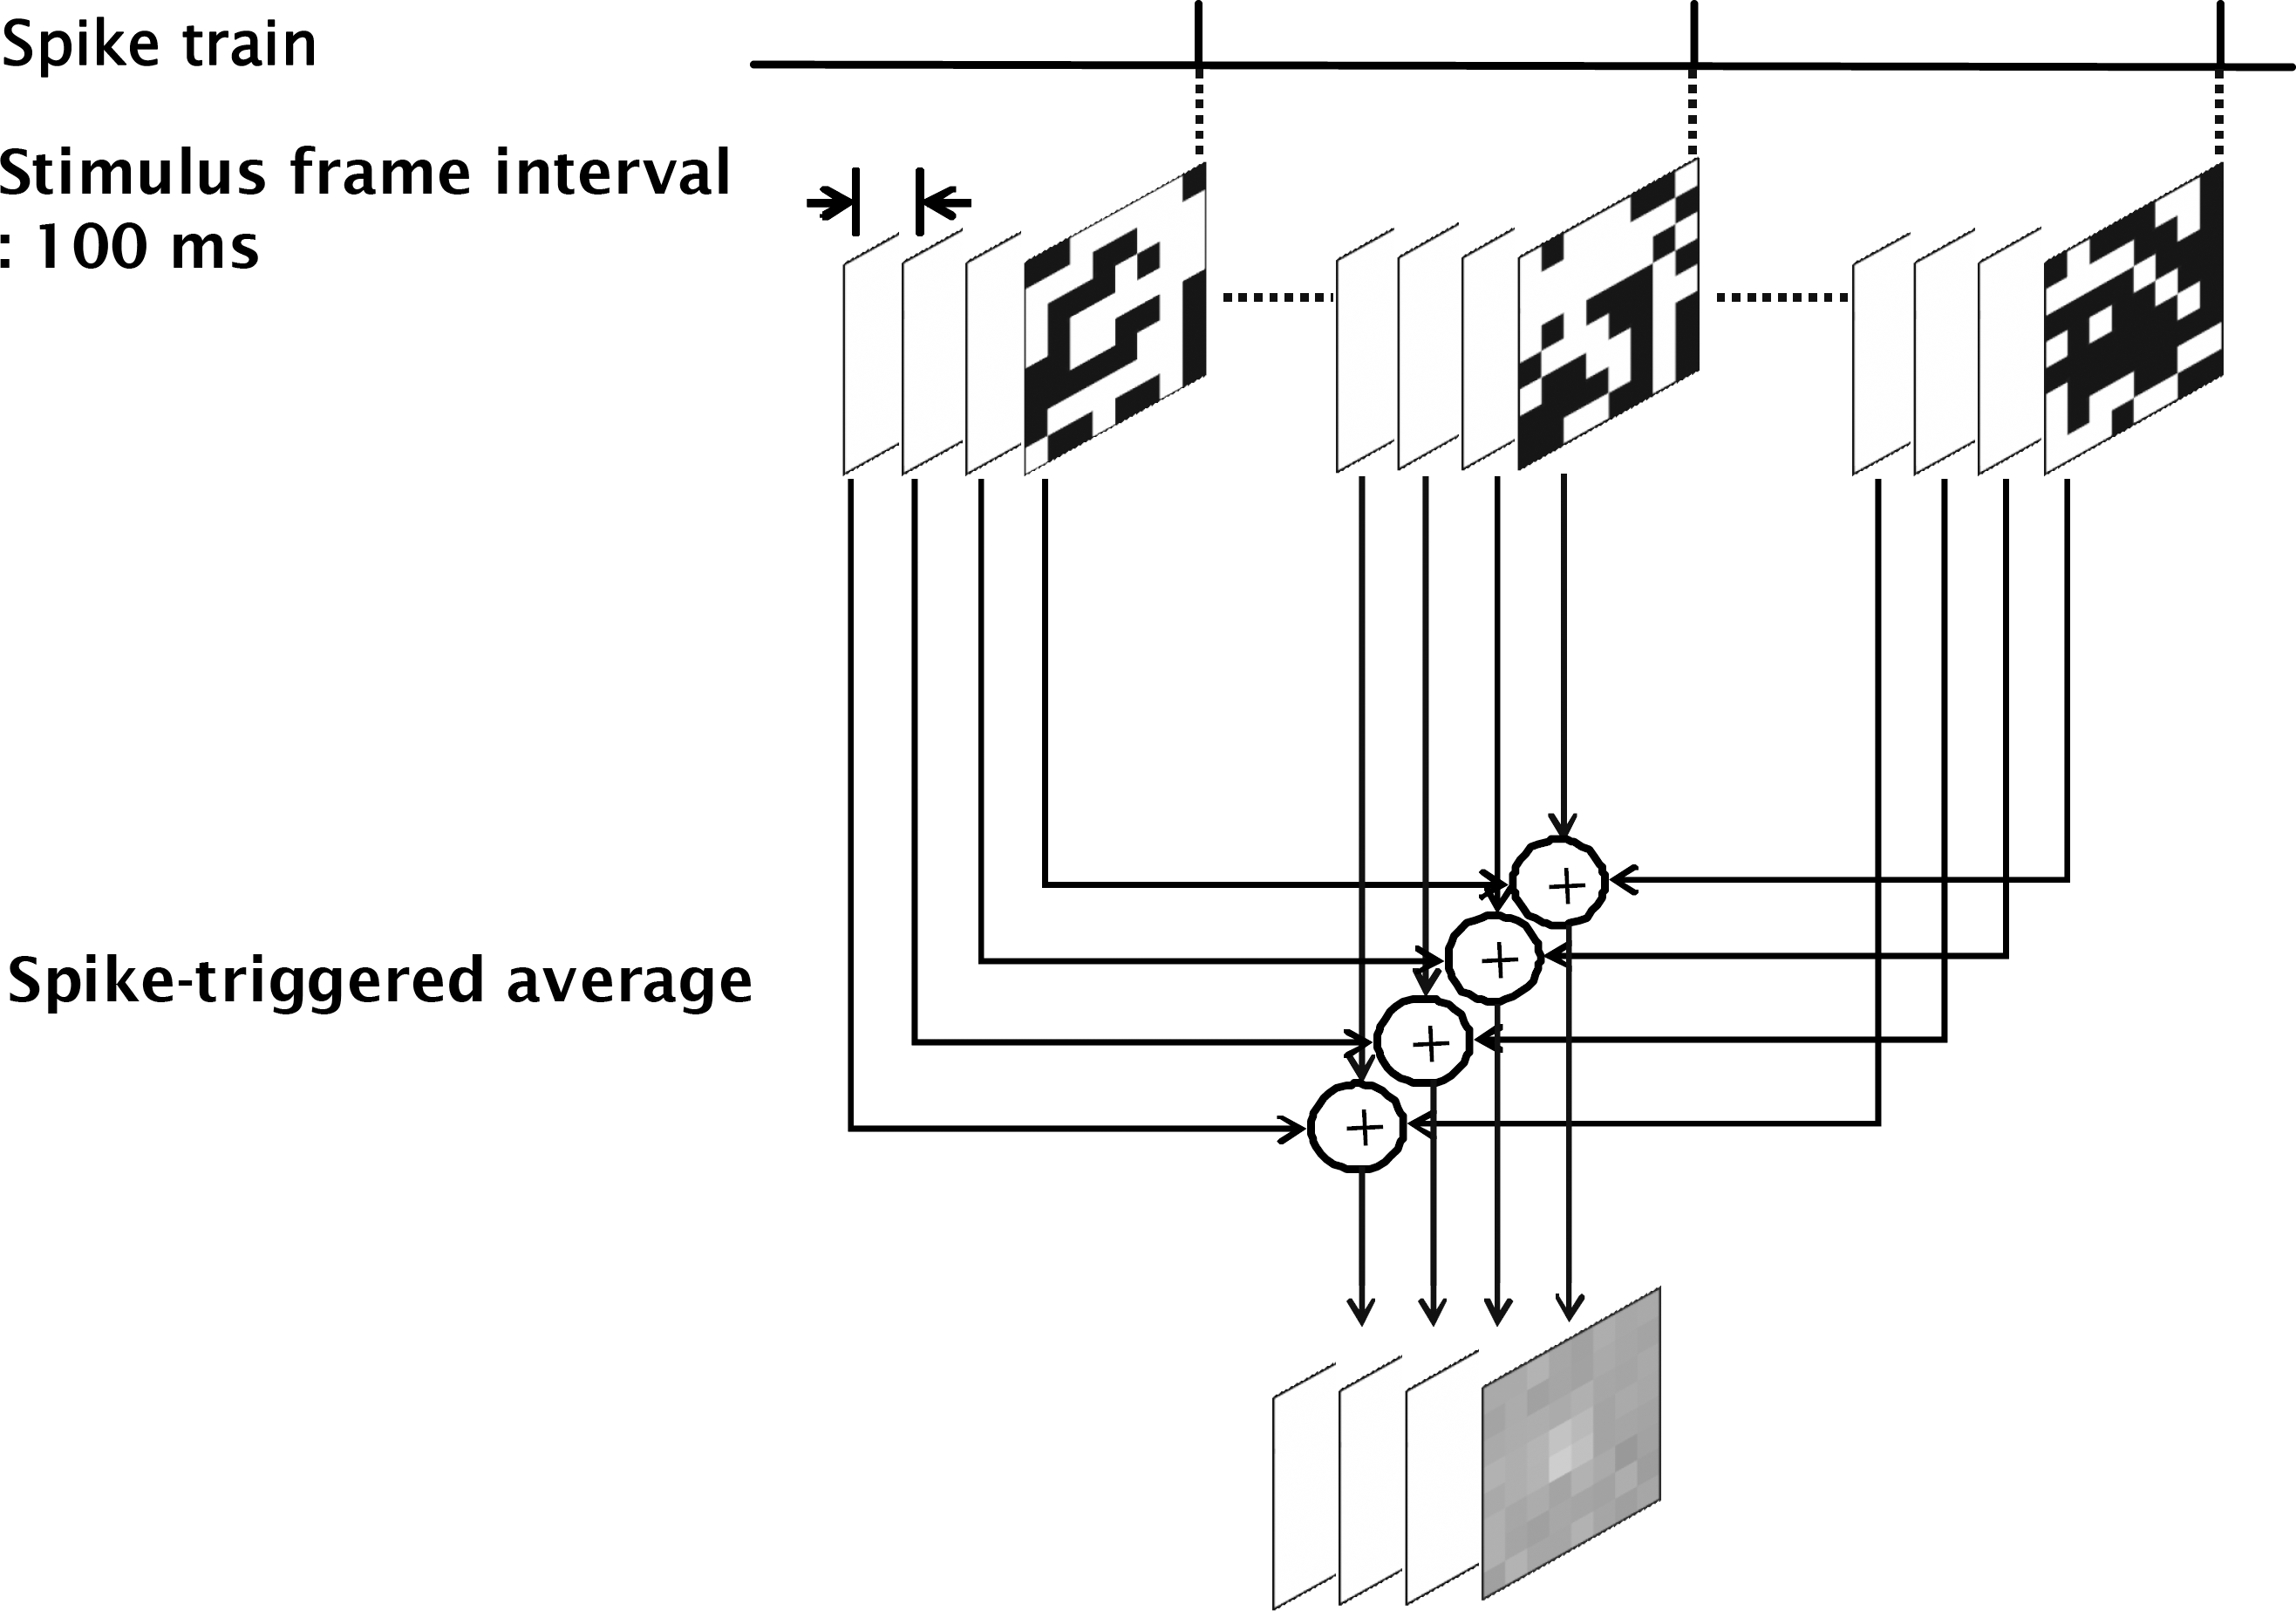
Fig. 3.
Synchronous firing between nearby ganglion cells (46a, 63a). (A) Synchronized firing between two cells both in dark and full-field illumination are shown in raster plot. Sync raster was plotted when 63a cell fire spike within −5~+5 ms from the 46a cell. With PSTH, 46a and 63a cells were identified as OFF cells. (B) Cross-correlation analysis between two RGC spike trains. Cross-correlogram of 46a and 63a showed narrow central peak both in dark and full-field illumination with white light (intensity 1.45 μW/cm2), while the inset figure shows the cross-correlogram of the uncorrelated cells (46a and 62a). Dashed line indicates 99% confidence limits (bin: 1 msec).
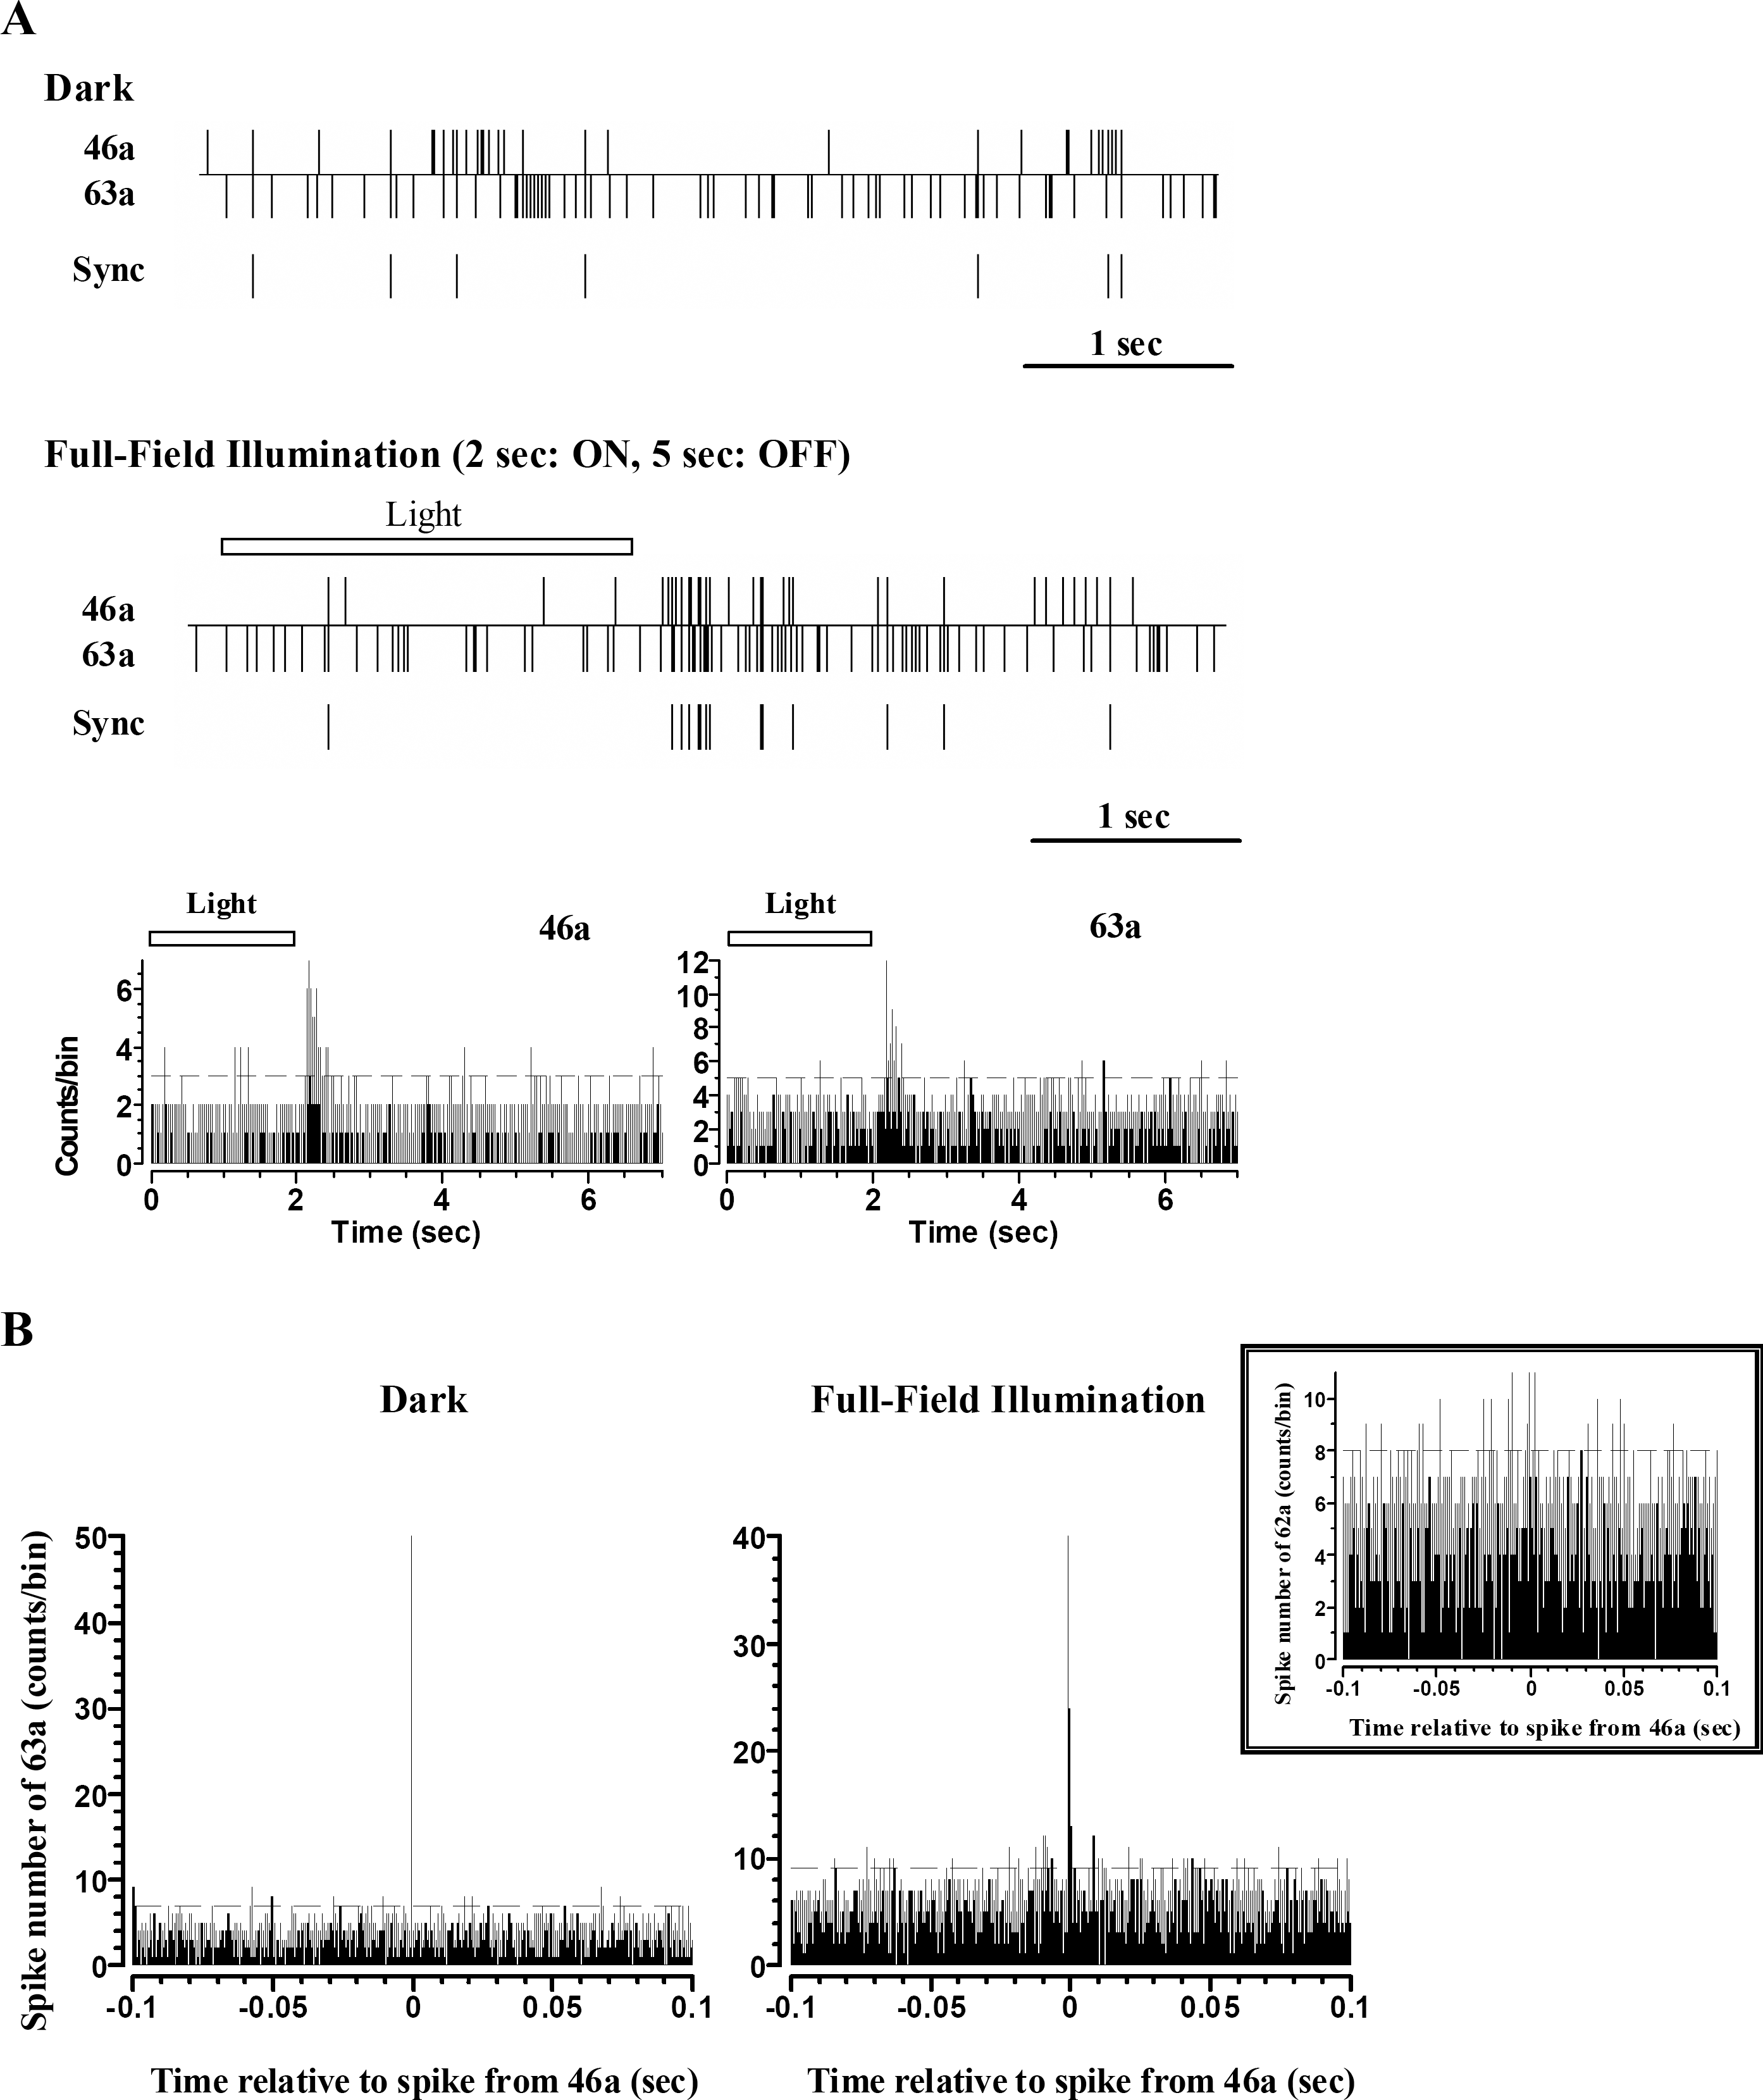
Fig. 4.
Spatio-temporal receptive field of ON cell (A) and OFF cell (B). (A) a. Four frames of the spatio-temporal receptive field of ON cell are shown in succession to illustrate how the receptive field was evolved over time. Each frame shows spike-triggered average (STA) of stimulus, which preceded the action potential by the delay in milliseconds noted below each frame. The recording channel for RGC spike (channel 46) is marked by black cross. The boundary of STA of stimulus for this cell is marked by black line. Receptive field was determined by reverse correlation to flickering random checkerboard stimulation (pixel size: 200 μm, flicker interval: 100 ms, and mean intensity: 0.77 μW/cm2). × and Y axis represent column and row of 8×8 MEA (0~8), respectively. b. This RGC was confirmed as ON cell by PSTH with light stimulus. (B) a. Four frames of the spatio- temporal receptive field of OFF cell are shown. The recording channel for RGC spike (channel 72) is marked by black cross. The boundary of STA of stimulus for this cell is marked by black line. b. This RGC was confirmed as OFF cell by PSTH with light stimulus.
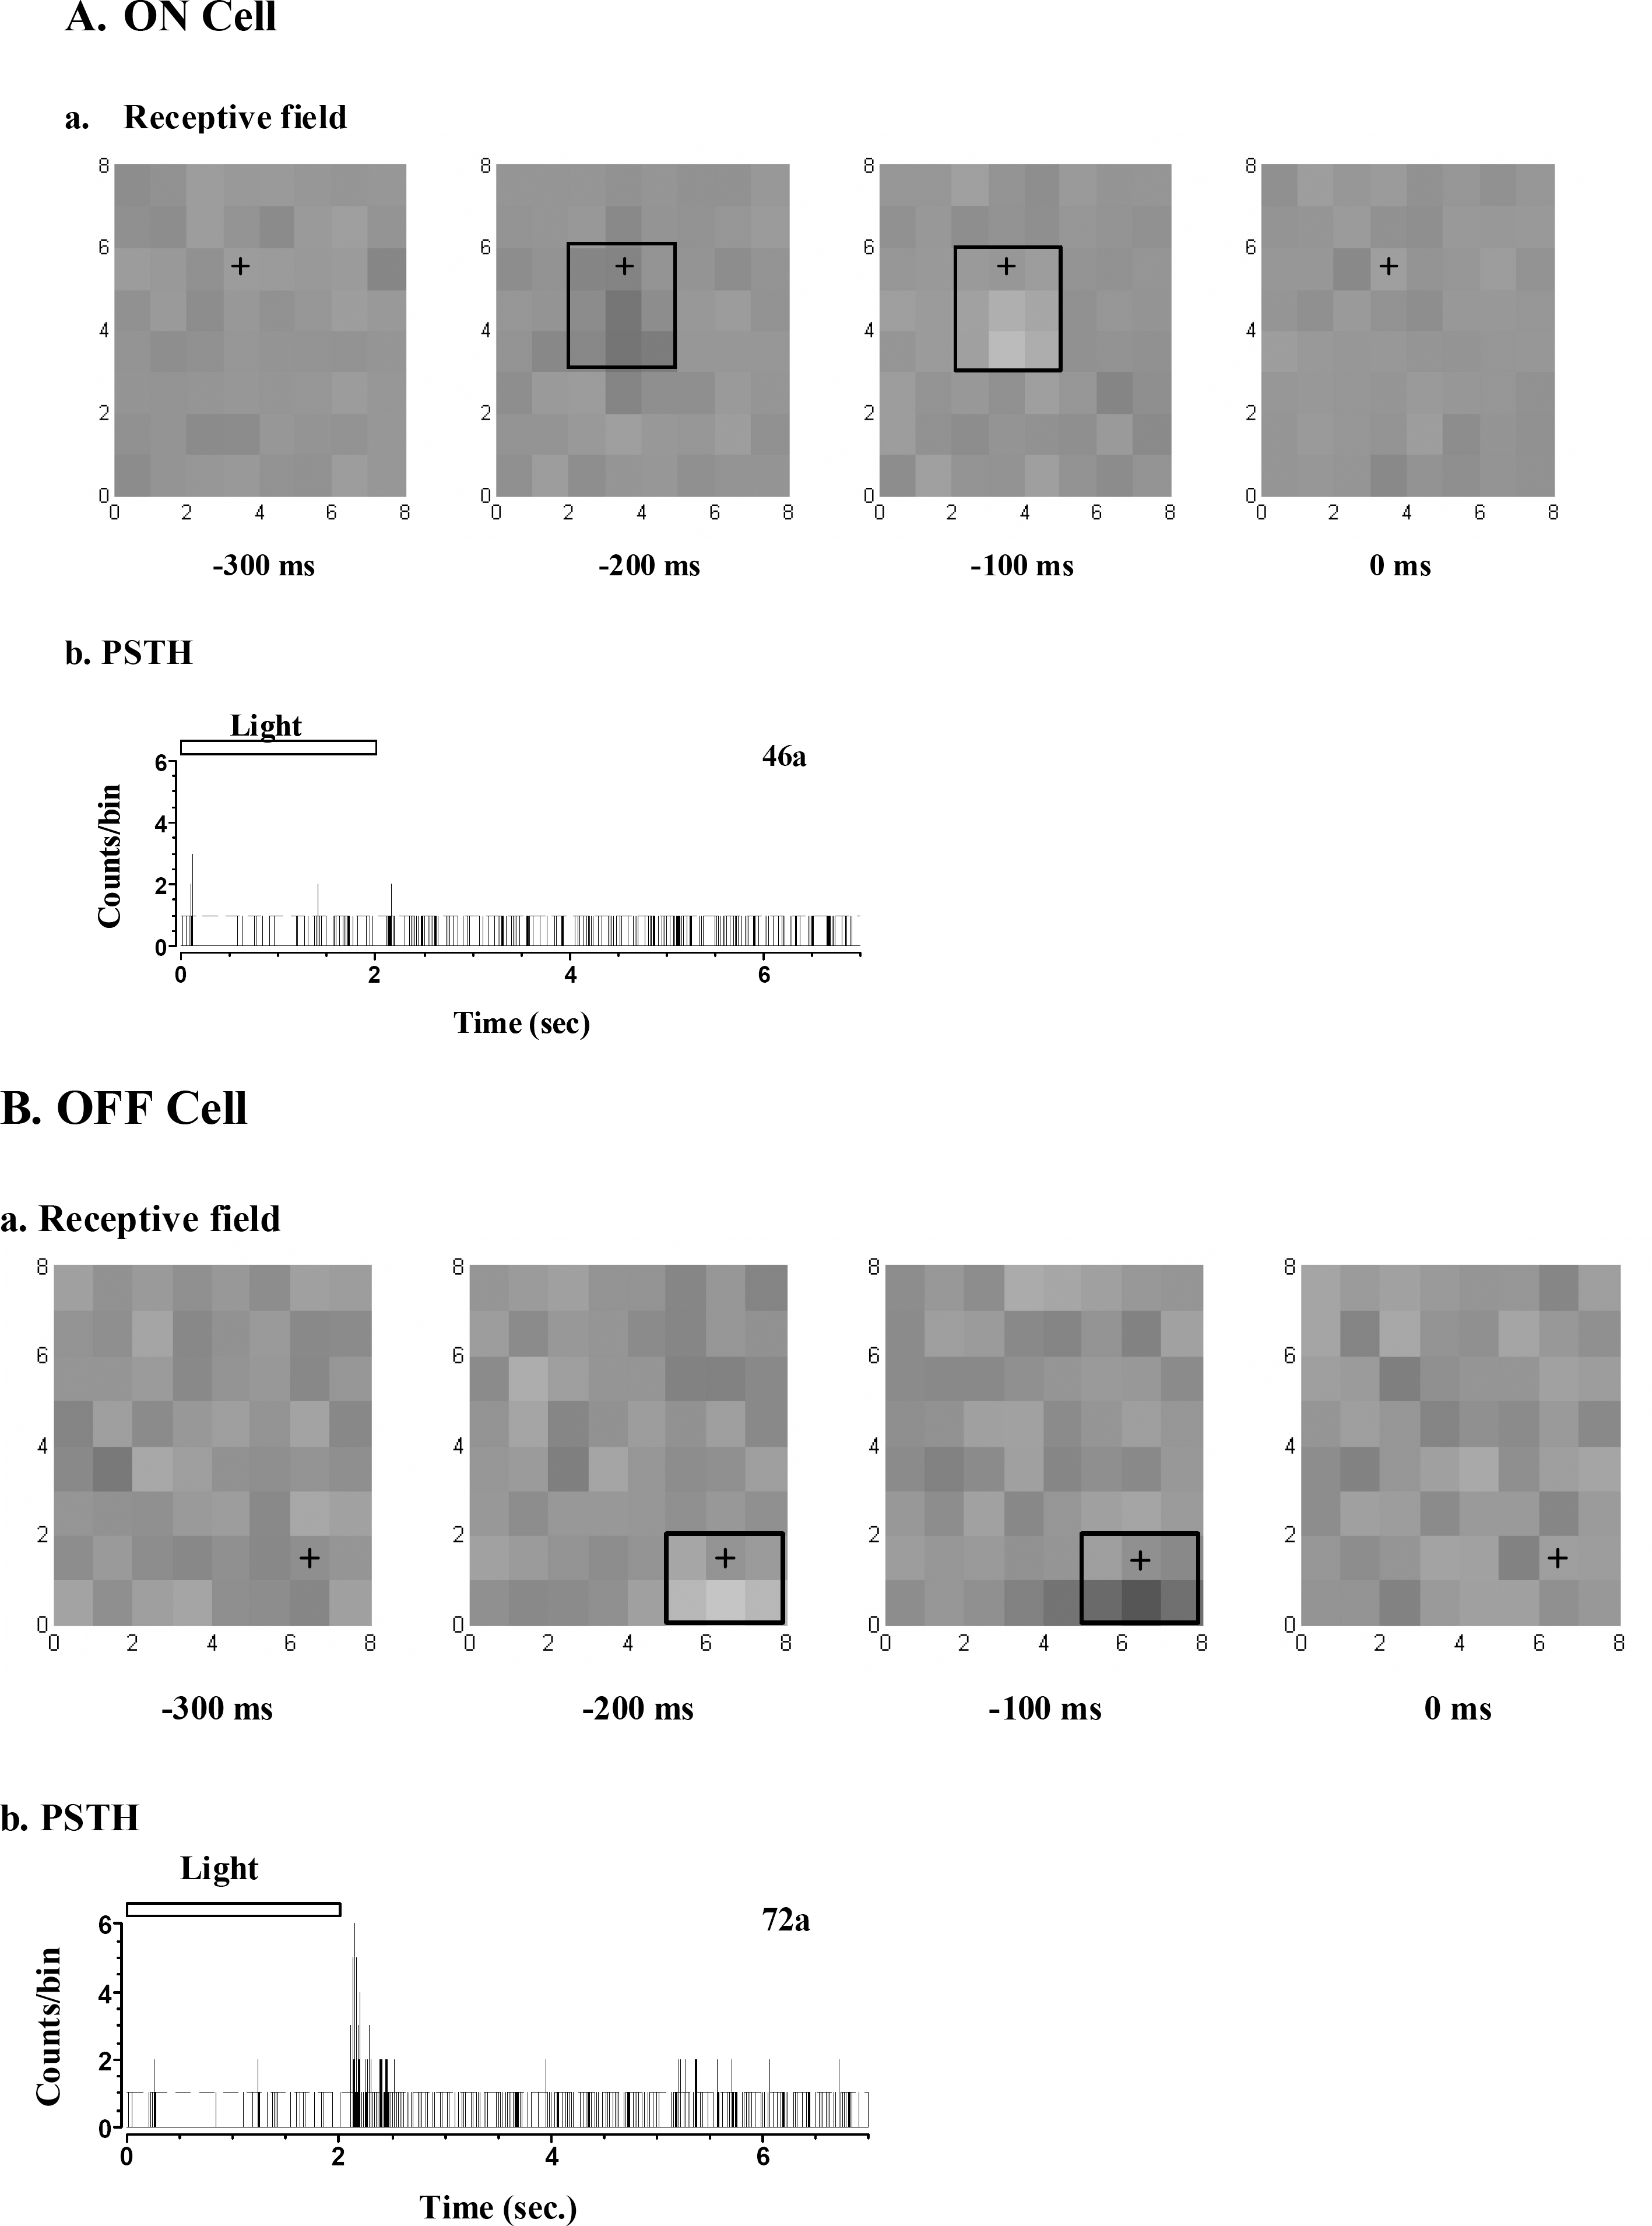
Fig. 5.
Effects of kynurenic acid and heptanol on narrow correlation. (A) Narrow correlation persisted still when glutamate receptor was blocked with kynurenic acid (100 uM). Left: Control, Right: After treatment with kynurenic acid. (B) Narrow correlation was blocked with gap junction channel blocker, heptanol. The ordinate scale in left (Control) and right (Heptanol, 1 mM) is different. Dashed line indicates 99% confidence limits both in A and B (bin: 0.8 msec).
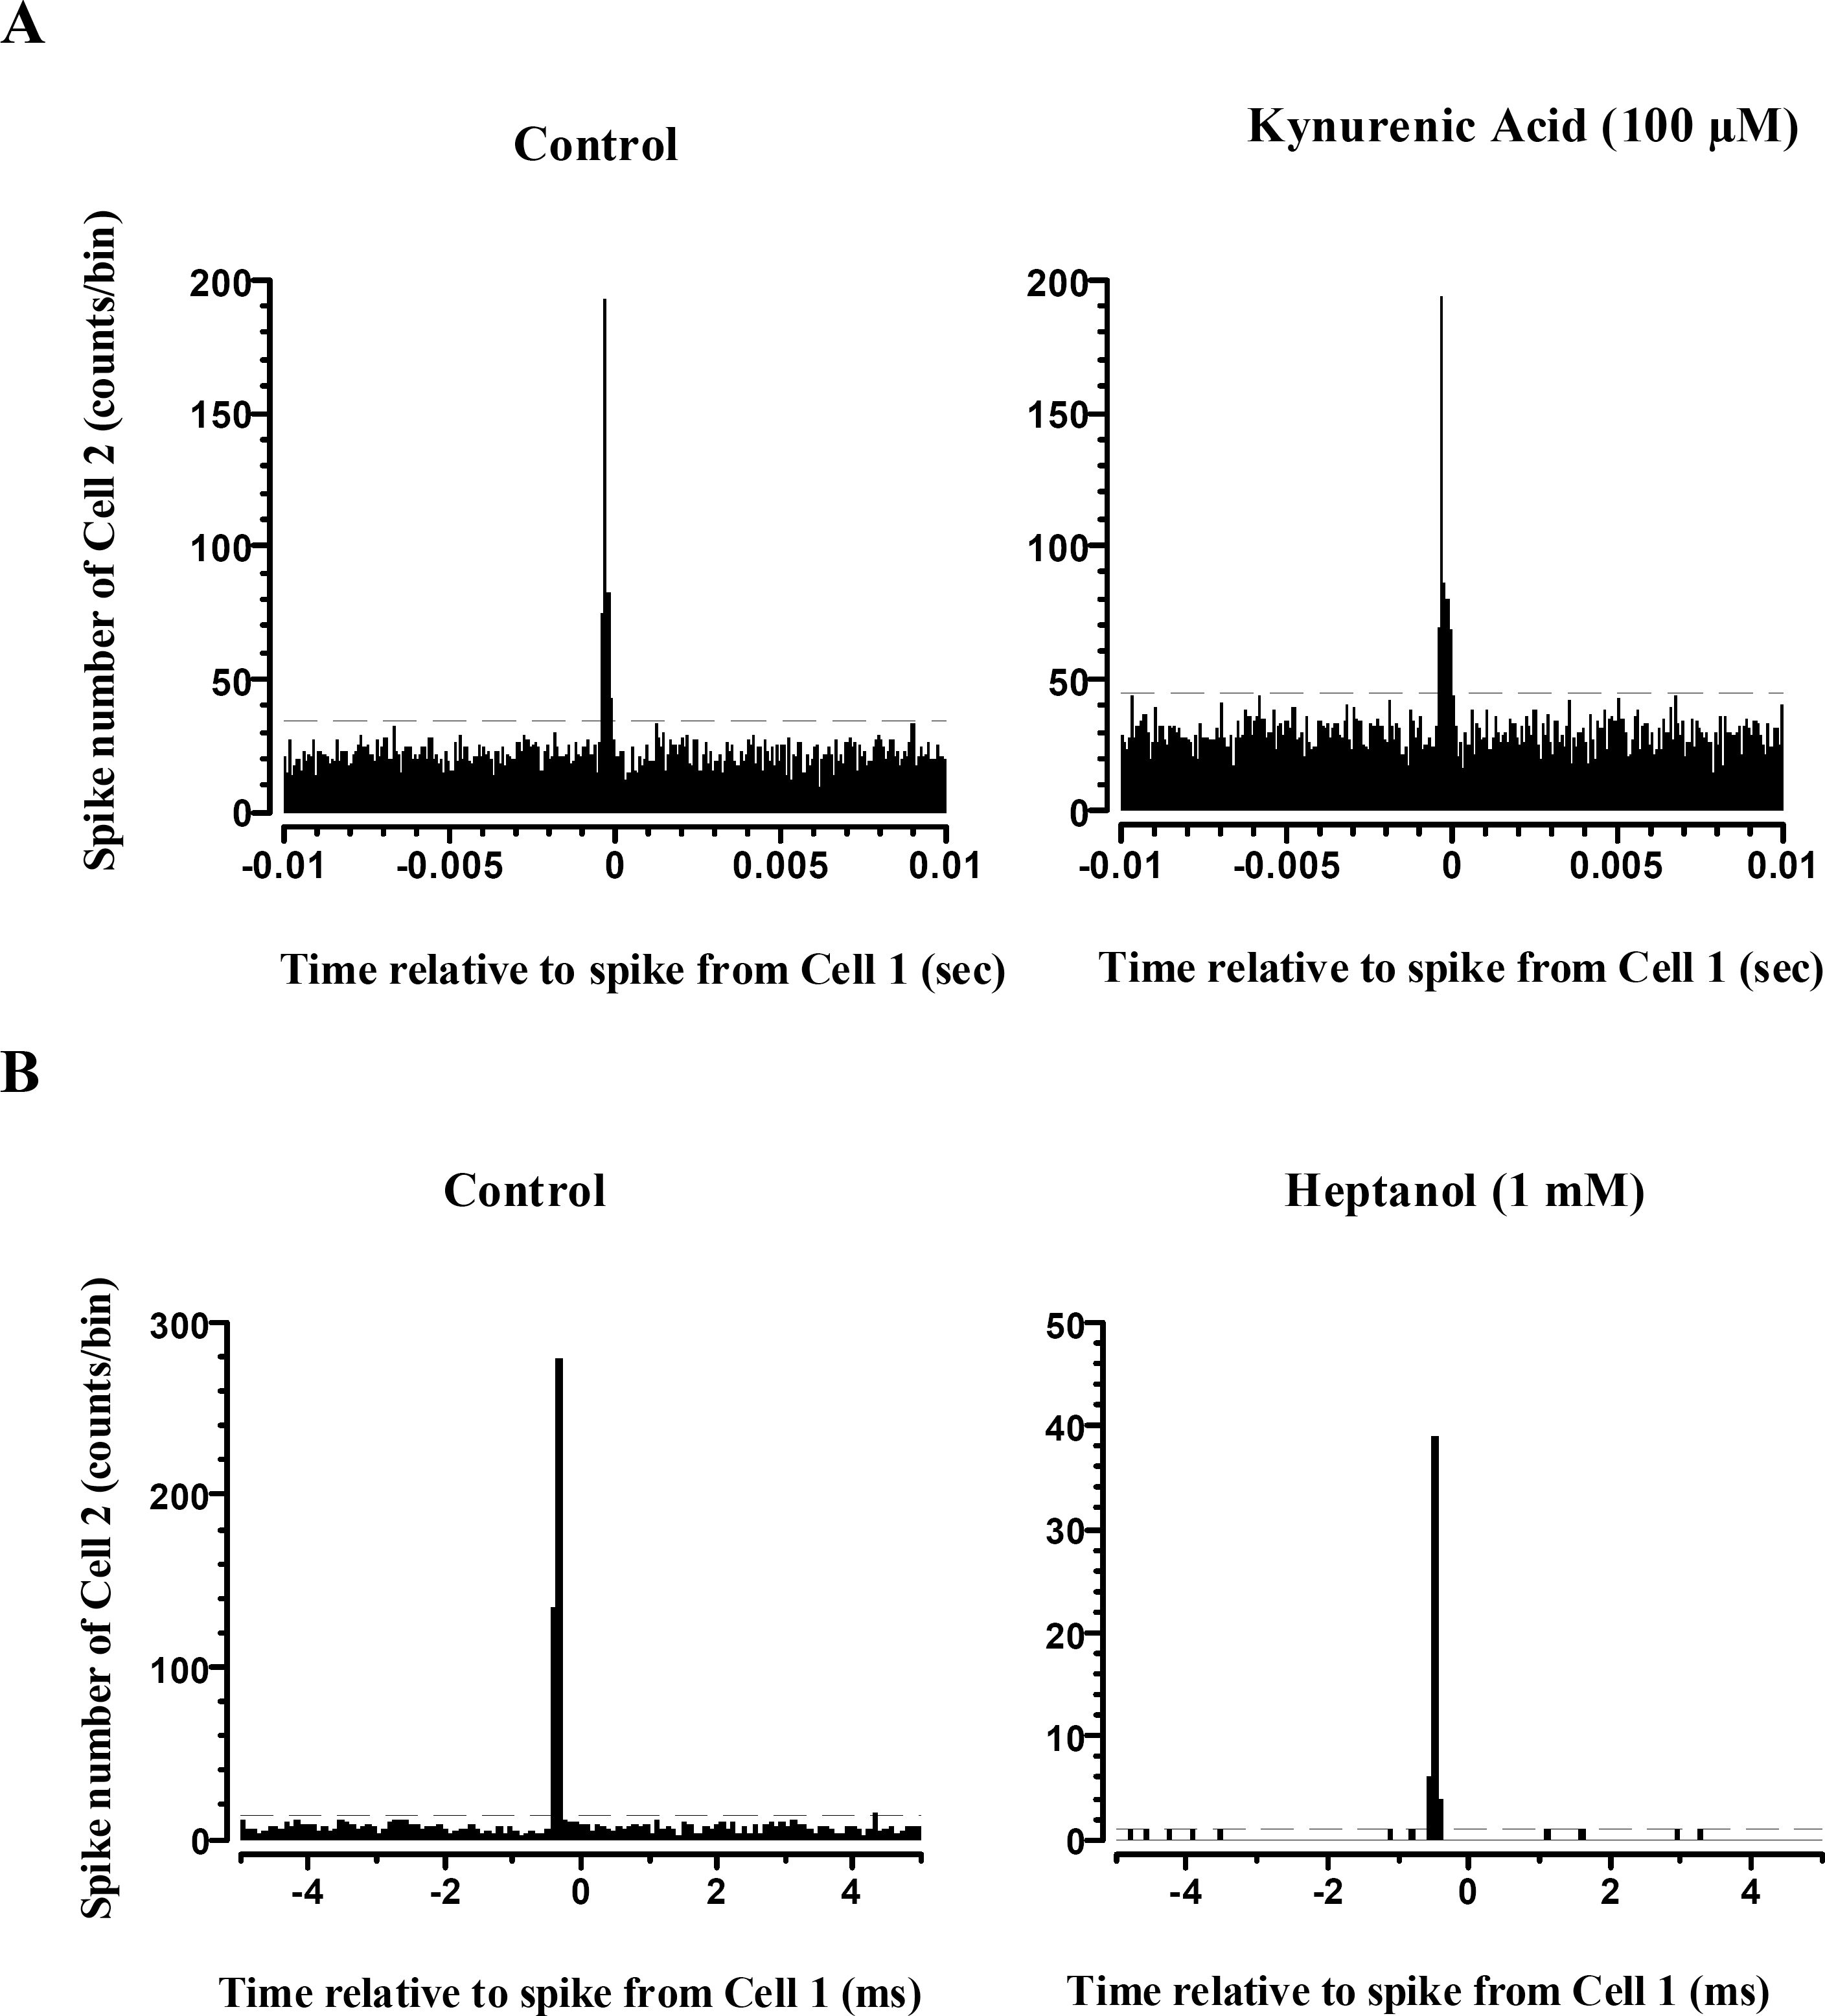
Fig. 6.
Two representative functional connectivity maps of the cluster of RGCs firing together. (A) Functional connectivity map A. (B) Functional connectivity map B. The neuron 45a depicts the first cell recorded and sorted on the 4th column and the 5th row of 8×8 MEA. The correlated cells are drawn with closedcircles and connected with reciprocal arrows. These two functional connectivity maps were harvested from the same retinal preparation.
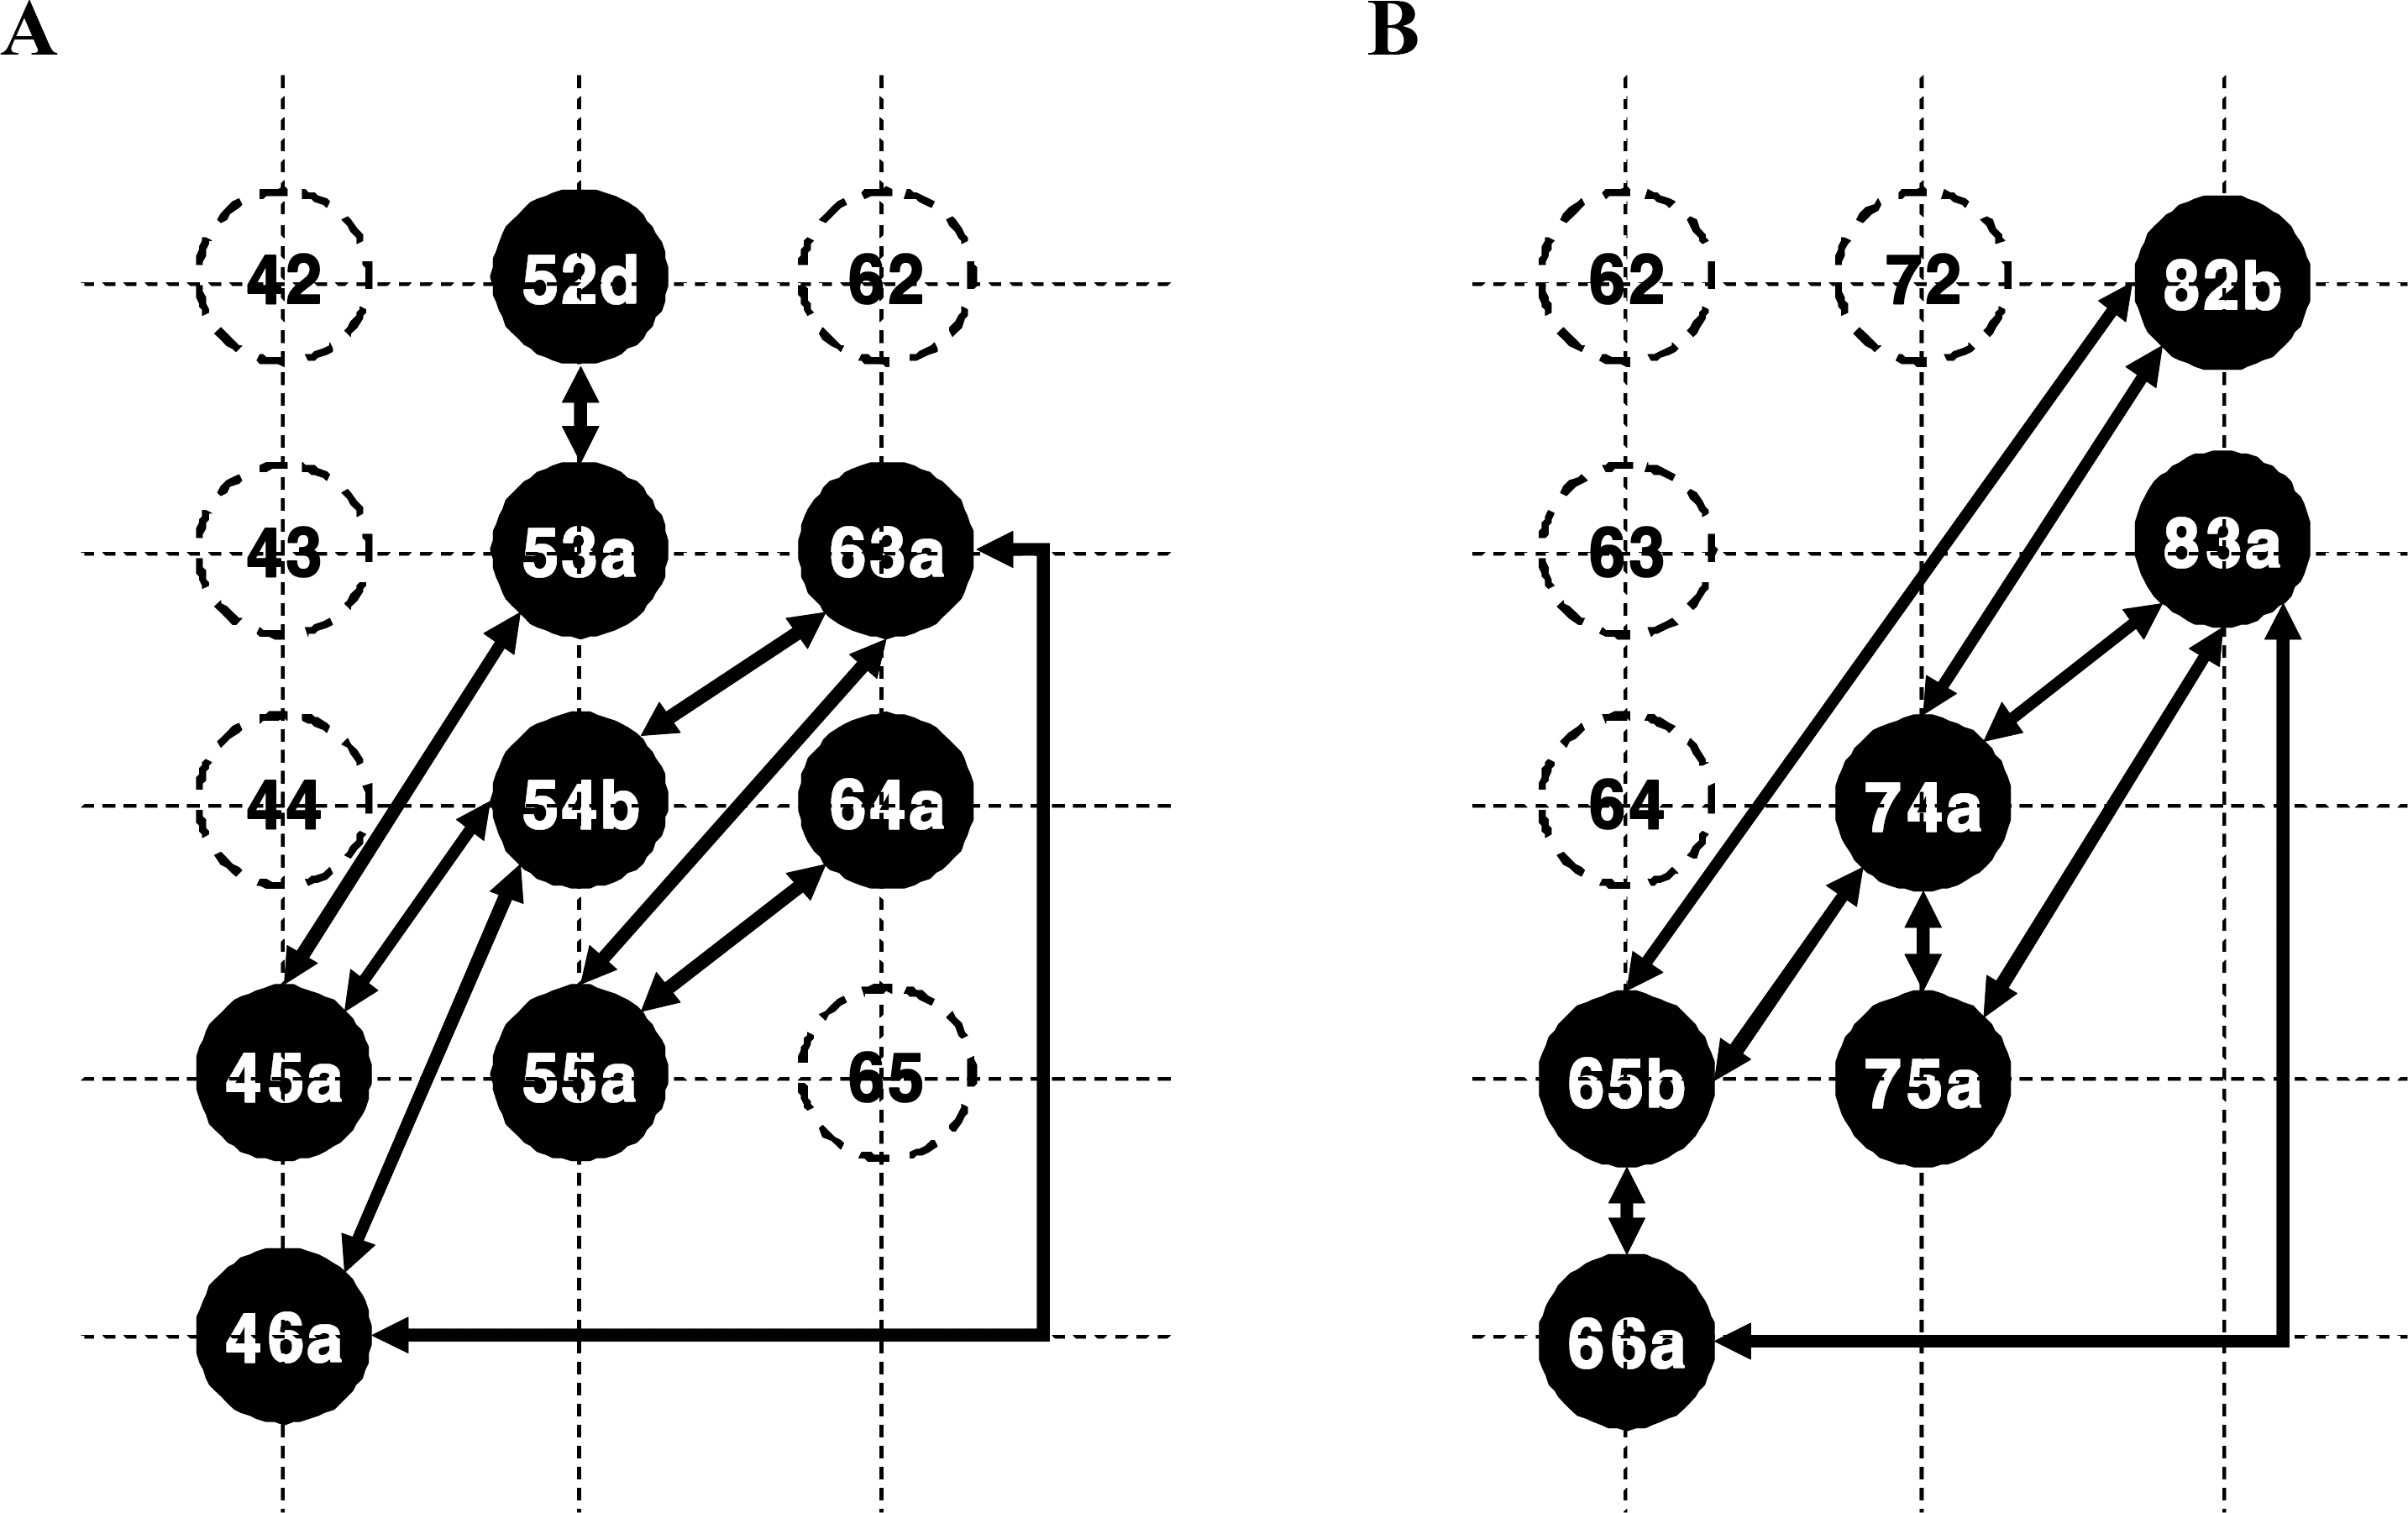
Table 1.
Retinal ganglion cell pairs which show correlated firing whit different reference cell


 PDF
PDF ePub
ePub Citation
 Print
Print


 XML Download