

 PDF
PDF ePub
ePub Citation
 Print
Print


Polypoidal choroidal vasculopathy (PCV) is a disorder characterized by a branching vascular network and polypoidal lesions on indocyanine green angiography (ICGA) [12]. Differentiating this specific subtype of choroidal neovascularization is important because its treatment may vary from the treatment of typical exudative, age-related macular degeneration (AMD). For example, photodynamic therapy, which is not a treatment employed in typical exudative AMD, is still considered a useful option in PCV [3].
The definitive diagnosis of PCV is usually based on ICGA results. However, ICGA is not routinely performed when diagnosing exudative AMD in clinical practice. In addition, although previous large clinical trials have evaluated the efficacy of anti-vascular endothelial growth factor (VEGF) for exudative AMD [456], the outcome for PCV patients could not be analyzed in these studies because ICGA was not routinely performed.
Recently, De Salvo et al. [7] suggested an optical coherence tomography (OCT)-based method to diagnose PCV. In their report, which included patients with retinal pigment epithelial detachment (RPED) that could be attributed to either PCV or occult choroidal neovascularization, the OCT-based diagnosis was highly sensitive and specific. We believe that an OCT-based diagnosis of PCV is particularly useful in Asian patients because the prevalence of PCV is markedly higher in Asians than it is in white patients [89].
The purpose of the present study was to evaluate the validity of an OCT-based diagnosis of PCV in Korean patients. In addition, we attempted to improve this method by including a choroidal thickness criterion.
Materials and Methods
This retrospective, observational case series was performed at a single center. The study was approved by the institutional review board and was conducted in accordance with the tenets of the Declaration of Helsinki.
Patients who were newly diagnosed with untreated exudative AMD between January 2013 and March 2014 at Kim's Eye Hospital were eligible for recruitment into the study. This patient cohort has also been used in other studies conducted by our group. Only those patients who underwent both enhanced-depth imaging OCT [10] and ICGA examinations were included. Exclusion criteria were severe media opacity, end-stage disease in which the exudative AMD subtype could not be determined, -6.0 diopters or greater myopia, 26.0 mm or greater axial length, immeasurable choroidal thickness due to poor identification of the chorio-scleral interface, or the presence of other retinal vascular disorders (e.g., macroaneurysm, proliferative diabetic retinopathy, and central retinal vascular occlusion). Eyes with a subretinal hemorrhage greater than five disc areas in size were also excluded because large hemorrhages may interfere with accurate OCT-based classification. When exudative AMD was diagnosed in both eyes, the eye that had been affected first was used.
Horizontal and vertical crosshair OCT scans (Spectralis; Heidelberg Engineering, Heidelberg, Germany) aligned at the central fovea were performed in conjunction with a raster scans covering a 20° to 30° field. Enhanced-depth imaging OCT driven by Spectralis software (Heidelberg Engineering) was performed using horizontal and vertical crosshair scans aligned at the central fovea. Fluorescein angiography and ICGA using a confocal laser-scanning system (HRA-2; Heidelberg Engineering) were also performed. To improve visualization, 50-100 scans were averaged for the crosshair scans. For the raster scan, 7 to 33 frames were averaged for a single OCT image, and 11 to 31 scanning lines covered the scan extent.
As described in a previous study [7], the OCT-based diagnosis of PCV was based on the presence of at least three of the following findings: multiple RPEDs, a sharp RPED peak, RPED notch, a rounded hyporeflective area representing the polyp lumen within hyperreflective lesions adhered beneath the retinal pigment epithelium, and the presence of hyperreflective intraretinal hard exudates. A single examiner, who was blinded to the angiography images and other patient information, performed the OCT-based diagnosis using Heidelberg Eye Explorer Software ver. 1.7.1.0 (Heidelberg Engineering). All the OCT images, including the cross-hair, scan images, and individual raster scan images, were reviewed.
In the present study, the ICGA-based classification was considered to be the gold-standard method. Two examiners analyzed the ICGA results and classified the patients. PCV was diagnosed based on the presence of branching vascular networks and/or terminating polypoidal lesions. Other cases were classified as typical exudative AMD. Any disagreement was settled with a discussion between the examiners.
The subfoveal choroidal thickness was additionally measured using enhanced-depth imaging OCT images and was defined as the distance from the hyperreflective line of the subfoveal Bruch's membrane to the innermost hyperreflective line of the subfoveal chorio-scleral interface. The 1 : 1 pixel images were used for qualitative analysis. Choroidal thickness was measured after the conversion to a 1 : 1 micron setting.
The incidence of each OCT feature in cases of both PCV and typical exudative AMD was compared. The results of the OCT-based diagnosis were compared with those of the ICGA-based analysis. Initially, PCV was diagnosed based on the previously described method when three or more OCT features were observed [7]. In eyes with two OCT features, an additional classification was performed using choroidal thickness criteria. If the subfoveal choroidal thickness was greater than 300 µm, then the eye was considered to have PCV despite displaying only two OCT features. The sensitivity and specificity of the original and modified methods, including the choroidal thickness criterion, were estimated.
The treatment outcomes of PCV were evaluated in the eyes that underwent intravitreal ranibizumab injection (0.5 mg/0.1 mL) and compared according to the different diagnosis methods used. Initially, three monthly ranibizumab injections were performed. An additional injection was administered in cases of recurrence. The best-corrected visual acuity (BCVA) was assessed at baseline and again at 3 and 6 months after treatment. The BCVA values at baseline and at 6 months were compared between the ICGA-confirmed cases of PCV and the cases of PCV that were diagnosed using OCT-based methods. The number of anti-VEGF injections given during the 6-month follow-up period was also compared between the groups.
Statistical analyses were performed using SPSS ver. 12.0 (SPSS Inc., Chicago, IL, USA). Comparisons were carried out using the chi-square test either with or without Bonferroni's correction. To compare the treatment outcomes between the groups, a one-way analysis of variance with Bonferroni's correction was used. A p-value less than 0.05 was considered statistically significant.
Results
A total 263 eyes in 263 patients satisfied the eligibility criteria (Table 1). Of these, 173 (65.8%) were men, and 90 (34.2%) were women. The mean age ± standard deviation was 70.3 ± 8.7 years. Based on the ICGA findings, typical exudative AMD and PCV were diagnosed in 116 eyes (44.1%) and 147 eyes (55.9%), respectively.
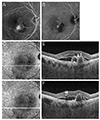
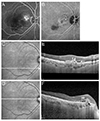
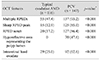
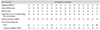
The incidences of each OCT feature in typical exudative AMD and PCV are summarized in Table 1. In eyes with PCV, multiple RPEDs, a sharp RPED peak, an RPED notch, a rounded, hyporeflective area representing the polyp lumen, and hyperreflective intraretinal hard exudates were observed in 137 eyes (93.2%), 125 eyes (85.0%), 127 eyes (86.4%), 70 eyes (47.6%), and 92 eyes (62.6%), respectively. In eyes with typical exudative AMD, these lesions were identified in 55 eyes (47.4%), 15 eyes (12.9%), 20 eyes (17.2%), 0 eyes, and 29 eyes (25.0%), respectively. The incidences of all five findings were significantly higher in eyes with PCV than in those with typical exudative AMD (Table 1). Figs. 1A-1F and 2A-2F show representative cases of PCV with various OCT features.
Among the 147 ICGA-confirmed PCVs, three or more OCT features were noted in 126 eyes (85.7%), whereas three or more OCT features were identified in 16 (13.8%) of 116 ICGA-confirmed typical exudative AMDs. The distribution of OCT features in PCV and typical exudative AMD are summarized in Tables 2 and 3. The sensitivity and specificity of the OCT-based PCV diagnosis were 85.7% and 86.2%, respectively. Twenty-one PCVs and 100 typical exudative AMDs exhibited less than three OCT features. Of these, two OCT features were noted in 14 eyes with PCV and in 14 eyes with typical exudative AMD. Among these eyes, a subfoveal choroidal thickness greater than 300 µm was observed in six eyes with PCV and in two eyes with typical exudative AMD. After applying the choroidal thickness criterion, 132 of 147 eyes (89.8%) with ICGA-confirmed PCV were diagnosed as PCV, and 18 of 116 eyes (15.5%) with ICGA-confirmed typical exudative AMD were further diagnosed with PCV. With this added criterion, the sensitivity increased from 85.7% to 89.8% and the specificity decreased from 86.2% to 84.5%.
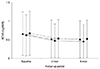
The changes in BCVA that occurred in the eyes that underwent three consecutive monthly ranibizumab injections as an initial treatment are shown in Fig. 3. In 111 ICGA-confirmed cases of PCV, the BCVA scores at baseline and 3 and 6 months after treatment were 0.62 ± 0.07, 0.47 ± 0.45, and 0.45 ± 0.45, respectively. The BCVA values were 0.67 ± 0.59, 0.53 ± 0.51, and 0.52 ± 0.50, respectively, when PCV was diagnosed as determined by the method suggested by De Salvo et al. [7] (107 eyes) and 0.66 ± 0.58, 0.52 ± 0.50, and 0.51 ± 0.50, respectively, when PCV was diagnosed using the modified method that included choroidal thickness criteria (113 eyes). The numbers of ranibizumab injections were 3.20 ± 0.54, 3.21 ± 0.54, and 3.19 ± 0.53 in cases of ICGA-confirmed PCV, PCV diagnosed with the method of De Salvo et al. [7] and PCV diagnosed with the modified method that included choroidal thickness, respectively. There was no significant difference in the BCVA at baseline (p = 1) or after 6 months (p = 1) among the three groups.
Discussion
In the present study, the OCT-based diagnosis of PCV proposed by De Salvo et al. [7] showed a relatively high sensitivity and specificity in Korean patients. The addition of choroidal thickness as a criterion improved the sensitivity of the method. This result is encouraging because in the present study, the OCT-based diagnosis was performed for patients regardless of the presence of visible RPED, whereas the efficacy of the method was originally determined in patients with at least one RPED [7]. The results of the present study, in conjunction with those of the previous study [7], suggest that the OCT-based diagnosis of PCV is a useful method in clinical practice, regardless of the patient's ethnicity.
In a previous study by De Salvo et al. [7], an OCT-based analysis was performed for eyes with one or more incidences of pigment epithelial detachment; classic exudative AMD were excluded. However, we included all patients, regardless of their fundus and fluorescein angiography findings, for the following reasons. First, as described previously by De Salvo et al. [7], the OCT-based method can be useful for patients with allergies to fluorescein dye. Therefore, by applying the OCT-based method in such patients, PCV can be diagnosed without fluorescein angiography findings. Secondly, small serous RPEDs are sometimes hard to accurately identify based on fundus photographs, even though they are easily identifiable upon stereoscopic fundus examination. In order to perform a subgroup analysis in clinical studies without ICGA, fundus findings may be interpreted mainly using fundus photographs. Thus, we believe that a PCV diagnosis using OCT alone has some advantages over the previously suggested methods, despite using only a single imaging modality, which may sacrifice some sensitivity and specificity.
The primary benefit of an OCT-based diagnosis of PCV is that it helps clinicians determine the appropriate treatment strategy in the absence of ICGA results. We believe that another important benefit of an OCT-based method is that the treatment outcomes in PCV patients in large clinical trials cannot be roughly estimated without ICGA results. These benefits are particularly important for Asian patients because the prevalence of PCV is markedly higher in Asia than it is in white patients [89]. The diagnosis of PCV is important to establish an appropriate treatment plan. Although anti-VEGF therapy was found to be effective in treating PCV [1112], its efficacy is limited in some PCVs [131415]. Thus, photodynamic therapy, which is inferior to anti-VEGF therapy in exudative AMD [16], continues to be employed as a useful alternative treatment for PCV [3]. In addition, several studies have reported varying efficacies among different anti-VEGF agents in PCV [1718]. Previous large-scale, prospective clinical trials [45616] evaluating the treatment outcomes in exudative AMD patients were mainly performed based on the population of Western countries in which PCV is infrequent. Because ICGA examinations are not routinely performed in these clinical trials, the treatment outcomes for PCV patients could not be separately analyzed. The OCT-based diagnosis of PCV has obvious limitations when compared with the gold-standard ICGA-based method. However, we believe that applying the OCT-based method to subgroup analyses in future large clinical trials can provide certain benefits because the result is generated from high quality data. These evaluations can provide a good (but not perfect) reference in future studies.
In order to identify whether an OCT-based diagnosis is useful for subgroup analysis in clinical studies, we compared the short-term treatment outcomes of PCV between cases that were classified based on ICGA and those classified using OCT. The findings indicated that the treatment outcomes were comparable, regardless of the method used for the diagnosis. This result may suggest the potential usefulness of OCT-based classification for subgroup analysis in future clinical studies, without the need for ICGA. We hope that further discussion among experts and additional studies may establish more accurate criteria for the OCT-based diagnosis of PCV. More complicated diagnosis methods may not be appropriate for use in clinical practice. However, we believe that even a complicated approach that requires significant time and effort to classify PCV can be used for the subgroup analysis in clinical studies.
The sensitivity and specificity of OCT-based PCV diagnoses in the previous study were 94.6% and 92.9%, respectively [7]. In the present study, the incidence of each OCT feature in PCV was lower, while the incidence of these features in typical exudative AMD was higher than the incidences reported previously by De Salvo et al. [7]. This difference in the incidence caused a decreased sensitivity and specificity. In addition to the qualitative nature of OCT analysis, which may have some inter-observer variation, we believe that the difference in inclusion criteria was the primary cause of these differing study results. The presence of at least one or more RPEDs was required for inclusion in the previous study [7], whereas there was no such inclusion criterion in the present study. In addition, patients were included in this study regardless of their fluorescein angiography findings, whereas classic exudative AMDs were excluded from the previous study [7].
The lower incidence of OCT features in eyes with PCV may partially originate from the OCT scanning strategy used in our patients. The high number of averaged frames for each OCT image may have improved the image quality and allowed for better detection of subtle abnormalities, such as the hyporeflective areas that represent the polyp lumen. In the present study, the number of averaged frames varied from seven to 33, suggesting that some subtle abnormalities may have been missed in the OCT images with fewer averaged frames. In addition, the number of scanning lines in the raster scans varied from 11 to 31. Less dense scanning lines may impede the accurate detection of small pathologic lesions.
Although the OCT features for diagnosing PCV were suggested by the study of De Salvo et al. [7], an appropriate OCT scanning strategy for obtaining standard diagnostic images was not described in their report. To generate consistent results, a specific number of averaged frames on OCT and the extent and number of scanning lines on raster scans should be set. Although employing the maximum number of averaged frames and the maximum extent and number of lines on raster scans may yield the best images for OCT analysis, this strategy is accompanied by a significantly longer scan time. Thus, this scanning strategy may not be used in patients with poor cooperation or fixation. Further prospective investigation will be required to identify the most appropriate OCT scanning strategy that has a tolerable scanning time and generates a satisfactory image quality.
It is well known that eyes with PCV generally exhibit a thicker choroid than that observed in typical exudative AMD [1920]. In the study by De Salvo et al. [7], however, the choroidal thickness was not used as a criterion to diagnose PCV. In the present study, we proposed a choroidal thickness criterion as an adjunct method to improve the sensitivity of OCT-based diagnoses. The mean subfoveal choroidal thickness in Asian patients with PCV was reportedly between 293.5 to 319.9 µm [1920]. The cut-off value used in the present study (300 µm) was comparable to these previously reported mean values. When additional classification was performed using the choroidal thickness criterion for eyes exhibiting two of the five OCT features, the sensitivity increased to 4.5%, while the specificity decreased to only 1.7%.
The greatest strength of the present study was that we evaluated the efficacy of an OCT-based diagnosis of PCV in a relatively large Asian cohort. However, this study had several limitations. The study was retrospective in design, and all the included patients were Asian. In addition, there was no single OCT scanning protocol. The extent and number of averaged frames differed substantially for the raster scans. All the OCT images used in the study were obtained at diagnosis; therefore, the present results may not be comparable to OCT images acquired during follow-up or after treatment. Lastly, only patients who underwent ICGA were included. We postulate that the relatively high proportion of PCV in the present study may be partially responsible for this fact. Although eyes with PCV generally exhibit a thick choroid, some eyes with PCV do not display this characteristic. In particular, a relatively thin choroid is associated with PCV with feeder vessels [21] and PCV without choroidal vascular hyperpermeability [22]. Thus, the choroidal thickness criteria suggested in the present study may not be valid for detecting these PCVs with a thin choroid.
In summary, the OCT-based diagnosis of PCV has achieved a relatively high sensitivity and specificity in Korean patients. The addition of the choroidal thickness criterion improved the sensitivity of this method. This OCT-based method may help clinicians develop appropriate treatment strategies for patients for whom ICGA results are unavailable. In addition, we believe that this method may be useful in the subgroup analysis of data in large clinical trials that lack an ICGA examination. Further discussion among experts and additional studies will be required to establish more accurate criteria for the OCT-based diagnosis of PCV.

 XML Download