

 PDF
PDF ePub
ePub Citation
 Print
Print


Neovascular age-related macular degeneration (AMD) is the leading cause of severe vision loss in countries with high life expectancy [12]. Neovascular AMD is characterized by the development of choroidal neovascularization (CNV), often leading to intra- or sub-retinal exudation and hemorrhage [3]. CNV is the growth of new blood vessels; growth from the choroid develops in the plane between the retinal pigment epithelium (RPE) and the Bruch membrane (subRPE CNV, type 1 growth pattern), between the retina and RPE (subretinal CNV, type 2 growth pattern), or a combination of both (combined growth pattern) [45].
In previous studies, the effectiveness of intravitreal anti-vascular endothelial growth factor (VEGF) (ranibizumab; Lucentis, Genentech, South San Francisco, CA, USA) injection for the treatment of neovascular AMD has been proven [67]. In a 2-year study, ranibizumab provided greater clinical benefits than verteporfin photodynamic therapy in patients with AMD with new-onset, predominantly classic CNV [8]. Rates of serious a dverse events were low. Ranibizumab (Lucentis) and bevacizumab (Avastin, Genentech) had similar effects on visual acuity over a 2-year period [9].
Fundus autofluorescence (FAF) is a noninvasive imaging method to metabolically map naturally or pathologically occurring fluorophores of the ocular fundus. The dominant source of fluorophores is A2-E in lipofuscin granules, which accumulate in the postmitotic RPE as a by-product of the incomplete degradation of photoreceptor outer segments [1011]. Progressive accumulation of lipofuscin within RPE cells is involved in the pathogenesis of AMD [121314].
FAF is a potentially useful noninvasive tool to distinguish between classic and occult CNV in AMD. Specifically, characteristics of classic CNV include a significantly decreased FAF, presumably due to their localization above the RPE level, leading to FAF blockage [15].
Although several studies have reported about FAF in patients with acute and chronic CNV, no study has compared FAF of acute onset CNV before and after intravitreal anti-VEGF treatment. The purpose of this study was to describe the FAF changes in patients with AMD before and after intravitreal anti-VEGF treatment according to the type of CNV, and to evaluate the correlation of FAF with spectral domain optical coherence tomography (SD-OCT) parameters and vision.
Materials and Methods
Patients
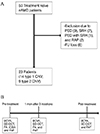
This retrospective study of medical records involved a series of 50 treatment naïve patients with CNV due to neovascular AMD who came to the department of ophthalmology, Konkuk University Medical Center from January 2010 to December 2013. Twenty seven patients were excluded due to the presence of large pigment epithelial detachment (n = 9), massive subretinal hemorrhage (n = 7), pigment epithelial detachment with subretinal hemorrhage (n = 1), the presence of retinal angiomatous proliferation (n = 2), and loss of follow-up (n = 8) (Fig. 1A and 1B). The remaining 23 patients had a recent onset of symptoms (less than 1 month). The patients were divided into two groups according to the type of CNV, and were further classified into type 1 (14 eyes) and type 2 (9 eyes) using SD-OCT and fluorescein angiography (FA). Type 3 CNV or retinal angiomatous proliferation was excluded according to SD-OCT, FA, and indocyanine green angiography at a baseline examination. All patients underwent three consecutive monthly intravitreal anti-VEGF (ranibizumab) injections, followed by as-needed injections. All patients underwent a complete ophthalmologic examination, including an assessment of best-corrected visual acuity (BCVA), SD-OCT, FA, indocyanine green angiography, and FAF imaging before the first intravitreal anti-VEGF injection (pre-treatment). One month after the three consecutive intravitreal anti-VEGF injections, the BCVA, SD-OCT, and FA were assessed. Post-treatment gray scale of FAF (%) measured in the test was performed 1 month after the last injection (post-treatment).
Fundus autofluorescence imaging and SD-OCT measurement
FAF imaging was obtained with a Spectralis HRA-OCT (HRA2; Heidelberg Engineering, Heidelberg, Germany), which included SD-OCT and confocal scanning laser ophthalmoscopy to visualize FAF. Confocal scanning laser ophthalmoscopy used blue light at a wavelength of 488 nm and barrier filter at 500 nm to illuminate the fundus and detect fluorescence signals from the retinal and RPE layers.
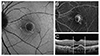
In FAF images, the CNV area was delineated using FA and SD-OCT images, and gray scales of the CNV area were measured before and after treatment. Gray scales of the FAF images were analyzed using the ImageJ (Wayne Rasband, Bethesda, MD, USA), which were adjusted by comparison with normal background areas (four random sites of the peripheral area, 200 µm in diameter), with black being "0" and white being "255." The comparison of the ratio of gray scale (%), calculated as ([gray scale of lesion] / [average of four background areas] × 100), was made before and after treatment (3 months after the final intravitreal anti-VEGF injection). Background areas were defined as four vessel-free areas, 200 µm in diameter, which are 4 mm apart from the fovea at superotemporal, superonasal, inferotemporal, and inferonasal locations (Fig. 2A-2C).
OCT imaging was obtained with a spectral domain combined scanning laser ophthalmoscopy (Spectralis HRA + OCT; Heidelberg Engineering). SD-OCT parameters, including CNV thickness, photoreceptor inner and outer segment junction (IS/OS) disruption length, external limiting membrane (ELM) disruption length, central macular thickness (CMT), subretinal fluid (SRF), and intraretinal fluid (IRF), were measured. The correlation of changes in SD-OCT parameters and changes in FAF were also analyzed.
Statistical analyses
All data are expressed as the mean ± standard error of the mean. The PASW Statistics ver. 18.0 (SPSS Inc., Chicago, IL, USA) was used for the analyses. Baseline characteristics and SD-OCT parameters between the two groups were compared using the Mann-Whitney test. The mean change in gray scale of FAF was compared between baseline and post-treatment with the Wilcoxon signed ranks test. A p-value of less than 0.05 was considered statistically significant.
Results
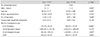
Twenty three eyes of 23 patients (14 men and 9 women) were analyzed. The mean age of the subjects was 66.52 ± 9.28 years. There were no significant differences in the mean age, sex, initial BCVA, and the number of injections between the type 1 and type 2 CNV groups. CNV thickness was significantly thicker in the type 2 CNV group than in the type 1 CNV group (p < 0.001), while other SD-OCT characteristics were not significantly different between two groups. The patients' baseline characteristics are summarized in Table 1.
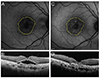
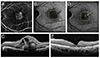
The gray scale data of FAF in background areas are presented in Table 2. The mean gray scales (%) of FAF in type 1 CNV and type 2 CNV before treatment were 52.20 ± 12.22% and 42.55 ± 11.89%, respectively. After treatment, the mean gray scales of type 1 CNV and type 2 CNV were 57.61 ± 14.27 and 57.93 ± 10.35, respectively. The statistical analyses showed a significant increase in the mean gray scale of both groups after treatment (p = 0.005 and p = 0.008, respectively) (Figs. 3A-3D and 4A-4E).
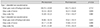
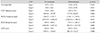
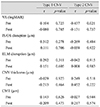
There were no significant differences in SD-OCT parameters before and after treatment in type 1 CNV. In type 2 CNV, CNV thickness, IS/OS disruption length, and CMT were significantly decreased after treatment (p = 0.004, p = 0.031, p = 0.008, respectively). In terms of visual acuity (VA) (logarithm of the minimum angle of resolution [logMAR]), there was a significant improvement after treatment in type 2 CNV (p = 0.011) (Table 3). Post-treatment VA (logMAR) of type 1 CNV correlated with post-treatment IS/OS disruption length, ELM disruption length, CNV thickness, and CMT (p = 0.004, p = 0.005, p = 0.017, p = 0.013, respectively). In type 2 CNV, pre-treatment IS/OS disruption length and ELM disruption length were significantly associated with post-treatment VA (logMAR) (p = 0.021, p = 0.022) (Table 4).
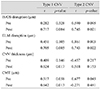
After treatment, there was a significant correlation of FAF gray scale with VA (logMAR) in type 2 CNV (r = -0.437, p = 0.021). Brighter post-treatment FAF was associated with better post-treatment VA (Table 5).
Discussion
FAF is a noninvasive imaging technology that provides information on the lipofuscin within RPE cells [1215]. Vaclavik et al. [16] reported that the intact FAF at the macula in early CNV correlates with VA, lesion size, and symptom length, but not lesion type. In late stage CNV, decreased FAF indicates the loss of RPE and photoreceptors [17]. Presently, the baseline FAF of CNV was decreased more than the reference area, and the FAF of CNV was increased after treatment in both types of CNV.
SD-OCT parameters are known to be associated with visual outcome in patients with AMD. Visual outcome correlates with IS/OS and ELM disruption length [1819]. In the current study, post-treatment VA correlated with IS/OS disruption length, ELM disruption length, CNV thickness, and CMT in type 1 CNV. In type 2 CNV, a significant correlation was seen between post-treatment FAF and pre-treatment VA (logMAR).
Post-treatment FAF was increased in eyes with better pre-treatment VA. This result suggests that post-treatment RPE/photoreceptor function was maintained in eyes with good initial VA, and RPE/photoreceptor function was damaged in eyes with worse initial VAs. Initial CMT in type 2 CNV was negatively associated with post-treatment FAF, indicating that the RPE/photoreceptor complex was damaged more in eyes with thicker pre-treatment CMT. Subretinal or intra-retinal fluid was usually evident in the initial SD-OCT. This SRF or IRF was almost completely absorbed after treatment. We presume that the decreased SRF and IRF could result in an increase in post-treatment FAF. After SRF and IRF were absorbed, the increase in FAF suggested that the function of the RPE/photoreceptor complex was preserved. FAF of type 2 CNV was increased more than the FAF of type 1 CNV. In addition, post-treatment VA in type 2 CNV showed more improvement than type 1 CNV. The above findings collectively suggest that the increased post-treatment FAF might be an indicator of preserved RPE/photoreceptor function with possible long-term favorable visual prognosis, although there was no significant correlation between FAF and vision observed in the present study.
Cystoid macular edema located at fovea can brighten the signal of 480 nm FAF [20]. In our study, two patients had cystoid macular edema spanning fovea. The initial FAF of these two patients could be increased by the cystoid macular edema effect. However, the amount of FAF reduction in the two patients was not statistically different from that of the other five patients (p = 0.242). Therefore, the effects of cystoid macular edema on the FAF in this study are not considered to have been significant enough to affect the FAF change by CNV reduction.
The current study has several limitations, including its retrospective nature and the small study population. To obtain a clear image of FAF, limited numbers of patients were included in this study. Another limitation was that this study was uncontrolled. Therefore, the initial FAF of CNV lesions could not be compared with normal foveal FAF. The presence of complicating fluid and hemorrhage made the evaluation of CNV lesions difficult in this study. The cause of this difficulty lies in the fact that these components basically block FAF. Even if the serious bleeding or swelling can be excluded, a small amount of bleeding can interfere with the interpretation of results. Before the treatments began, the lesion was composed of exudation, hemorrhage, and CNV; however, after three monthly doses were given, the lesion had become drier than in the pre-treatment period. In addition, the lesion is generally composed of C NV and fibrosis as a result of treatment. With the exudation and hemorrhage reduced, which led to a decrease in the "blockage" of FAF, it is predicted that the lesion can be brightened with the treatments.
In conclusion, FAF of both CNV types with SRF were low before treatment. FAF tended to increase with anti-VEGF treatment in both types. Considering that most of the patients had the disease for a relatively short period, these results indicate that a decreased FAF before treatment does not result in the destruction or dysfunction of the RPE/photoreceptor complex. The increased FAF after treatment is thought to be caused by resolved subretinal and IRFs in most cases. These findings indicate that the function of the RPE/photoreceptor complex in both types of CNV might be preserved if treated promptly.
 XML Download