

 PDF
PDF ePub
ePub Citation
 Print
Print


Pulsatile ocular blood flow (POBF) determines the summed volume of blood entering the outer retina, choroid, and remaining uveal tract of the eye by measuring increases in intraocular pressure (IOP), with each heartbeat. POBF reflects the choroidal circulation, which is responsible for 85% of the POBF [1]. Other pulsatile components of pulse amplitude (OBFa), pulse volume (OBFv), and pulse rate (OBFr). OBFa indicates the amplitude of blood flow entering the eyeball. OBFv indicates the amount of blood entering the eyeball per each contraction of the heart. OBFr indicates the rate of ocular blood flow due to hear beat. This noninvasive assessment of ocular blood flow is based on analysis of the IOP pulse quantified by Perkins [2], utilizing a modified applanation prism with distensible film at the contact surface. Langham et al. [1] used a pneumotonometer to obtain a wave form of the ocular pulse, and subsequently derived values for POBF by assessing this wave form and its amplitude, together with the heart rate of subject. The pulsatile components of choroidal circulation are calculated from the ocular pulse wave produced by the bolus of blood entering the eye during cardiac systole. Because the eye is a closed compartment, volumetric blood changes are transferred to a pressure gradient, which is recorded by the pneumotonometer and linked to a blood flow analyzer (BFA). Measurements of POBF using this system have been found to give reproducible results [34]. Thus, POBF analysis is used for assessment of ocular vascular pathologies.
POBF has been evaluated in several ocular diseases, including glaucoma, retinitis pigmentosa, and age related macular degeneration [567]. Several authors have reported that factors such as age, heart rate, blood pressure, and axial length influence POBF [891011]. Previous studies have reported that a relationship exists between the refractive error or axial length of the eye and POBF [111213]. A study by Mori et al. [12] shows no correlation of refractive error with POBF, while a study by Benavente-Perez et al. [13] shows a positive correlation of refractive error with POBF.
In this study, we evaluate the pulsatile components of ocular blood flow (OBFa, OBFv, OBFr, and POBF) in healthy young human eyes, and determine choroidal blood flow changes in eyes with high myopia according to the pulsatile components of ocular blood flow analysis.
Materials and Methods
A total of 104 subjects (52 males and 52 females) were included in this study. The subjects were all healthy and young, in their twenties. The study adheres to the Declaration of Helsinki. All volunteers provided informed consent before examination. Only healthy young people with normal blood pressure and IOPs were selected for inclusion, and the study excludes smokers and subjects with hypertension, diabetes, heart disease, hypercholesterolemia, impaired renal function, ocular disease, or any history of ophthalmic surgery.
One eye of each participant was randomly selected and assigned to one of four refractive groups, including groups of hyperopes (n = 20; refractive error, ≥+1.00 diopter [D]), emmetropes (n = 28; refractive error, ±0.75 D), lower myopes (n = 33; refractive error, -1.00 to -4.75 D), and high myopes (n = 23; refractive error, ≤-5.00 D). All subjects underwent a full ophthalmic examination, including assessment of visual acuity, measurement of refractive error using an auto refractometer (KR-7100P Auto Kerato-Refractometer; Topcon, Tokyo, Japan), slit lamp examination, and fundus examination. Axial length was measured using an instruments named the IOL Master (Carl Zeiss Meditec, Jena, Germany), and IOP was measured using a Goldmann applanation tonometer. The same technician measured POBF with a BFA (Paradigm Medical Industries, West Salt Lake City, UT, USA). POBF measurements were performed with the subjects in a sitting position after topical instillation of a topical anesthetic (proparacaine hydrochloride 0.5% drops). The BFA automatically recorded five consecutive pulse waves of equivalent amplitude and measured the mean IOP from ocular blood flow (OBFiop), OBFa, OBFv, OBFr, and POBF. Inclusion criteria involved corrected visual acuity of 20 / 20 or better, IOP less than 21 mmHg, and astigmatism <1.5 D cylinder. Subjects who showed signs of pathologic change during fundus examination were excluded from the study.
Systolic blood pressure (SBP) and diastolic blood pressure (DBP) were measured with the subject seated after 10 minutes of rest, using an automated sphygmomanometer (HD-505; Jawon Medical, Kyungsan, Korea). Mean arterial blood pressure (MABP) was calculated as ([2 × DBP] + SBP)/3. Ocular perfusion pressure (OPP) was calculated as 2/3MABP - IOP.
Statistics
All data were reported as mean ± standard deviation. Statistical analyses were performed using IBM SPSS ver. 20.0 (IBM Corp., Armonk, NY, USA). One-way ANOVA and Scheffe post-hoc analyses were used for the assessment of differences between groups. Pearson's linear correlation analysis was performed in order to examine the relationship between the pulsatile components of ocular blood flow and the refractive error and axial length of the eyes of the subjects. Statistical significance was accepted for p < 0.05.
Results
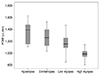
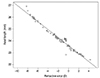
Data for 104 subjects (52 males and 52 females) were included in the analysis (mean age, 25.68 ± 2.12 years; range, 22 to 29 years). All subjects had a best-corrected visual acuity of better than 20 / 20. The mean IOP was 14.65 ± 1.79 mmHg (range, 10 to 20 mmHg), and the mean POBF value was 1,182.46 ± 192.51 µL/min (range, 804 to 1,632 µL/min). Only one eye of each subject was randomly included and assigned to one of four refractive groups. Fig. 1 shows the mean values and the ranges of POBF in the different groups. Fig. 2 shows the relationship between refractive error and axial length (r = -0.972, p < 0.001).
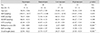
There were no significant differences in age, SBP, DBP, MABP, OPP, or IOP among the subjects in each of the four groups. The axial length of the high myopes was significantly longer (p < 0.001, ANOVA) than the axial length of the hyperopes, emmetropes, and low myopes (Table 1).
High myopes showed significantly lower OBFa, OBFv, and POBF than these components in three other groups (p < 0.001, p < 0.001, p < 0.001 respectively). POBF showed statistical significance in all four groups, however, there were no significant differences in OBFa and OBFv between hyperopes and emmetropes. No significant differences in OBFiop or OBFr were observed among the four groups (Table 2).
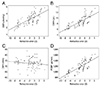
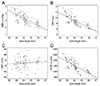
Refractive error showed positive correlations with the pulsatile factors of OBFa, OBFv, and POBF (r = 0.729, p < 0.001; r = 0.772, p < 0.001; r = 0.781, p < 0.001, respectively), whereas axial length showed negative correlations with OBFa, OBFv, and POBF (r = -0.727, p < 0.001; r = -0.762, p < 0.001; r = -0.771, p < 0.001, respectively). The correlations of refractive error and axial length with OBFr were irrelevant (r = -0.157, p = 0.113; r = 0.123, p = 0.213) (Figs. 3 and 4).
Discussion
Choroidal blood flow is the major source of oxygen and nutrients for the choroid and the outer retina of the eye [14]. Impaired choroidal blood flow is associated with several ocular diseases, including glaucoma, retinitis pigmentosa, and age-related macular degeneration [567]. Therefore, clinical diagnosis of reduced choroidal blood flow in myopic eyes is related to ocular pathologies. In order to detect reduced choroidal blood flow in early stages, rapid measurement of blood flow during the patient's visit is critical.
Pulsatile components of ocular blood flow are caused by the entry of a bolus of blood into the eye with each contraction of the heart. Ocular blood flow predominantly reflects circulation within the choroidal system, and represents a minor change in total ocular volume [15]. Studies in animal models of myopia have reported an increase in axial length accompanied by morphological changes in the choriocapillary layer. In one specific case of a chick model, the changes in the choriocapillary layer are followed by a reduction in choroidal blood flow as well [1617]. These results suggest a potential association between a more negative refractive error and longer axial length and changes in choroidal blood flow.
Normally, as axial length increases, scleral thickness decreases [18]. Negative correlations between scleral rigidity and both ocular volume and axial length have been described in certain studies [1920]. In addition, an association of decreased subfoveal choroidal thickness with decreased refractive error and axial length has been previously described [21]. Thus, thinning of the sclera, outer retina, and choroid in myopic eyes, which are typical features of reduced choroidal blood flow, might be expected. For this reason, increased susceptibility for several ocular vascular diseases is suspected in these eyes.
Previous studies have reported that POBF might be affected by several factors. The work of Ravalico et al. [11] find that ocular pulse amplitude and POBF decrease as age advanced in normal subjects. Meanwhile, a study of Harris et al. [22] suggests that retrobulbar circulation differs between men and women. In order to exclude factors that influence POBF such as age and gender, this study selects young adults (mean age, 25.68 ± 2.12 years; range, 22 to 29 years), as well as an equal number of male and female subjects (52 male and 52 female). This study is the first to report the distribution and the mean value of pulsatile components in ocular blood flow (i.e., OBFa, OBFv, OBFr, and POBF) based on healthy young human eyes.
This study, we compares systemic blood pressure, OPP, and the pulsatile component of ocular blood flow (i.e., OBFa, OBFv, OBFr, and POBF) in a cohort of healthy young eyes classified in groups of hyperopes, emmetropes, low myopes, and high myopes. There were no differences in systemic blood pressure or OPP among the groups. Components of OBFa, OBFv, and POBF, however, were significantly lower in high myopes than in the other three groups. We conclude, therefore, that POBF is likely related to causes of ocular vascular diseases in high myopes. In addition, our study shows that factors of both the axial length and refractive error influence pulsatile components of OBFa, OBFv, and POBF, but not OBFr. This finding suggests that elongation of the eye globe might influence OBFa, OBFv, and POBF, without causing changes in OBFr, possibly reflecting a relationship to choroidal blood flow. It has also been suggested that, elongation of the eye globe causes physical changes in the properties of the choroidal vessels, such as narrowing of the diameter and increasing rigidity of the wall, which explains the influence of elongation on OBFa, OBFv, and POBF, but not on OBFr. Such probable physical changes in the choroidal vessels lead to the impediment of ocular blood, thereby causing increased risk high myopes for ocular vascular diseases.
One of the limitations of this study is that POBF is only able to assess hemodynamics in the eye. Various techniques, such as laser Doppler velocimetry, laser Doppler flowmetry, and color Doppler imaging, have been suggested for futher study of ocular hemodynamics [2324]. Another limitation is that confirmation of actual physical changes in choroidal vessels (i.e., narrowing and increased rigidity) requires histopathologic findings. In conclusion, we evaluate observed changes in choroidal blood flow in eyes with high myopia using BFA, and find that changes in axial length in eyes with high myopia could influence choroidal blood flow components in healthy subjects.

 XML Download