

 PDF
PDF ePub
ePub Citation
 Print
Print


The grades of visual impairment that constitute "low vision" and "blindness" are defined in the World Health Organization's tenth revision of the International Statistical Classification of Diseases and Related Health Problems (ICD-10) [1]. The ICD-10 defines blindness as a visual acuity (VA) of below 0.05. In addition, vision loss is classified based on the subject's decimal VA as either normal vision (≥0.8), mild vision loss (0.63-0.3), moderate vision loss (0.25-0.125), severe vision loss (0.1-0.05), profound vision loss (0.04-0.02), near blindness (less than 0.02 to "Perception of Light"), and total blindness [2]. In Korea, legal blindness is defined as a best-corrected visual acuity (BCVA) of 0.02 or less using the Snellen VA chart, and the government provides financial support for patients with legal blindness according to the severity of their vision loss. Therefore, accurate measurement of VA is important for patients with legal blindness.
Ordinarily, VA is measured using a VA chart. However, the subjectivity of this method limits the exact evaluation of VA. Therefore, objective tests of visual function should be employed to define legal blindness and to identify malingering patients. Pattern visual evoked potential (PVEP) has been used to measure objective VA in numerous studies in both adults and children, especially in pure malingers [3]. Therefore, we investigated 95% confidence intervals (CIs) from PVEP parameters in normal controls and compared the characteristics of the PVEP in patients with severe visual loss and normal controls.
Materials and Methods
The medical records of patients seen from January 2011 through December 2012 were reviewed. Of the 560 patients in whom PVEP testing was performed, 59 had a BCVA of ≤0.2. These visual loss patients were divided into three groups: group 1 (the blindness group), in which the BCVA ranged from no light perception to less than 0.02 on the Snellen VA scale, group 2 (the severe vision loss group, BCVA ranging from 0.02 to 0.1), and group 3 (the moderate vision loss group, BCVA ranging from 0.125 to 0.25). In addition, a normal control group (group 4) was included for comparison. The eyes of the control group patients had no retinal nerve fiber layer loss detected by optical coherence tomography, normal visual fields, and best corrected visual acuities ≥1.0. This research study was reviewed and approved by the institutional review board of Kim's Eye Hospital, and all procedures conformed to the guidelines of the Declaration of Helsinki.
In accordance with the recommendations of the International Society for Clinical Electrophysiology of Vision [4], active electrodes were placed on the scalp over the visual cortex at Oz, with the reference electrode at Fz. The ground electrode was placed on the forehead. The RETI-scan System (Roland Consult, Wiesbaden, Germany) was used. The subjects' refractive errors were corrected with trial lenses before the recordings were made and monocular stimulation was done. Each subject sat 1 meter from the monitor in a moderately lighted room. The checkerboard stimulus subtended a visual angle of 8.5° vertically and horizontally on either side of the fixation using a CRT monitor. The stimulant was a black-and-white lattice pattern. The pattern was 32 × 32 (25 minutes of arc) in size. The pattern reversal rate was 1.0 Hz, and the analysis time was 250 msec. The wave form was analyzed after 100 repetitions. The mean luminance of the checkerboard was 50 cd m-2. Fixation cooperation was monitored closely by an experienced technician.
The 95% confidence intervals of amplitudes and latencies
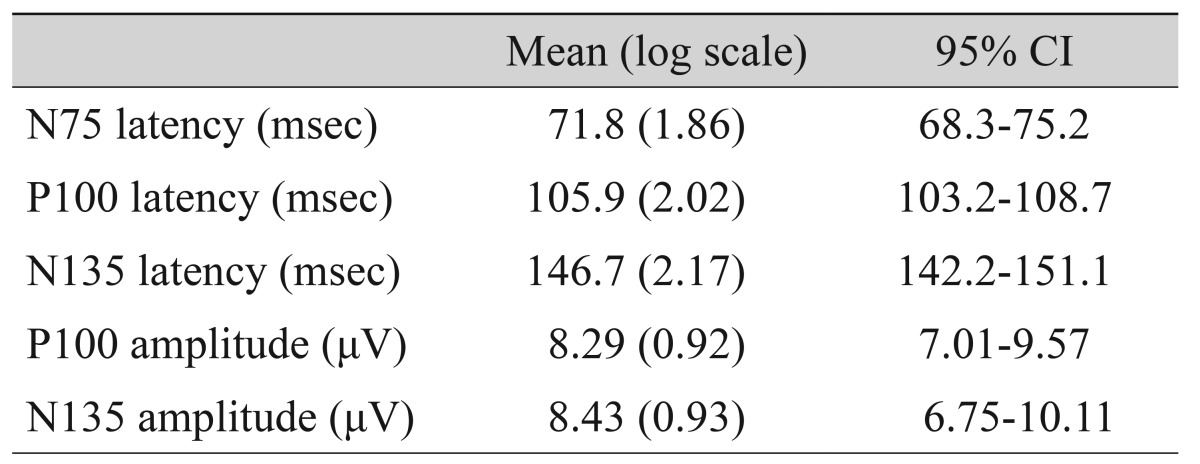
To define the 95% CI of amplitude and latency, we analyzed results of the control group. We performed PVEP in 42 healthy controls, and then P100 amplitude, N135 amplitude, N75 latency, P100 latency and N135 latency were obtained. The P100 amplitude was measured from the preceding N75 peak, while the N135 amplitude was obtained from the preceding P100 peak.
Analysis of pattern visual evoked potential in severe visual loss patients
The amplitude and latency were evaluated and compared among the three groups. The correlation between the P100 and N135 amplitudes was also analyzed. The amplitude scale used was logarithmic. Values for these parameters were compared among the patients and receiver operating characteristic analyses were performed.
Data were analyzed using SPSS ver. 14.0 (SPSS Inc., Chicago, IL, USA). The distribution of age, sex ratio and causes of severe visual loss among the four groups were evaluated using chi-square tests. Differences in the means of the parameters among the four groups were evaluated using 1-way analysis of variance (ANOVA) and were considered to be statistically significant when the p-value was <0.05. Post-hoc analysis was done by Tukey's method.
Go to : 
Results
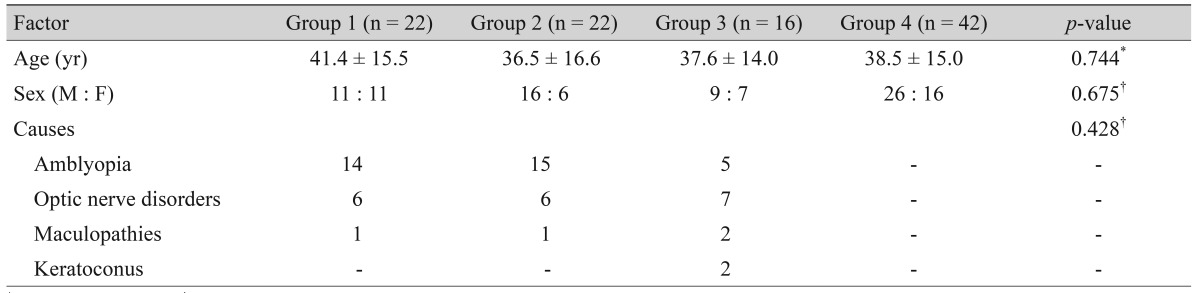
A total of 101 eyes were investigated (group 1, 22 eyes; group 2, 22 eyes; group 3, 16 eyes; group 4, 42 eyes). The age and the sex ratio did not differ significantly among the groups (p = 0.744 and 0.675, respectively) (Table 1). The causes of visual loss did not show any differences between group 1, group 2, and group 3. The 95% CIs of the P100 and N135 amplitudes of the normal controls were 7.01 to 9.57 µV and 6.75 to 10.11 µV, respectively (Table 2).
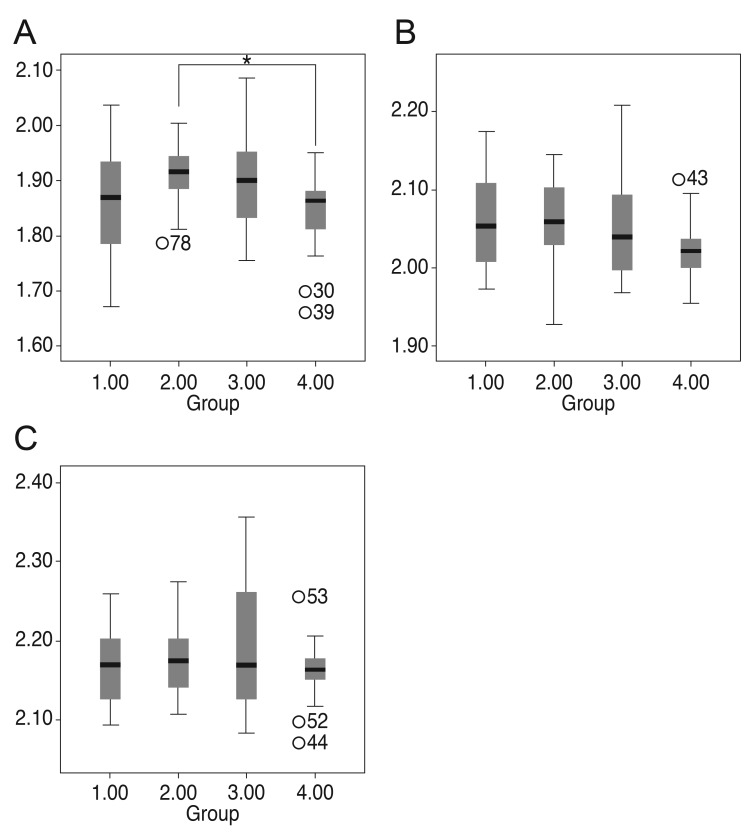
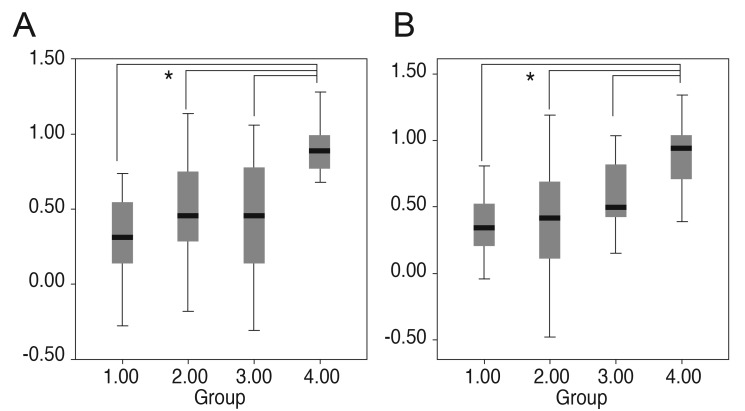
For the three latencies, the N75 latency and P100 latency showed a significant difference among the groups (p = 0.026 and p = 0.039). Under posthoc analysis, however, the N75 latency of group 2 was only longer than that of group 4 (Fig. 1). The 135 latency did not have any differences among the groups. The amplitudes of P100 and N135 were highest in the control group (group 4). The P100 and the N135 amplitudes both differed significantly among the groups (1-way ANOVA, p < 0.001) (Fig. 2). There were no differences in latencies and amplitudes between group 1, group 2 and group 3.
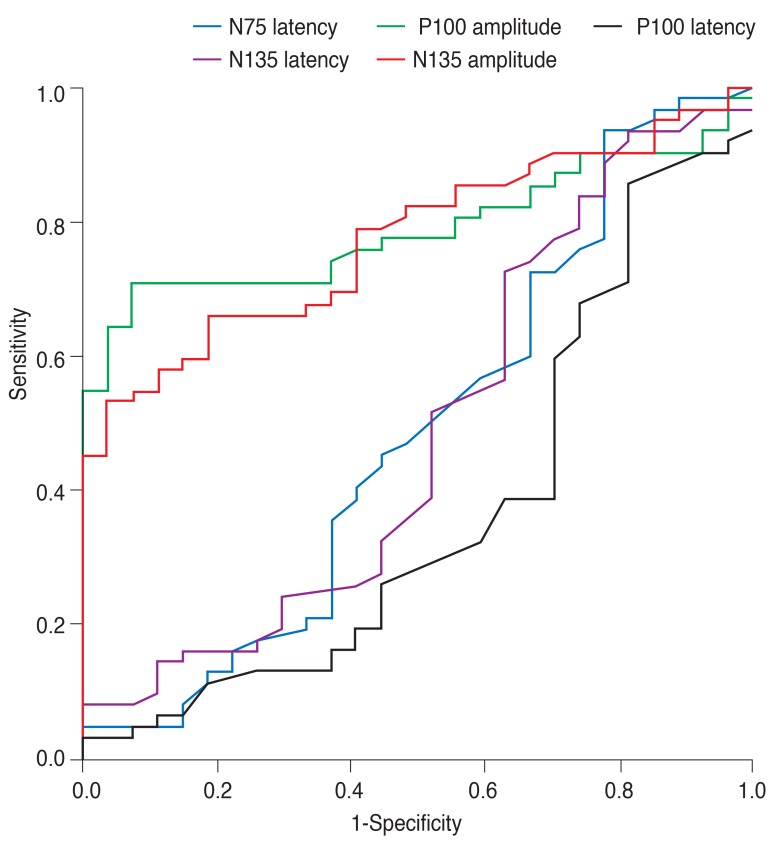
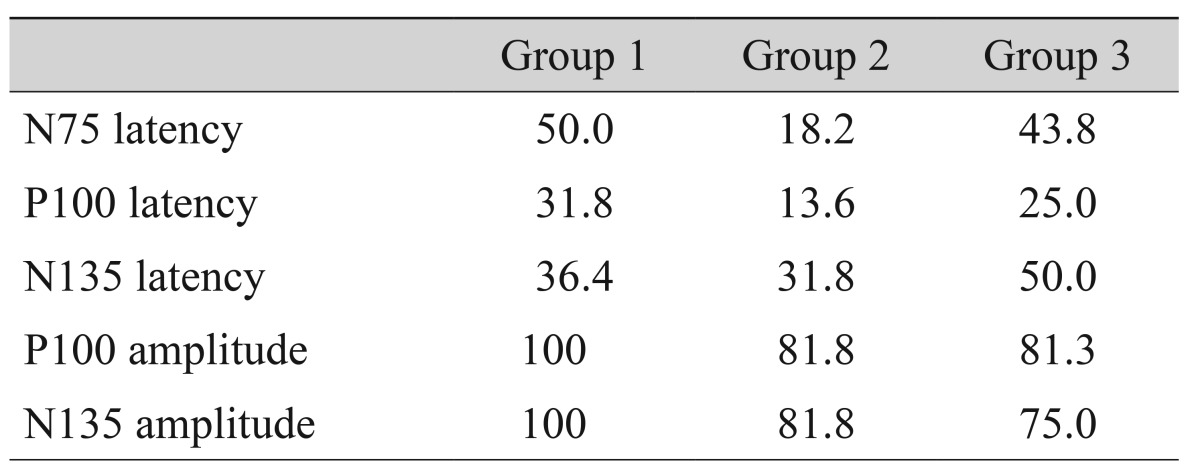
The P100 and N135 amplitudes were below the 95% CI for controls. The sensitivities of the 95% CI of the P100 amplitudes identifying group 1, 2, and 3 patients were 100%, 81.8%, 81.3%, and that of N135 amplitudes were 100%, 81.8%, and 75.0% respectively (Table 3). However, the latency of N75, P100, and N135 showed a low sensitivity to differentiate the severe visual loss patients from normal controls (Table 3). The area under the curve was highest for the P100 amplitude (P100 amplitude, 0.789; N135 amplitude, 0.775; N75 latency, 0.512; P100 latency, 0.629; N135 latency, 0.512) (Fig. 3).
When the noise level of the P100 amplitude was defined as lower than 3.0 µV, 14 out of 22 group 1 patients (63.6%), 12 out of 22 group 2 patients (54.5%) and 9 out of 16 group 3 patients (56.3%) had the noise level of P100 amplitude.
Go to :
Discussion
The present study documented that all of the patients with legal blindness (VA <0.02 using the Snellen VA chart) exhibited P100 amplitudes below the 95% CI of normal controls regardless of their disorders.
Several objective VA tests have been assessed for their usefulness in evaluating the visual function of patients. Hyon et al. [5] reported that the computerized optokinetic nystagmus (OKN) test could serve as an objective and reliable tool for assessing distance VA. The authors investigated two methods: the induction method, i.e., the smallest-size stripe that evoked the OKN response, and the suppression method, i.e., the smallest dot size that suppressed the OKN response. Of these two methods, the induction method was only feasible in patients for whom VA was expected to be 20 / 800 or worse. Sweep visual evoked potential (VEP) testing is another objective method for evaluating VA [6].
Sweep VEP is generally used to obtain objective VA [7]. Sweep VEP has less variability and better repeatability than steady state VEP or PVEP [8]. Although the repeatability and reliability of sweep VEP acuity are favorable attributes, the need to have the patient's attention and the greater effort required compared to pattern VEP are drawbacks; thus, the test for reliability and variability should be considered when evaluating the sweep VEP results of patients with severe low vision [7]. In addition, PVEP is easier and has a short recording time [8].
PVEPs have long been used as an objective test of VA [9]. We investigated the amplitudes of P100 and N135 and the latencies of N75, P100, and N135. The latencies of pattern VEP are more consistent between observers than amplitude, and as a result, the VEP latency is generally more reliable than the VEP amplitude for this purpose [10]. However, the amplitudes were more useful for differentiating severe visual loss patients in the present study. Disorders associated with delayed latency and decreased amplitude include multiple sclerosis, macular dystrophies, optic neuropathies, chorioretinitis, and so on [11].
Atilla et al. [12] reported that ischemic optic neuropathies have more significant decreases in VEP amplitude, whereas optic neuritis has more significant delayed latency. Although the amplitude and latency of pattern VEP depends on the disorder [13,14], the amplitude of severe visual loss patients was lower than the 95% CI of healthy controls, regardless of the disorder, in the present study.
The P100 and N135 amplitudes differ significantly among the groups, as seen in previous reports [1,9]. Therefore, the amplitude of not only P100 but also N135 may indirectly reflect VA. All subjects with legal blindness (group 1) exhibited amplitudes below the 95% CI of the normal control group (group 4). In other words, the probability of legal blindness is low if a patient's P100 amplitude is within the 95% CI of normal controls. Although the P100 amplitude was 100% sensitive for legal blindness, its specificity was low. This indicates that a low P100 or N135 amplitude does not directly reflect low VA; therefore, further evaluation of visual function is also needed.
Using area under the curve, although the correlation between the P100 and N135 amplitudes was very strong, the sensitivity of the N135 amplitude of legal blindness was slightly lower than that of the P100 amplitude; this is because the P100 response varies very little from person to person in comparison with the other responses of the pattern VEP [15]. Therefore, the P100 amplitude is more useful than the N135 amplitude for identifying legal blindness.
This study has some limitations. First, the study design was retrospective, and thus, the results of pattern VEP could be affected by causes of visual loss. Maculopathies may result in reductions in pattern VEP amplitude and prolongation of latency, even if VA was only slightly reduced [16]. However, there was no difference of causes across groups. Second, we could not exclude malingering patients who voluntarily decreased pattern VEP through poor accommodation and f ixation. To differentiate malingering cases, further evaluations including electrophysiological tests, retinal examinations and optical coherence tomography should be considered; repetitions of these exams would take place should there be any questionable results [17]. The present study did not include patients without reasonable abnormalities corresponding to visual loss to the extent possible. Finally, some severe visual loss patients did not show recordable waves. In the cases with no recordable waves, the amplitude and latency were defined by an experienced technician placing cursors at the highest and lowest points of the expected latency.
In conclusion, clinics should establish 95% CIs of the P100 amplitude from their individual data in order to evaluate the visual function of patients with legal blindness. No legally blind patient in the present study exhibited a value within the 95% CIs of the controls. Finally, P100 amplitude may be the best parameter to define blindness.
Go to :
 XML Download