

 PDF
PDF ePub
ePub Citation
 Print
Print


Normal-tension glaucoma (NTG) is diagnosed when the patient exhibits an excavated optic nerve head (ONH) and shows the visual field loss that is typical in glaucoma, but do not have elevation of the intraocular pressure (IOP) nor evidence of another cause of optic atrophy. In NTG patients, eyes with high IOP have more pronounced ONH damage and visual field loss than eyes with low IOP [1,2,3,4]. In contrast, NTG patients who have low IOP tend to have a much larger peripapillary atrophy area inferior to the ONH than NTG patients with high IOP [5]. Moreover, Kim et al. [6] found that the localized retinal nerve fiber layer defect was closer to the center of the macula in patients with an IOP below 15 mmHg than in patients with an IOP of between 16 and 21 mmHg. These findings provide indirect evidence that the mechanism of ONH damage differs between NTG patients with low IOP and those with high IOP.
There is growing evidence that the laminar region of the ONH is the principal site of the retinal ganglion cell axonal insult in glaucoma [7]. The structural differences in the lamina cribrosa (LC) are believed to be responsible for the different effects of IOP in the tissues and the LC of the ONH [8]. Several reports have suggested that spectral-domain (SD) optical coherence tomography (OCT) imaging of the human ONH can visualize the LC. The limited view of the posterior border of the LC, however, has made it difficult to study its structure and to measure its thickness [9,10]. Recently, a new OCT approach, known as enhanced depth imaging (EDI)-OCT, recently enabled comprehensive evaluation of the LC configuration [11].
It has also been suggested that IOP-independent factors are more deeply involved in the development and progression of in NTG than in primary open angle glaucoma (POAG). The occurrence of NTG led to efforts to discover causes of glaucoma other than IOP; ischemic insults, inflammation, reduced resistance to IOP, and hemodynamic factors were investigated as possible factors [12,13,14].
This study was conducted to compare the laminar thickness and vascular factors of early NTG patients with high and low IOP that are expected to be associated with the development of glaucoma.
Materials and Methods
The subjects of this cross-sectional study were 71 Korean NTG patients with low IOP (40 patients) and high IOP (31 patients). In cases where both eyes of the patient were eligible for this study, only one eye was randomly chosen for inclusion. The subjects were recruited from the Cheil Eye Hospital Glaucoma Clinic, Daegu, Korea, between February and June 2012. This study was approved by the Yeungnam University Hospital Institutional Review Board. All the subjects gave their written informed consent to participate in this study, and the tenets of the Declaration of Helsinki were adhered to in this study.
The subjects to be included in this study were required to have newly diagnosed NTG without previous treatment, a best-corrected visual acuity of ≥20 / 40, a spherical refraction within ±6.0 diopters, cylinder correction within ±3.0 diopters, and visual field loss with an mean deviation (MD) ≥-6 dB. Eyes with intraocular diseases or neurologic diseases that could cause visual field loss were excluded. Additionally, patients with an IOP fluctuation above and below 15 mmHg were excluded. Eyes were also excluded if they had a history of ocular surgery or if a good-quality image could not be taken.
NTG was defined according to the following criteria: a diurnal IOP of 21 mmHg or lower without any medication, glaucomatous optic neuropathy, a glaucomatous visual field defect, an open iridocorneal angle, and no neuroradiological evidence of a non-glaucomatous cause of optic nerve damage. A glaucomatous visual field defect was defined as a glaucoma hemifield test result outside the normal limits in at least two consecutive visual field tests or the presence of at least three contiguous test points within the same hemifield on the pattern deviation plot at p < 0.01, with at least one point at p < 0.005. The reliability indices of the visual field test results of eligible patients had to be better than 25%. The patients were divided into two groups according to the IOP level [5,6,15]. The highest IOP in the low IOP group was <15 mmHg and the lowest IOP in the high IOP group was >15 mmHg.
Before the study, each subject underwent comprehensive ophthalmic assessment that included slit-lamp biomicroscopy; measurement of the best-corrected visual acuity, diurnal IOP, and central corneal thickness; dilated stereoscopic examination of the ONH and fundus; color disc photography; red-free retinal nerve fiber layer photography; and visual field examination. The diurnal IOP was measured at 8:30 a.m., 10:30 a.m., 12:30 a.m., 2:30 p.m., 4:30 p.m., and 6:00 p.m., via Goldmann applanation tonometry. The central corneal thickness was measured using an ultrasonic pachymeter (SP-3000; Tomey Corporation, Nagoya, Japan). An average of five readings was made in each eye. Color disc photographs were taken using a fundus camera (CR-2; Canon Inc., Tokyo, Japan). Visual fields were evaluated with achromatic automated perimetry using the 24-2 Swedish Interactive Threshold Algorithm standard program (Humphrey Visual Field Analyzer II; Carl Zeiss-Meditec, Dublin, CA, USA). The prevalence of vascular factors, such as diabetes mellitus, systemic hypertension (HTN), migraine, the Raynaud phenomenon, and sleep apnea, was determined with a questionnaire during the history-taking.
Experienced ophthalmologists performed the EDI-OCT of the ONH using Heidelberg Spectralis (software ver. 5.3; Heidelberg Engineering, Heidelberg, Germany). The method described in a previous report was used [11]. Briefly, the OCT device was set to produce an image of a 15 × 10-degree rectangle for horizontal scans and of a 10 × 15-degree rectangle for vertical scans, centered on the optic disc. These rectangles were scanned with 65 sections, and each section had an average of 40 OCT frames. The position of the LC structures in the lower part of the screen was used to acquire high-quality images. A new upgraded version of the Heidelberg Spectralis program includes an EDI mode, which automatically places the OCT reference plane toward the bottom of the OCT acquisition screen. All subjects underwent EDI-OCT on the first day, a nd a n additional scan was conducted one month later. Three observers (TYL, JWL, and JHK) measured the LC thickness twice in each eye from the obtained EDI-OCT images. The mean of the six measurements was regarded as the LC thickness in each eye. We defined the thickness of the lamina cribrosa as the distance between the anterior and posterior borders of the highly reflective region in the horizontal EDI-OCT cross-sections of the ONH. The measurement of LC thickness was performed as centrally as possible where there was minimal effect of vascular shadows since thick retinal vessels cause shadows in the OCT cross-sectional images that prevent visualization of the structures underlying the vessels (Fig. 1).
Statistical analyses were performed using the PASW ver. 18.0 (SPSS Inc., Chicago, IL, USA). Independent Student's t-tests, chi-squared tests, and Fisher's exact tests were used to compare the data between the groups. To evaluate the intra- and inter-observer reproducibility of the measurement method that was used in this study, three examiners evaluated all the EDI-OCT images of the ONH and the intraclass correlation coefficient was calculated. Fleiss termed scores ≥0.75, between 0.40 a nd 0.75, a nd ≤0.4 as excellent, moderate, and poor, respectively [16]. The statistical significance level was set at p < 0.05.
Results
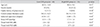
The mean age of the low IOP and high IOP groups was 60.0 ± 14.4 and 58.0 ± 9.4 years. Between the two groups, we found no significant differences in age (p = 0.57), gender (p = 0.92), family history of glaucoma (p = 0.54), or central corneal thickness (p = 0.91). The spherical equivalent was -0.14 ± 2.1 diopters in the low IOP group and -0.60 ± 1.72 diopters in the high IOP group, but there was no significant difference between the two groups. The mean IOP was significantly higher in the high IOP group (17.3 ± 1.4 mmHg) than in the low IOP group (12.3 ± 1.71 mmHg, p < 0.01). The visual field showed similar stage of glaucoma damage in the two groups in terms of MD and pattern standard deviation (PSD). The MD was -3.6 ± 2.2 dB in the low IOP group and -3.3 ± 2.1 in the high IOP group. The PSD was 3.7 ± 2.4 in the low IOP group and 3.7 ± 2.3 in the high IOP group (Table 1). The prevalence of self-reported Raynaud pheomenon was significantly higher in the low IOP group (33.0%) than the high IOP group (10.3%, p = 0.04). The prevalence of diabetes mellitus (5.0% vs. 12.9%, p = 0.34), HTN (32.5% vs. 16.1%, p = 0.13), migraine (7.5% vs. 9.6%, p = 1.00), and sleep apnea (7.5% vs. 0.0%, p = 0.55) did not differ significantly between low and high IOP groups. The mean thickness of the LC was 190.0 ± 19.2 µm in the low IOP group and 197.8 ± 23.6 µm in high IOP group, but there was no significant difference seen between two groups (Table 2). The LC measurement had excellent intra- and inter-observer reproducibility (Table 3).
Discussion
The laminar thickness in the early NTG patients was measured by imaging the ONH with EDI-OCT. The mean laminar thickness of the low IOP group (190.0 µm) was slightly thinner than that of the high IOP group (197.8 µm), but the difference was not significant.
Damage to retinal ganglion cell axons in the LC is the principal pathophysiology that underlies glaucomatous vision loss and ONH cupping [17,18]. The ONH is particularly interesting from a biomechanical perspective because it is a weak spot in an otherwise strong corneo-scleral envelope. The LC structurally and functionally supports the retinal ganglion cell axons as they pass from the high-pressure environment in the eye to a low-pressure region in the retrobulbar cerebrospinal space [19]. The structural change in the LC may deform the laminar pores. This process may subject the axons passing through the pores to extension, compressive, and shearing stress, which will result in the loss of the neuronal function of the axons. Moreover, the ONH is nourished by the short posterior ciliary arteries, which penetrate the immediate peripapillary sclera to feed the capillaries in the LC. The deformation and compression of the lamina may alter the blood supply and consequently, the nutrient delivery to the axons, which will also contribute to axonal injury [19,20,21].
The recent development of the SD-OCT and EDI techniques has enabled enhanced visualization of the lamina structures and measurement of the thickness of human eyes [9,11,22]. In a study by Inoue et al. [9], the LC in living human eyes was measured using three-dimensional SD-OCT. It revealed that the thickness could be correlated with the concurrently measured MD. Poor visualization of the deeper portion of the LC was believed to have been the primary limitation in the imaging and measurement of the LC using SD-OCT. Using the EDI technique in SD-OCT, the full-thickness LC was clearly visualized in all examined eyes [11]. Park et al. [23] found, using EDI-OCT, that the lamina was thinner in NTG patients than in POAG patients and thinner in NTG patients with disc hemorrhage than in NTG patients without disc hemorrhage. Among Korean patients, the mean laminar thickness in early NTG patients was 192 µm, and the measured mean laminar thickness of Japanese early glaucoma patients was 198 µm [9,23]. These findings are very similar to those of this study. Moreover, other studies regarding early POAG patients reported a central laminar thickness of 219 to 277 µm [11,23], which is thicker than that in the early NTG patients in this study. This result indicates that the thinner lamina may more easily lead to deformation of the lamina and a block in axonal transport, even at a normal IOP.
Many previous studies that focused on the pathogenesis of glaucomatous optic neuropathy in NTG patients were conducted from the perspectives of various vascular theories as well as IOP-related mechanical theories, including of LC [24,25,26]. Raynaud phenomenon and migraine are considered manifestations of primary vascular dysregulation syndrome, which causes unstable ocular perfusion and reperfusion injury [27]. In addition, sleep apnea causes glaucoma due to decreased ocular blood flow [28]. Accordingly, the low IOP group had a significantly higher prevalence of Raynaud phenomenon in this study. However, other vascular factors were not related to development of NTG in the low IOP group.
This study had a few limitations. First, the sample size was small. Second, the prevalence of vascular risk factors was assessed on the basis of the questionnaire data, which might have had limited reliability and accuracy because of their reliance on patient recall.
In conclusion, the laminar thickness did not significantly differ between the high and low IOP groups. However, the prevalence of Raynaud phenomenon was higher in low IOP groups. These results suggest that the development of glaucoma with low IOP patients may be more influenced by peripheral vasospasm, such as Raynaud phenomenon, rather than laminar thickness in NTG.


 XML Download