

 PDF
PDF ePub
ePub Citation
 Print
Print


Open-angle glaucoma often presents bilaterally, although there is commonly asymmetry in the onset of glaucoma or severity of damage between the eyes [1]. Asymmetric damage was present in half of open-angle glaucoma patients in the Blue Mountains Eye Study [1]. Inter-ocular asymmetry at the onset of open-angle glaucoma may offer the opportunity to more effectively target standard automated perimetry if the regions of visual field loss are concordant between the eyes. That is, if there is an increased likelihood of the same region being affected in both eyes, then greater emphasis could be placed on monitoring that region for detection of deterioration in the less affected eye by adjusting the test pattern. This could increase the sensitivity of detecting visual field deterioration in the less damaged eye. Concordance of defective visual field locations between eyes has been recognized in primary open angle glaucoma [2]. In patients with bilateral open-angle glaucoma, a statistically and clinically significant correlation of visual field loss between the eyes of an individual has been demonstrated [3,4].
Visual field defects in glaucoma follow the spatial distribution of the nerve fiber layer, resulting in a range of patterns of loss such as nasal steps and paracentral, arcuate, and temporal wedge scotomas [5]. If the region of visual field loss is dictated by anatomical features that are bilaterally symmetric and have similar underlying etiologies, then one may hypothesize that there would be concordance in the region of visual field loss between eyes even though the two eyes might be at different stages of disease. The purpose of this study is to examine the prevalence of visual field deterioration in the contralateral eye of patients with open-angle glaucoma and to evaluate the spatial concordance of visual field deterioration by clustering the visual field test locations based on the anatomy of the retinal nerve fiber layer.
Materials and Methods
Patients and visual field data
The visual field data analyzed in the current study were retrieved from the records of glaucoma patients treated at the Jules Stein Eye Institute, University of California, Los Angeles (UCLA), between 1984 and 2011 and from data collected during the Advanced Glaucoma Intervention Study (AGIS). The AGIS design and methods are described in detail elsewhere [6,7]. All patients who had 6 or more years of follow-up and who underwent 8 or more visual field examinations were included. We included open-angle glaucoma patients who had been followed with the Humphrey Field Analyzer (Carl Zeiss Meditec, Dublin, CA, USA) with the 24-2 test pattern, a Goldmann size III target, and full-threshold or the Swedish interactive threshold algorithm standard. Unreliable visual fields, consisting of eyes with 15% or more fixation losses or 15% or more false-positive errors, were discarded. Tests with high frequencies of false-negative error were not excluded, since a high number of false-negative errors is associated with visual field damage more strongly than with patient reliability [8]. The baseline visual field mean deviation (MD) was required to be ≤-15 dB to exclude end stage glaucoma patients in which progression and analysis of concordance may not be possible. In order to investigate the relationship between visual field defect severity and spatial concordance, we divided the patients into three groups based on the baseline MD values; mild, MD better than -6 dB in both eyes; moderate, MD between -6 and -12 dB in both eyes; and severe, MD worse than -12 dB in both eyes. When a patient's left eye and right eye each belonged to different groups, we determined that the patient lacked similarity of visual field defect severity and excluded that patient's case from this research. This study was approved by the institutional review board of the UCLA and was performed in accordance with the tenets set forth in the Declaration of Helsinki and complied with Health Insurance Portability and Accountability Act regulations.
Rates of visual field decay and modified glaucoma hemifield test clusters
The methods for calculating rates of decay are described in detail elsewhere [9]. We performed regression analysis of the threshold sensitivity (in dB) against time at each visual field test location with a point-wise exponential regression (PER) model [9]. The relationship between the response variable (threshold sensitivity) and the explanatory variable (time of follow-up) was characterized by the equation y = ea + bx, that is, logey = a + bx. The rate of change was represented by the coefficient b, which is the average annual rate of change in logey. The quantity eb is interpreted as the residual y at each time interval. The rate of decay is defined as (1 - eb). To facilitate clinical understanding of the magnitude of the rates, the rates of decay derived from exponential regression were converted into %/year deterioration rates, where rate of decay (%/year) = (1-eb)(100). Thus, we measured the proportion of loss of visual sensitivity remaining.
The rates of decay for each test location measured with the PER model were plotted as a frequency distribution. To define the fast and slow components of deterioration in each visual field series, after excluding locations corresponding to the blind spot, the 52 visual field test locations were ranked according to the rate of decay and clustered into two subgroups (fast and slow components) based on the p-value for the difference in rates. For each partition, we computed a t-test statistic, and the corresponding p-values were adjusted for multiple testing. The Benjamini-Hochberg correction was used to find the optimal p-value to maximize the difference between the fast and slow component subgroups [10]. Each subgroup consisted of at least five test locations. The rate of decay (%/year) was also determined for the visual field series of each eye by taking the mean individual decay rates for each of the 52 test locations analyzed. The fast and slow components are the means of the rates for all points in each of these clusters.
Estimation of spatial concordance
1) Calculation of concordance ratio
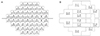
Each matching visual field location for the left and right eyes was examined to determine if that particular location belonged to the fast component in both eyes (overlapping defects [A]), if that location demonstrated a fast decay rate only in one eye (non-overlapping defects; the left eye [B], the right eye [C]), or if that location belonged to the slow component in both eyes. The amount of overlap of the test locations belonging to the fast component between the right and left eyes was calculated as the ratio of overlapping fast components to the total number of test locations belonging to the fast components. Thus, a concordance ratio can be expressed as the following relationship: concordance ratio = 2A / {(A + B) + (A + C)}. A concordance ratio of '1' refers to a case of visual field loss where the rate components of both eyes match 100%, whereas a concordance ratio of '0' refers to a situation where the rate components of visual field loss in the two eyes are entirely independent of each other. Fig. 1 shows as chematic of the method for calculating the concordance ratio. Defect size was defined as the total number of fast component locations of both eyes used to calculate the concordance ratio [2].
2) Calculation of average rates of decay in modified glaucoma hemifield test clusters
The 52 visual field test locations were divided into 12 modified glaucoma hemifield test (GHT) clusters [5]. As reported by Asman and Heijl [5], the visual field was partitioned into 10 sectors corresponding to normal retinal nerve fiber layer anatomy. There are five clusters in the superior hemifield and five mirror-image sectors in the inferior hemifield. Two additional clusters were added just superior and inferior to the blind spot, labeled clusters 11 and 12. We calculated the mean rate of decay of each cluster by averaging the rates of decay of all test locations within the cluster. Cluster deterioration was defined as an average rate of decay ≥10%/year. An eye was considered to be worsening clinically if at least one out of the 12 modified GHT clusters demonstrated deterioration as defined above. Analysis of variance with a Bonferroni's post hoc correction was used for comparisons of continuous variables among subgroups. In order to identify the spatial concordance of visual field deterioration between both eyes of the same patient, the average rates of decay for each cluster were compared with the Wilcoxon signed-rank test. All statistical analyses were carried out in the open programming language, R [11].
Results
Patients and visual field data
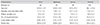
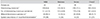
A total of 201 patients were initially included. The average of all visual field MD (± standard deviation [SD]) was -8.5 (±6.4) dB. The mean number of reliable visual fields was 15.8 (±5.5), and the mean follow-up was 9.0 (±1.6) years. Eighty-five patients were excluded because the baseline MD in the contralateral eyes was not similar. The false negative errors of all subjects were less than 15%. Table 1 provides the characteristics for the study sample as a function of glaucoma severity.
Evaluation of spatial concordance of visual field deterioration
1) Concordance ratio
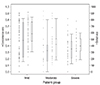
Fig. 2 shows the relationship between the severity group, concordance ratio, and defect size. The concordance ratio (±SD) for the entire group was 0.42 (±0.28).The mean concordance ratio was 0.46 (±0.32) for the mild group, 0.33 (±0.27) for the moderate group, and 0.35 (±0.21) for the severe group. The mean defect size for the entire group was 50.6 (±22.1). The mean defect size was 58.8 (±21.6) for the mild group, 42.0 (±22.3) for the moderate group, and 40.0 (±15.2) for the severe glaucoma group.
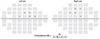
The diagram on the left side of Fig. 3 shows the frequency of belonging to the fast component at each test location. The number of test locations belonging to the fast component was 2,974 (50.6%) and 2,898 (49.4%) in the superior and inferior hemifields, respectively (p = 0.049).
2) Average rates of decay in the modified glaucoma hemifield test clusters
The diagram on the right side of Fig. 3 shows the frequency of clusters demonstrating deterioration as defined in Materials and Methods section for 12 modified GHT clusters in 232 eyes of 116 patients. A total of 502 deteriorating clusters (18%) were detected. The average (±SD) number of deteriorating clusters per patient was 4.3 (±4.6). Ninety (78%) of 116 patients had deterioration of the visual field in one or both eyes. Bilateral visual field deterioration occurred in 60 (52%) of the 116 patients. Thirty-one patients showed a cluster deterioration with p < 0.05 in the concordant clusters of both eyes. Table 2 compares the frequency of belonging to the fast component for individual test locations and worsening frequency in modified GHT clusters. The mean number of deteriorating clusters and patients with bilateral deterioration increased significantly as the disease severity increased as categorized based on the baseline MD. The diagram on the right side of Fig. 3 shows the frequency distribution for cluster worsening across the visual field (defined as average rate of decay ≥10%/year for a cluster). The number of deteriorating clusters for the superior and inferior hemifields was 298 (59.4%) and 204 (40.6%), respectively (p = 0.035).
Discussion
The present study determined the incidence of visual field progression at individual test locations with the PER method and examined the spatial concordance of visual field deterioration within modified GHT clusters in contralateral eyes of glaucoma patients. Previous studies explored unilateral and bilateral visual field progression in glaucoma with various definitions and methods for detection of deterioration [2,3,4]. Methods that have been used for detection of visual field progression include global and regional event analyses such as the glaucoma change probability analysis [12,13], univariate linear regression analysis of individual test locations [14,15,16], clusters of test locations [15,17], visual field indices [18], and multivariate regression analyses [15,19]. Different techniques for detection of glaucoma deterioration have emerged due to the complexity of establishing disease deterioration in the presence of long-term fluctuation. Serial visual field measurements can be highly variable, especially in damaged areas of the visual field [20,21,22,23]. PER analysis has recently been reported to measure rates of perimetric decay over a long period of follow-up [9,24].
With the AGIS scoring system, Spry et al. [25] documented that 18% of patients had visual field progression after a mean of 4 years of follow-up. Other studies with longer follow-up periods have demonstrated visual field progression in 27% to 76% of patient cohorts with various definitions and criteria for progression [2,3,4]. Bilateral progression is not uncommon, and a study by Chen [4] demonstrated that, with modified Anderson's criteria for progression, bilateral progression occurs more commonly in open angle glaucoma patients than predicted if progression is assumed to be random. During a mean follow-up of 7.5 years, 54 (36%) of 152 patients showed some form of progression and 24 (16%) out of 152 glaucoma patients had bilateral progression [4]. In a group of 116 patients with a mean follow-up of 8.9 years, we found a higher prevalence of overall deterioration in one or both eyes (78%), of which 52% showed bilateral deterioration.
Few studies have looked at the spatial characteristics and concordance of visual field deterioration. Pascual et al. [26] demonstrated progression occurring in visual field locations corresponding to the retinal nerve fiber layer bundles in 200 eyes of 200 patients with Monte Carlo simulation analysis. This spatial relationship was more clearly established for eyes with superior defects as compared to those with inferior defects. Our study found a significantly higher proportion of visual field deterioration in the superior hemifield compared to the inferior hemifield with both methods used, i.e., the concordance ratio and the modified GHT cluster analysis.
Boden et al. [2] identified inter-eye concordance of visual field defects in patients with primary open-angle glaucoma.. Our study did not focus on cross-sectional defects, but the goal was to determine whether deterioration over time occurred at concordant locations during long-term follow-up. With PER analysis, 60 (52%) of 116 patients had well-substantiated bilateral deterioration. Worsening occurred in concordant locations in only 31of these patients(27%, p < 0.05). Concordant bilateral deterioration may merely reflect widespread glaucomatous deterioration, as those with concordant worsening had a higher number of clusters with deterioration compared to those with non-concordant bilateral deterioration. These worsening defects were evenly distributed between the modified GHT clusters. This suggests that visual field algorithms cannot assume that the region of deterioration in one eye would accurately predict the topography of early deterioration in the fellow eye.
As the severe group already showed considerable visual field loss compared to the mild group, it could be predicted that the severe group would show considerable spatial concordance of visual field deterioration between fellow eyes. The number of clusters showing bilateral deterioration increased as the severity of glaucoma grew, and this trend was statistically significant. However, despite a higher proportion of eyes with cluster deterioration in eyes with more advanced glaucoma, the concordance ratio was actually lower in eyes with more severe glaucoma.
There are several limitations in our study. One is that, in examining visual field deterioration in the two eyes of a patient, we were not able to explore temporal differences in visual field deterioration between the two eyes. Visual field deterioration is characterized by deepening and expansion of visual field defects [27,28]. This process may occur in both eyes simultaneously, but the spatial concordance could be low if visual field deterioration occurred during different time periods. In order to reduce the bias generated from this time lag, we divided patients into different severity groups based on the visual field MD. Patients with different visual field loss severity in the two eyes at baseline were excluded from analysis. In order to overcome this limitation, a study with even longer follow-up is required. Second, we had thought that the concordance ratio of the different groups would be similar in each group, while the more severe group would exhibit a higher concordance ratio. However, the results showed a lower concordance ratio in advanced glaucoma patients. We think this may be because the different patient groups are discordant in size, and the number of patients was too small. Third, if the patient has eyes with varying severity of visual field deterioration, that patient is likely to be categorized as a non-concordant type, because the region of deterioration could be different between the eyes. To prevent this problem, we excluded patients with eyes with varying severity, and this is indeed a limitation of this study.
The average concordance ratio for test locations was 42% in our study. Twenty-seven percent of patients showed spatial concordance with regard to cluster deterioration when we used an average rate of decay ≥10% to define worsening within a cluster with PER.
In conclusion, our study reports the prevalence of visual field deterioration in the contralateral eye of patients with open-angle glaucoma and the spatial concordance of visual field deterioration with the PER method. We found that the rate of decay in the superior hemifield was faster than that of the inferior hemifield and that there is only fair spatial concordance for visual field deterioration between the eyes of an individual. Based on this and all information currently available, it would appear that testing algorithms that might take advantage of spatial concordance would not be particularly useful for the early detection of glaucomatous progression.
 XML Download