Abstract
Purpose
To evaluate patterns of macular retinal ganglion cell (RGC) loss measured by spectral domain optical coherence tomography in patients with neurologic lesions mimicking glaucoma.
Methods
We evaluated four patients with neurological lesions who showed characteristic patterns of RGC loss, as determined by ganglion cell thickness (GCT) mapping.
Results
Case 1 was a 30-year-old man who had been treated with glaucoma medication. A left homonymous vertical pattern of RGC loss was observed in his GCT map and a past brain magnetic resonance imaging (MRI) revealed a hemorrhagic lesion around the right optic radiation. Case 2 was a 72-year-old man with a pituitary adenoma who had a binasal vertical pattern of RGC loss that corresponded with bitemporal hemianopsia. Case 3 was a 77-year-old man treated for suspected glaucoma. His GCT map showed a right inferior quadratic pattern of loss, indicating a right superior homonymous quadranopsia in his visual field (VF). His brain MRI revealed a left posterior cerebral artery territory infarct. Case 4 was a 38-year-old woman with an unreliable VF who was referred for suspected glaucoma. Her GCT map revealed a left homonymous vertical pattern of RGC loss, which may have been related to a previous head trauma.
Conclusions
Evaluation of the patterns of macular RGC loss may be helpful in the differential diagnosis of RGC-related diseases, including glaucoma and neurologic lesions. When a patient's VF is unavailable, this method may be an effective tool for diagnosing and monitoring transneuronal retrograde degeneration-related structural changes.
Transneuronal retrograde degeneration (TRD) of retinal ganglion cells (RGCs) has been reported to induce retinal nerve fiber layer (RNFL) loss [1,2,3]. RNFL loss eventually causes neuroretinal rim thinning of the optic disc. Glaucoma is one example of an optic neuropathy, and is characterized by progressive loss of RGCs, reduction of RNFL thickness, thinning of the neuroretinal rim, and increased excavation of the optic disc. Although the underlying pathology mechanisms are completely different, the eventual loss of RGCs and the RNFL may make it difficult to differentiate between the distinct pathologies of TRD and glaucoma. Clinical clues, such as rim pallor, which is more common in TRD cases, or signs specific to glaucoma (e.g., optic disc hemorrhage), may help discriminate between these two pathologies. However, when these signs are absent, it is often difficult to make a specific diagnosis by only observing the optic disc.
Optical coherence tomography (OCT) is a device used to image the posterior pole of the eye. RNFL thickness is measured by OCT and is widely used for the assessment of glaucomatous structural changes as well as for evaluation of the neuro-ophthalmologic area [4,5,6,7,8]. With improved image resolution provided by spectral domain (SD) OCT, evaluation of segmented inner retinal layer thickness, which targets RGC thickness, has become commercially available [9,10,11]. Ganglion cell thickness (GCT), which includes measurement of the ganglion cell layer and the inner plexiform layer, has showed promise for the detection of glaucoma and the detection of glaucoma progression [9,12].
More than 50% of RGCs are located in the inner area of the macula, which consists of several layers. Measurement of GCT in the macular area is being used in clinical practice as well as in research [13,14,15,16]. Nasal-sided RGC axons in the optic nerve cross at the optic chiasm and join with temporal-sided RGC axons of the contralateral eye at the post-chiasmal area; these become the optic track of the contralateral side, which radiates to the lateral geniculate body, the optic radiation, and the visual cortex. Temporal-sided RGC axons in the optic nerve become the optic track of the ipsilateral side after joining with nasal-sided RGC axons of the contralateral eye. Therefore, chiasmal and post-chiasmal lesions manifest as a visual field (VF) defect with respect to the vertical meridian, which is helpful for differentiation between brain lesions and glaucoma. Glaucomatous VF defects manifest with respect to the horizontal meridian. Considering this anatomical characteristic of axonal distribution, we hypothesized that the pattern of RGC loss in the macula may also exhibit these characteristics. Hence, we analyzed a GCT map using SD-OCT and explored the pattern of RGC loss in eyes with chiasmal and post-chiasmal lesions. To the best of our knowledge, this is the first study to investigate the pattern of RGC loss in neurologic lesions.
Four representative cases were retrospectively selected among patients who were examined at the glaucoma clinic of the Asan Medical Center. Patients were either referred from the neurology/neurosurgery department of the same hospital, or from their local eye clinic for an ocular examination. Every patient received a complete ophthalmologic examination that included recording of medical, ocular, and family histories, visual acuity testing with the Humphrey Field Analyzer and the 24-2 or 30-2 Swedish interactive threshold algorithm (Carl Zeiss Meditec, Jena, Germany), intraocular pressure measurements using Goldmann applanation tonometry, stereoscopic optic disc photography, and central corneal thickness (DGH-1000 ultrasonic pachymetry; DGH Technology, Exton, PA, USA). Brain magnetic resonance imaging (MRI) was performed either in the ophthalmologic or the neurologic/neurosurgery department.
SD-OCT images were obtained using the Cirrus HD-OCT system (software ver. 6.0.2.81; Carl Zeiss Meditec). The image acquisition procedure that we employed has been described in detail in previous publications [6,17]. We measured peripapillary (p) RNFL thicknesses with the optic disc cube mode, and GCT was measured with the macular cube mode. Optic disc cube data were obtained from a 3-dimensional dataset composed of 200 A-scans derived from 200 B-scans that covered a 6 × 6 mm area centered on the optic disc. After the creation of an RNFL thickness map from the cube dataset, the software automatically determined the center of the disc and extracted a circumpapillary circle (1.73 mm radius) from the dataset to perform pRNFL thickness measurements. Macular cube data were obtained from a 3-dimensional dataset composed of 512 A-scans derived from 128 B-scans that covered a 6 × 6 mm area centered on the fovea. Pupil dilatation was performed on all eyes.
The area where GCT was measured included a layer from the outer boundary of the RNFL to the outer boundary of the inner plexiform layer. Hence, GCT was determined from a combination of the RGC layer and the inner plexiform layer. In our present analysis, pRNFL thickness and GCT maps were reviewed, along with deviation maps referenced to a normative database provided by the manufacturer. Each pixel in the deviation was coded in yellow or red for either the pRNFL thickness or the GCT deviation map if the measurement was below the lower 95% ("borderline") or above the 99% ("outside normal limits") of the centile ranges for that particular pixel (Fig. 1). All accepted images 1) showed either a centered optic disc or a fovea, 2) were well-focused with even and adequate illumination, 3) exhibited no eye motion within the measurement circle, and 4) had a signal strength ≥7.
The study was approved by the institutional review board of Asan Medical Center and the tenets of the Declaration of Helsinki were followed.
A 30-year-old man was referred from his local eye clinic with suspected glaucoma. He had been treated with topical prostaglandin analogs for approximately one year. The patient began experiencing ocular complications from his glaucoma medications, so he was seeking a new treatment and was therefore referred to our clinic. His optic disc had increased cupping and the SD-OCT pRNFL thickness map revealed thinning in both of his eyes, most prominently in his superior and inferior quadrants with an average thickness of 73 and 74 µm in the right and left eyes, respectively (Fig. 2A and 2B). However, his VF was not compatible with a glaucomatous defect. Since his VF revealed the possibility of a left homonymous hemianopsia (Fig. 2C), and since he had suffered a head trauma several years previously, we reviewed his past MRI results. His macular GCT map showed a left homonymous vertical pattern of loss (Fig. 2D). His past brain MRI (coronal fast spin echo image) showed a hemorrhagic lesion around the right optic radiation (Fig. 2E).
A 72-year-old man was referred from the neurosurgery department for a preoperative ocular exam. He reported a reduction in his VF six months prior. His brain MRI (sagittal gadolinium enhanced image) revealed a pituitary adenoma (Fig. 3A) displacing the pituitary stalk (arrow) and the parenchyma to right side, and compression of the optic chiasm (arrowheads) on a T1-weighted gadolinium enhanced image of the coronal section (Fig. 3B). His left optic nerve looked more compressed than the right (arrows) on a T2-weighted coronal image (Fig. 3C).The patient's VF revealed a bitemporal hemianopsia (Fig. 3D) and an SD-OCT-based GCT map revealed a nasal vertical pattern of loss in the right eye, whereas the left eye had a more generalized pattern of loss, which was more severe at the nasal half and had a relatively preserved inferotemporal sector (Fig. 3E).
A 77-year-old man was referred from his local clinic for an ocular exam and brain imaging. He had been treated for cataracts, suspected glaucoma, and dry eye for several years. He recently complained of deterioration of his visual acuity, although the clinician at his local clinic could not detect any changes during ocular examination. His VF was tested at his local clinic, but the results were unreliable. His optic disc showed increased cupping and the OCT pRNFL thickness map showed thinning, most prominently in the inferior quadrant, with an average thickness of 69 and 77 µm in the right and left eyes, respectively (Fig. 4A and 4B). Examination of his VF was repeated at our clinic and revealed a right superior homonymous quadranopsia (Fig. 4C). His GCT deviation map showed a right inferior quadratic pattern of loss (Fig. 4D). His brain MRI (axial fluid-attenuated inversion recovery image) revealed a left posterior cerebral artery territory infarct (Fig. 4E).
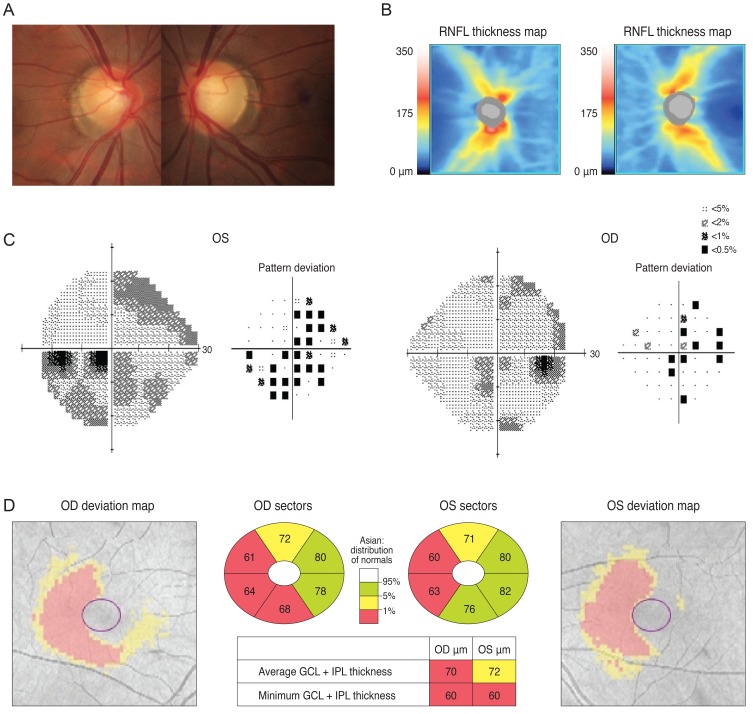
A 38-year-old woman was referred from her local clinic because her clinician was unable to determine if she had glaucoma. Ten years prior, she suffered a head trauma and her past MRI results showed multiple areas of atrophy. After her head trauma, she reported having minor difficulty in performing normal daily activities, including reading and verbal communication. She exhibited a mild degree of visual disturbance (corrected visual acuity; 20 / 30 in both eyes). Her optic disc showed mild cupping and cup to disc ratio asymmetry and an OCT revealed reduced RNFL thickness with an average thickness of 72 and 77 µm in the right and left eyes, respectively (Fig. 5A and 5B). Because she had difficulty with VF-related tasks, assessment of her VF was unreliable despite repeated exams (Fig. 5C). Her GCT map revealed a left homonymous vertical pattern of loss (Fig. 5D).
Our current case series indicates that both chiasmal and post-chiasmal lesions related to the visual pathway show characteristic patterns of RGC loss in the macular area. Similar to VF defects, the patterns of RGC loss were variable according to the location of the pathologic lesion. As demonstrated by case 2, a pituitary adenoma that compressed the optic chiasm coincided with aloss of nasal-sided RGCs in the macula with respect to the vertical meridian in both eyes. This structural abnormality corresponded to a bitemporal hemianopsia in the patient's VF. Post chiasmal lesions revealed a homonymous vertical pattern of RGC loss, which was present in cases 1, 3, and 4. Cases 1 and 4 showed a vertical hemi-defect of RGC loss, while case 3 showed an inferior quadrantic-defect of RGC loss. Considering that the inferior portion of RGC loss was more prominent than the superior portion in case 3, the inferior portions of the optic radiation and the visual cortex seemed to be more severely damaged as a result of the posterior cerebral artery territory infarct. This right inferior quadratic defect of RGC loss in the macula corresponded well with the right superior homonymous quadranopsia seen in the patient's VF.
Although it is well documented that nasal-sided axons of the optic nerve cross at the optic chiasm and become the optic tract of the contralateral side by combining with the temporal-sided axons from the contralateral eye, the topographic relationship between RGCs in the macular area and their accompanying axons has not been evaluated. Our current cases showed that axons of nasal-sided RGCs in the macula became the nasal part of the optic nerve and that the axons of temporal-sided RGCs in the macula became the temporal part of the optic nerve. This straightforward topographic relationship between the RGCs in the macula and the remaining visual pathway may be helpful for differential diagnoses of various pathologies. For instance, glaucomatous eyes typically show patterns of RGC loss with respect to the horizontal meridian (Fig. 1). Because the loss of RGCs often accompanies a reduction in RNFL thickness, careful observation of a patient's RNFL thickness map may provide some clues for diagnosis of TRD [3]. However, since the RNFL distributes 360° in a circular manner from the optic nerve head, direct evaluation of the pattern of RGC loss in the macula may be a more convenient and accurate way of assessing TRD.
Identifying the pattern of RGC loss may be especially helpful in cases where the patient's VF cannot be evaluated or where test results are unreliable or too subtle, as was observed in cases 1, 3 and 4. Although VF changes with respect to the vertical meridian strongly suggest neurologic lesions, subtle changes may sometimes go undetected. In case 1, previous VF results were atypical and the patient was treated with glaucoma medications for some time. Our repeated VF analyses revealed the possibility of a mild homonymous vertical defect. In some patients with brain damage, assessing the VF alone is difficult. In case 4, the patient showed variable and unreliable VF defect patterns and differential diagnosis was difficult. In such cases, assessment of the pattern of RGC loss can be a good diagnostic strategy.
In summary, our present case series demonstrates that several patterns of RGC loss in the macular area correspond with VF defects in chiasmal and post-chiasmal lesions. Careful observations of macular RGC thickness may be a useful indicator of potential TRD-associated damage. This diagnostic modality may be useful for differential diagnosis of RGC-related diseases, such as TRD and glaucoma. Additionally when a patient's VF is unavailable or unreliable, this may be an effective method for diagnosing and monitoring TRD-related structural changes.
References
1. Jindahra P, Petrie A, Plant GT. Retrograde trans-synaptic retinal ganglion cell loss identified by optical coherence tomography. Brain. 2009; 132(Pt 3):628–634. PMID: 19224900.

2. Mehta JS, Plant GT. Optical coherence tomography (OCT) findings in congenital/long-standing homonymous hemianopia. Am J Ophthalmol. 2005; 140:727–729. PMID: 16226527.

3. Park HY, Park YG, Cho AH, Park CK. Transneuronal retrograde degeneration of the retinal ganglion cells in patients with cerebral infarction. Ophthalmology. 2013; 120:1292–1299. PMID: 23395544.

4. Fernandes DB, Raza AS, Nogueira RG, et al. Evaluation of inner retinal layers in patients with multiple sclerosis or neuromyelitis optica using optical coherence tomography. Ophthalmology. 2013; 120:387–394. PMID: 23084127.

5. Sarac O, Tasci YY, Gurdal C, Can I. Differentiation of optic disc edema from optic nerve head drusen with spectral-domain optical coherence tomography. J Neuroophthalmol. 2012; 32:207–211. PMID: 22473041.

6. Sung KR, Sun JH, Na JH, et al. Progression detection capability of macular thickness in advanced glaucomatous eyes. Ophthalmology. 2012; 119:308–313. PMID: 22182800.

7. Hein K, Gadjanski I, Kretzschmar B, et al. An optical coherence tomography study on degeneration of retinal nerve fiber layer in rats with autoimmune optic neuritis. Invest Ophthalmol Vis Sci. 2012; 53:157–163. PMID: 22131393.

8. Na JH, Sung KR, Lee JR, et al. Detection of glaucomatous progression by spectral-domain optical coherence tomography. Ophthalmology. 2013; 120:1388–1395. PMID: 23474248.

9. Mwanza JC, Oakley JD, Budenz DL, et al. Macular ganglion cell-inner plexiform layer: automated detection and thickness reproducibility with spectral domain-optical coherence tomography in glaucoma. Invest Ophthalmol Vis Sci. 2011; 52:8323–8329. PMID: 21917932.

10. Cho JW, Sung KR, Lee S, et al. Relationship between visual field sensitivity and macular ganglion cell complex thickness as measured by spectral-domain optical coherence tomography. Invest Ophthalmol Vis Sci. 2010; 51:6401–6407. PMID: 20631238.

11. Seong M, Sung KR, Choi EH, et al. Macular and peripapillary retinal nerve fiber layer measurements by spectral domain optical coherence tomography in normal-tension glaucoma. Invest Ophthalmol Vis Sci. 2010; 51:1446–1452. PMID: 19834029.

12. Na JH, Sung KR, Baek S, et al. Detection of glaucoma progression by assessment of segmented macular thickness data obtained using spectral domain optical coherence tomography. Invest Ophthalmol Vis Sci. 2012; 53:3817–3826. PMID: 22562510.

13. Zeimer R, Asrani S, Zou S, et al. Quantitative detection of glaucomatous damage at the posterior pole by retinal thickness mapping: a pilot study. Ophthalmology. 1998; 105:224–231. PMID: 9479279.
14. Ishikawa H, Stein DM, Wollstein G, et al. Macular segmentation with optical coherence tomography. Invest Ophthalmol Vis Sci. 2005; 46:2012–2017. PMID: 15914617.

15. Um TW, Sung KR, Wollstein G, et al. Asymmetry in hemifield macular thickness as an early indicator of glaucomatous change. Invest Ophthalmol Vis Sci. 2012; 53:1139–1144. PMID: 22247461.

16. Sung KR, Wollstein G, Kim NR, et al. Macular assessment using optical coherence tomography for glaucoma diagnosis. Br J Ophthalmol. 2012; 96:1452–1455. PMID: 23018425.
17. Sung KR, Kim DY, Park SB, Kook MS. Comparison of retinal nerve fiber layer thickness measured by Cirrus HD and Stratus optical coherence tomography. Ophthalmology. 2009; 116:1264–1270. PMID: 19427696.

Fig. 1
Peripapillary retinal nerve fiber layer (RNFL) thickness (A) and ganglion cell thickness (GCT) (B) deviation maps with reference to a normative database were provided by spectral domain optical coherence tomography. GCT was defined as the layer from the outer boundary of the RNFL to the outer boundary of the inner plexiform layer. Each pixel in the deviation was coded in yellow or red for either the GCT or RNFL thickness deviation map if the measurement was below the lower 95% ("borderline") or above the 99% ("outside normal limits") centile range for that particular pixel. The GCT map shown here (B) has the typical arcuate shape defect observed in glaucoma. OD = right eye; OS = left eye; TEMP = temporal; SUP = superior; NAS = nasal; INF = inferior; GCL = ganglion cell layer; IPL = inner plexiform layer.
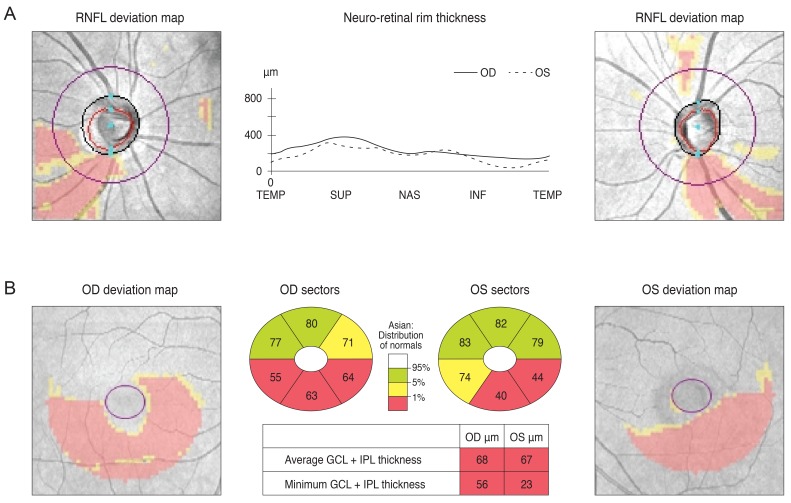
Fig. 2
The optic disc of a 30-year-old male showed increased cupping (A) and a spectral domain optical coherence tomography peripapillary retinal nerve fiber layer (RNFL) thickness map revealed thinning in both eyes (B). Analysis of the patient's visual field revealed a mild left homonymous hemianopsia (C). His macular Ganglion cell thickness map showed left homonymous vertical pattern of loss (D). His brain magnetic resonance imaging showed a hemorrhagic lesion around the right optic radiation (E). OD = right eye; OS = left eye.
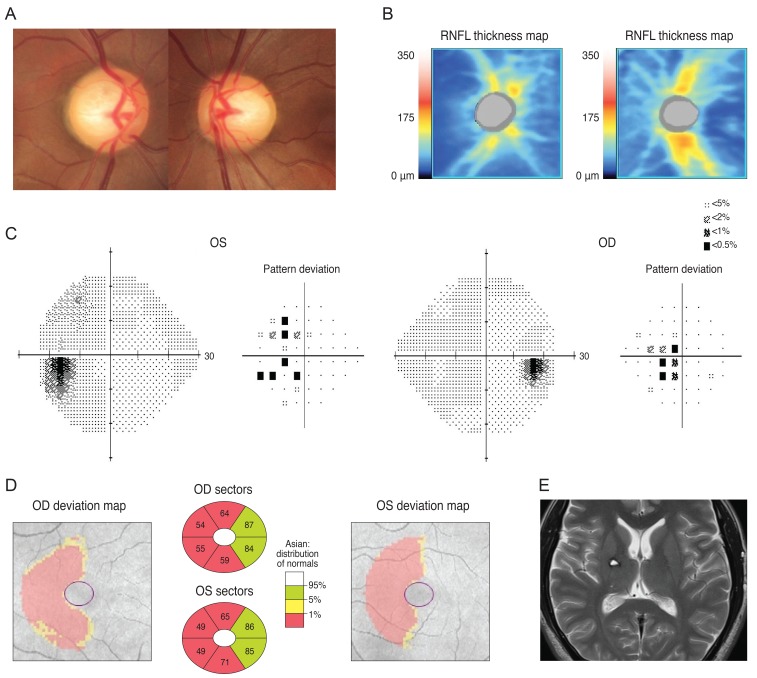
Fig. 3
A brain magnetic resonance imaging of a 72-year-old man revealed a pituitary adenoma (A) displacing the pituitary stalk (arrow) and parenchyma to right side, and compression of the optic chiasm (arrowheads) on a T1-weighted gadolinium-enhanced image of the coronal section. (B) His left optic nerve looked more compressed than the right (arrows) on a T2-weighted coronal image (C). Analysis of his visual field revealed bitemporal hemianopsia (D) and a Ganglion cell thickness map showed a binasal vertical pattern of loss in the right eye, whereas the left eye showed a more generalized pattern of retinal ganglion cell loss, which was more severe at the nasal half and had a relatively preserved inferotemporal sector (E). OD = right eye; OS = left eye; GCL = ganglion cell layer; IPL = inner plexiform layer.
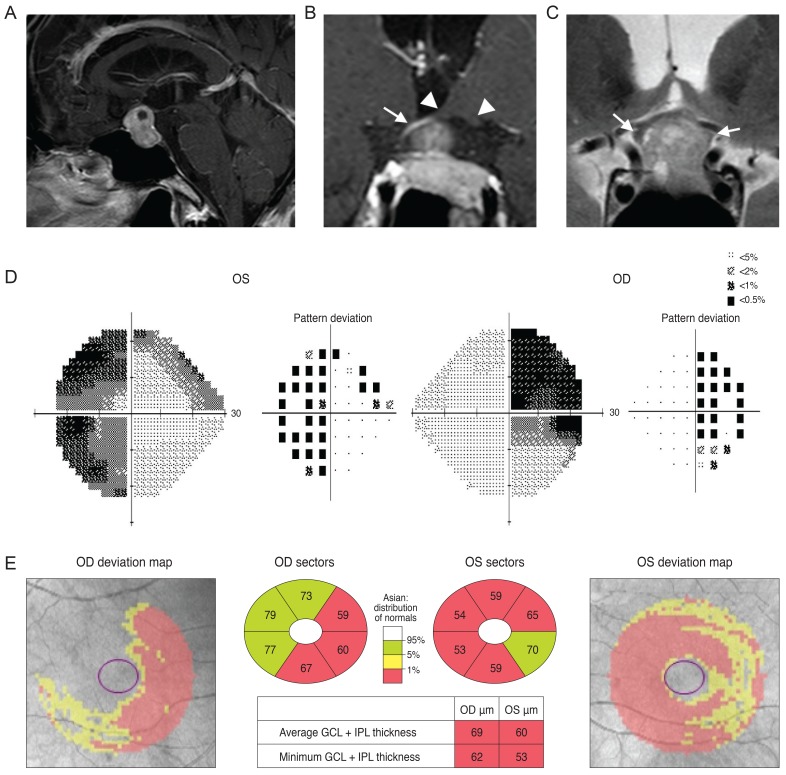
Fig. 4
Analysis of a 77-year-old man showed increased cupping in his optic disc (A) and optical coherence tomography peripapillary retinal nerve fiber layer (RNFL) thickness map is shown in (B). His Ganglion cell thickness map showed a right inferior quadratic pattern of loss (C) and analysis of his visual field showed a right superior homonymous quadranopsia (D). A brain magnetic resonance imaging revealed a left posterior cerebral artery territory infarct (E). OD = right eye; OS = left eye; GCL = ganglion cell layer; IPL = inner plexiform layer.
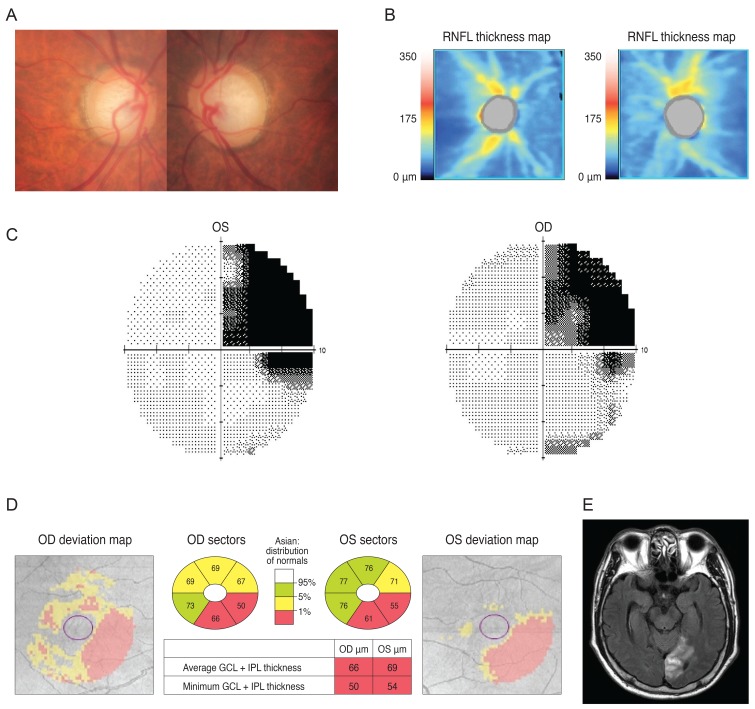
Fig. 5
Analysis of a 38-year-old woman showed mild cupping in her optic disc (A) and optical coherence tomography showed reduced retinal nerve fiber layer (RNFL) thickness (B). Her visual field result was unreliable (C) but a Ganglion cell thickness map revealed a left homonymous vertical pattern of loss (D). OD = right eye; OS = left eye; GCL = ganglion cell layer; IPL = inner plexiform layer.


 PDF
PDF ePub
ePub Citation
 Print
Print


 XML Download