Journal List > Korean J Ophthalmol > v.23(3) > 1024654

Oh and Kim: Scanning Laser Polarimetry and Optical Coherence Tomography for Detection of Retinal Nerve Fiber Layer Defects

Abstract

Purpose

To compare the ability of scanning laser polarimetry with variable corneal compensation (GDx-VCC) and Stratus optical coherence tomography (OCT) to detect photographic retinal nerve fiber layer (RNFL) defects.

Methods

This retrospective cross-sectional study included 45 eyes of 45 consecutive glaucoma patients with RNFL defects in red-free fundus photographs. The superior and inferior temporal quadrants in each eye were included for data analysis separately. The location and presence of RNFL defects seen in red-free fundus photographs were compared with those seen in GDx-VCC deviation maps and OCT RNFL analysis maps for each quadrant.

Results

Of the 90 quadrants (45 eyes), 31 (34%) had no apparent RNFL defects, 29 (32%) had focal RNFL defects, and 30 (33%) had diffuse RNFL defects in red-free fundus photographs. The highest agreement between GDx-VCC and red-free photography was 73% when we defined GDx-VCC RNFL defects as a cluster of three or more color-coded squares (p<5%) along the traveling line of the retinal nerve fiber in the GDx-VCC deviation map (kappa value, 0.388; 95% confidence interval (CI), 0.195 to 0.582). The highest agreement between OCT and red-free photography was 85% (kappa value, 0.666; 95% CI, 0.506 to 0.825) when a value of 5% outside the normal limit for the OCT analysis map was used as a cut-off value for OCT RNFL defects.

Conclusions

According to the kappa values, the agreement between GDx-VCC deviation maps and red-free photography was poor, whereas the agreement between OCT analysis maps and red-free photography was good.

Early detection of glaucomatous damage is important for preventing irreversible optic neuropathy. Retinal nerve fiber layer (RNFL) abnormalities have been shown to precede the development of visual field defects in glaucoma patients.1-3 It has been reported that changes in the RNFL are a better predictor of glaucoma deterioration than are changes in the optic disc cup configuration.4-7
Although RNFL photography using red-free fundus photographs (red-free photographs) has been a useful method for the detection of RNFL defects, the interpretation of the photographs is sometimes qualitative and subjective.6,8 Several instruments have been introduced to quantitatively assess RNFL defects. Scanning laser polarimetry (SLP) is based on the birefringence properties of ganglion cell axon neurotubules that alter the laser scanning beam polarization according to the RNFL thickness.9 A SLP version with variable corneal compensation (GDx-VCC, Laser Diagnostic Technologies, Inc., San Diego, CA, USA) has resulted in improved diagnostic accuracy as compared with an earlier version of this instrument that used fixed corneal compensation. 10,11 Optical coherence tomography (OCT) uses a scanning interferometer to obtain a cross-section of the retina.12 The topographic representation is based on the reflectivity of the different retinal layers.13 The third-generation machine software, Stratus OCT (Carl Zeiss Meditec, Inc., Dublin, CA, USA), can analyze both RNFL thickness and the optic nerve head.14
The majority of reports that have compared the use of GDx-VCC and OCT indicate a similar ability to diagnose glaucoma in both instruments.15-19 Most previous studies on SLP and OCT have used software-provided global parameters, including NFI (SLP) and the average of RNFL thickness (SLP, OCT), to compare their abilities to discriminate glaucomatous eyes. However, Brusini et al.16 stated that software-provided parameters are based on data from a large region of the RNFL, thus limiting the detection of certain localized RNFL defects.
Jeoung et al.20 evaluated the ability of OCT to detect localized RNFL defects using the OCT RNFL analysis map containing a normative database. They showed that in most cases a localized RNFL defect by red-free photography overlapped the same defect observed with OCT. GDx-VCC has a similar statistical analysis system using a normative database called the deviation map.21 Because the deviation map uses a grayscale fundus image of the eye as a background and displays abnormal grid values as colored squares over this image, users are able to determine the precise location of the abnormality. Kook et al.22 and Choi et al.23 suggest that the deviation map algorithm with a severity score calculation might enhance the understanding of GDx-VCC in the detection of glaucoma. Although RNFL OCT analysis maps correlate well with localized RNFL defects seen in RNFL photography, few reports show agreement between photographic RNFL defects and GDx-VCC deviation maps. This study was designed to compare the ability of GDx-VCC and OCT to detect diffuse or focal RNFL defects seen in redfree photography with the GDx-VCC deviation maps and OCT RNFL analysis maps. We did not intend this study to address the ability of these instruments to detect glaucoma.

Materials and Methods

This retrospective cross-sectional study included 45 eyes of 45 consecutive Korean glaucoma patients with RNFL defects as seen in red-free photographs from May 2005 to July 2006. Informed consent was obtained from all patients. Because all measurements were obtained by methods routinely used in patients with glaucoma, and this study protocol did not include surgical or medical interventions, approval from the institutional review board was not needed according to our regulations. The experimental protocol was performed in accordance with the tenets of the Declaration of Helsinki.
All patients provided their ocular and systemic histories and received ophthalmologic examinations, including best corrected visual acuity measurements, slit-lamp examinations, Goldmann applanation tonometry, ophthalmoscopy, and standard automated perimetry (SAP) with the Humphrey automated field analyzer HFA II 750 (Humphrey Instruments, a division of Carl Zeiss, Inc., San Leandro, CA, USA). In addition, all patients underwent an evaluation for RNFL defects, including RNFL photography, GDx-VCC, and OCT. All examinations were conducted within a period of six months.
Glaucoma was diagnosed in this study when a patient had glaucomatous optic disc damage and RNFL defects with or without glaucomatous visual field loss. All eyes had open angles. Glaucomatous optic disc damage was defined by evidence of excavation, neuroretinal rim thinning or notching, or an asymmetry of the vertical cup-to-disc ratio more than 0.2.
Patients were included when their eyes had diffuse or focal RNFL defects as seen in a red-free photograph, a best corrected visual acuity of 20/40 or better, a clear ocular media, and well-controlled intraocular pressure at the time of evaluation. One eye per patient was randomly selected if both eyes met our inclusion criteria. Eyes with a history of glaucoma surgery, secondary glaucoma, retinal diseases such as diabetic retinopathy, peripapillary atrophy extending to 1.7 mm from the disc center, an atypical birefringence pattern on GDx-VCC imaging (typical scan score < 60),24 a quality score grade less than 8 in GDx-VCC imaging, or poor image quality in OCT (signal-to-noise ratio < 35; accepted A-scans < 95%) were excluded from this study.
RNFL photography was performed after the pupil was fully dilated with a solution containing 0.5% tropicamide and 2.5% phelyephrine.25 A CF-60UV fundus camera (Canon Inc., Utsunomiya, Japan) with TMAX 100 film (Kodak Inc., Seoul, Korea) or an FF 450 plus IR fundus camera with the VISIPAC™ system (Carl Zeiss Meditec, Inc., Jena, Germany) was who had no knowledge of the patients' clinical information. When we could detect both the upper and lower borders of an RNFL defect in a red-free photograph, we regarded it as a focal RNFL defect (Fig. 1A). On the other hand, when we found decreased RNFL density in the whole superior and/or inferior temporal quadrants and could not define any borders of the defect, we categorized it as a diffuse RNFL defect (Fig. 2A). Decreased density in diffuse defects in red-free photography was determined by comparing the superior and inferior temporal quadrants in the same or the contralateral eye. If findings from both investigators (YYK, JHO) did not agree or the quality of the red-free photograph was poor, we excluded those eyes from the study.
SLP imaging was performed using GDx-VCC (software version 5.4) without pupillary dilation. GDx-VCC used a circular scan (3.2 mm diameter) centered on the optic disc. GDx-VCC software-provided parameters were obtained. We defined 3S (three squares) GDx RNFL defects as a cluster of three or more color-coded squares along the traveling line of the retinal nerve fiber in the GDx-VCC deviation map. Clusters of four, five, six, or more color-coded squareswere defined as 4S, 5S, and 6S defects, respectively (Fig. 3). A cluster of two or fewer squares was not regarded as a GDx RNFL defect because two or fewer squares could not show whether the defect traveled along the RNFL distribution. We also excluded any squares starting outside of a single disc diameter from the disc margin (Fig. 3C). In addition, 5% of the 3S GDx RNFL defects included any cluster with three or more squares outside of the 95%, 98%, 99%, and 99.5% normal limits. Two percent of the 3S GDx RNFL defects had three or more squares of 2% (outside of the 98% normal limit), 1% (outside of the 99% normal limit), or 0.5% (outside of the 99.5% normal limit). The principles were applied for other combinations in 1% 3S, 0.5% 3S, 5% 4S, 2% 4S, 1% 4S, 0.4% 4S, 5% 5S, 2% 5S, 1% 5S, 0.5% 5S, 5% 6S, 2% 6S, 1% 6S, and 0.5% 6S GDx RNFL defects.
The Stratus OCT (software version 3.0) was used with or without pupillary dilation to a minimum diameter of 4.5 mm. The circular 360° OCT scans were obtained using the fast RNFL thickness scan mode, which consisted of three scans, each having 256 test points measured along a nominal 1.73 mm radius circle on the peripapillary of the RNFL. OCT softwareprovided parameters were obtained. Segments of the line graph located below the yellow band (outside of the 95% normal limit) and within the red band (outside of the 99% normal limit) of the OCT RNFL analysis map were defined as 5% and 1% OCT RNFL defects, respectively.
The red-free photographs and GDx-VCC deviation maps were divided into four quadrants (superior temporal, inferior temporal, superior nasal, and inferior nasal) along the reference lines, which were the horizontal and vertical lines from the disc center. The OCT RNFL analysis map was also divided into four quadrants at the corresponding point of the reference lines on the red-free photograph and the GDx-VCC deviation map. The superior nasal quadrant and the inferior nasal quadrant were excluded in this study. Further, the superior temporal and inferior temporal quadrants in an eye were analyzed independently using the red-free photographs, the GDx-VCC deviation maps, and the OCT RNFL analysis maps.
When the location of GDx RNFL defects or OCT RNFL defects overlapped with the RNFL defects seen in the red-free photographs for localized RNFL defects, we defined those as the corresponding GDx-VCC or OCT RNFL defects (Fig. 1 and 2). For the comparison of diffuse defects, in which their borders could not be determined in the red-free photographs, we assumed that the RNFL defects existed outside the papillomacular bundle (central 40° divided into superior and inferior sectors each 20° from the horizontal reference line),26 which is relatively resistant to glaucomatous RNFL damage.
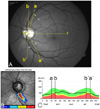
Because the deviation map uses a grayscale fundus image of the eye as a background, determining the overlap between the red-free photographs and GDx-VCC RNFL defect was straightforward. However, in the OCT RNFL analysis map, the minimum and maximum angles of the line graph segments located below the colored band were measured to determine the overlap between photographic RNFL defects and OCT RNFL defects, respectively. Two-hundred fifty-six test points were converted to 360 degrees in the OCT analysis maps (Fig. 1C).20,27 In the red-free photographs, the minimum and maximum angles between the horizontal reference line and a line from the center of the disc to the disc margin where the RNFL defect met the disc were measured (Fig. 1A). The range and location of angles in defects seen in the red-free photographs were then compared with those seen in OCT RNFL defects whether the measured angles overlapped or not.
All statistical analyses were performed using SAS version 9.1.3 (SAS Institute Inc., Cary, NC, USA). For an evaluation of the agreement between the use of RNFL photography and GDx-VCC or OCT, Cohen's κ value was calculated with 95% confidence intervals (CIs).28 The κ values were interpreted as follows: 0=no agreement, less than 0.4=poor agreement, 0.40-0.59 fair agreement, 0.60-0.74=good agreement, 0.75-0.99=excellent agreement, and 1=perfect agreement.

Results

The mean age of the 45 patients was 50.5±14.3 years (range, 22-76 years). Twenty-nine patients (64%) were men and 16 (36%) were women. Fifteen (33%) right eyes and 30 (67%) left eyes were included in the data set. Patient demographics are summarized in Table 1.
Of the 90 quadrants (45 eyes), 31 (34%) had no apparent RNFL defects, 29 (32%) had focal RNFL defects, and 30 (33%) had diffuse RNFL defects in the red-free photographs. Table 2 shows the agreements and kappa valuesfor 3S, 4S, 5S, and 6S GDx RNFL defects and OCT RNFL defects with photographic RNFL defects. The highest agreement between the GDx-VCC and red-free photography was 73% when we defined GDx-VCC RNFL defects as a cluster of three or more color-coded squares (p< 5%) along the traveling line of the retinal nerve fiber in the GDx-VCC deviation map (kappa value, 0.388; 95% CI, 0.195 to 0.582) (Fig. 4A). The highest agreement between the OCT and red-free photography was 85% (kappa value, 0.666; 95% CI, 0.506 to 0.825) when a value 5% outside the normal limit for the OCT analysis map was used as a cut-off value for OCT RNFL defects (Fig. 4A).
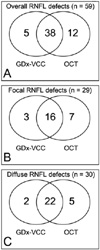
When we used the 5% 3S GDx RNFL defects and the 5% OCT RNFL defects as the RNFL defects, the rate of agreement with focal RNFL defects seen in the red-free photographs (29 quadrants) was 66% with GDx-VCC and 79% with OCT. Three of 29 quadrants were detected only by the use of GDx-VCC, seven quadrants only by the use of OCT, and three quadrants were not detected by the use of either instrument (Fig. 4B). For diffuse RNFL defects seen in the red-free photographs (30 quadrants), the agreement with GDx-VCC was 80%, and with OCT it was 90%. Two of 30 quadrants were detected only by GDx-VCC, five quadrants were detected only by OCT, and one quadrant was not detected by either instrument (Fig. 4C).

Discussion

The purpose of our study was to assess the agreement between GDx-VCC and OCT, and photographic RNFL defects. According to the kappa values, we found that the agreement between GDx-VCC deviation maps and red-free photography was poor, whereas the agreement between OCT RNFL analysis maps and red-free photography was good. Our results showed that the agreement between GDx-VCC and RNFL photography had the highest kappa value of 0.388 in the 5% 3S GDx RNFL defects. Similarly, agreement between GDx-VCC and OCT had the highest kappa value of 0.666 in the 5% OCT RNFL defects.
The OCT RNFL analysis map can be used to evaluate agreements between red-free photography and OCT. Hwang et al.27 reported a strong topographic correlation between characteristics of localized RNFL defects as determined by OCT and RNFL photography. Jeoung et al.20 reported that the sensitivity and specificity of OCT using RNFL analysis maps for detecting localized RNFL defects were 85.9% and 97.4%, respectively. Our results also indicated a good agreement between RNFL photography and OCT analysis maps.
We used GDx-VCC deviation maps to compare the use of GDx-VCC with RNFL photography. Because GDx-VCC deviation maps use a fundus image of the eye as a background, they may well reflect the locality of an RNFL defect. In addition, GDx-VCC deviation maps include a normative database, as do OCT RNFL analysis maps. Kook et al.22 used a deviation map algorithm for the detection of RNFL defects. The number of abnormal superpixels was counted in each quadrant, and each superpixel was assigned a severity value as follows: 0, normal areas; 1, p<0.05; 2, p<0.02; 3, p<0.01; and 4, p<0.005. A final severity score for each eye was determined by summing the severity values of all of the abnormal superpixels. Although their system was useful for categorizing the severity of the disease, it may not sufficiently indicate the location of an RNFL defect. Photographic RNFL defects indicated whether or not there was a defect and, if it was present, showed the location of the defect. Therefore, to reveal the location of RNFL defects with GDx-VCC deviation maps, we developed a novel algorithm. However,used statistically-obtained pixels, nothave representedan actual RNFL defect.
Localized RNFL defects are most often found in the inferior temporal quadrant, followed by the superior temporal quadrant. In the nasal fundus quadrant, localized RNFL defects are only rarely seen, possibly because normal RNFL are less detectable in the nasal fundus than in the inferior temporal and superior temporal fundus quadrants.29,30 In fundus regions in which the RNFL is physiologically thin, localized defects are harder to find than in regions with a thick RNFL.31 Therefore, we excluded the superior nasal and inferior nasal quadrants among the four quadrants in this study.
Generally, the agreement between GDx-VCC and red-free photography, and between OCT and red-free photography was greater in diffuse RNFL defects than in focal defects, possibly because the coincidence criteria were less stringent for diffuse RNFL defects in our study. In addition, by using the 5% 3S GDx RNFL defects and the 5% OCT RNFL defects (showing the highest agreements and highest kappa values) as RNFL defects, focal RNFL defects in three of 29 quadrants were detected only by the use of GDx-VCC, and seven quadrants were detected only by the use of OCT (Fig. 4B). For diffuse RNFL defects, two of 30 quadrants were detected only by the use of GDx-VCC, and five quadrants were only detected by the use of OCT (Fig. 4C). We suggest that the use of GDx-VCC and OCT instrumentation can be complementary in the evaluation of RNFL defects.
Our study has some limitations. First, all participants in our study were Korean, but the normative database for GDx-VCC and OCT consisted of several ethnic groups. Therefore, further study with other ethnic groups is needed. In addition, the interpretation of our photographs might be subjective because of the inherited nature of red-free photography. Moreover, RNFL defects cannot be ophthalmoscopically detected if less than 50% of the thickness of the RNFL is lost.32 As a result, the detection of glaucomatous RNFL defects using RNFL photography may be less accurate for a less damaged RNFL.
In conclusion, according to the kappa values, the agreement between GDx-VCC deviation mapping and red-free photography was poor, whereas the agreement between OCT RNFL analysis mapping and red-free photography was good. In addition, our study suggests that the use of GDx-VCC and OCT may be complementary for evaluating RNFL defects in some cases.

Figures and Tables

Fig. 1
Topographic measurements of focal retinal nerve fiber layer (RNFL) defects in the same eye. In this eye, the RNFL defect in the inferior temporal quadrant was detected by both GDx-VCC and OCT. However, the RNFL defect in the superior temporal quadrant was detected by only OCT. (A) Topographic measurements of RNFL defects in a red-free photograph. The reference line (line r) is the horizontal line temporal to the disc center (c). Lines a (a') and b (b') are the lines from the center of the disc tothe disc margin where the RNFL defect meets the disc. The minimum and maximum angles between line r and the lines a (a') or b (b'), respectively, were measured. The arrows indicate focal RNFL defects seen in the red-free photograph. (B) Overlap between the GDx-VCC deviation map and the red-free photographs in the inferior quadrant. (C) Topographic measurements of RNFL defects in the OCT RNFL analysis map. The minimum and maximum angles of the line graph segments located below the yellow band were measured after 256 tests points were converted to 360 degrees of the angle.
kjo-23-169-g001
Fig. 2
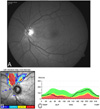
Photographs showing diffuse retinal nerve fiber layer (RNFL) defects detected in the same eye. The red-free photograph shows diffuse RNFL defects in the superior temporal quadrant (A). A decreased intensity in the upper half compared with the intensity in the lower half was noted. The location of RNFL defects in the GDx-VCC deviation map (B) and the OCT RNFL analysis map (C) overlap with diffuse RNFL defects seen in the red-free photograph.
kjo-23-169-g002
Fig. 3
Photographs showing various definitions of the deviation map using scanning laser polarimetry (GDx-VCC). A to D. No GDx retinal nerve fiber layer (RNFL) defect is shown in the deviation maps (A: one square, B: two squares, C: squares outside one disc diameter, and D: nasal squares). E to L. Several GDx RNFL defects are shown in the deviation maps (please refer to the methods section in the text).
kjo-23-169-g003
Fig. 4
Venn diagrams showing agreements for overall (A), focal (B), and diffuse (C) photographic retinal nerve layer defects (RNFL) with scanning laser polarimetry (GDx-VCC) and optical coherence tomography (OCT).
kjo-23-169-g004
Table 1
Patient demographics
kjo-23-169-i001

*MD=mean deviation; SAP=standard automated perimetry; PSD=pattern standard deviation; §GDx TSNIT Avg=average retinal nerve fiber layer thickness obtained by scanning laser polarimetry; GDx NFI=nerve fiber indicator obtained by scanning laser polarimetry; #OCT Avg Thick=average retinal nerve fiber layer thickness obtained by optical coherence tomography.

Table 2
The agreement of scanning laser polarimetry (GDx-VCC) and optical coherence tomography (OCT) for detecting both diffuse and focal retinal nerve fiber layer (RNFL) defects in red-free photographs
kjo-23-169-i002

3S, 4S, 5S, and 6S GDx RNFL defects=a cluster of three, four, five, and six or more color-coded squares, respectively, along the traveling line of the retinal nerve fiber in the GDx-VCC deviation map; 5%, 2%, 1%, and 0.5% GDx RNFL defects=GDx RNFL defects that included squares that were outside of the 95%, 98%, 99%, and 99.5% normal limit, respectively; 5% and 1% OCT RNFL defects=segments of the line graph located below the yellow band (outside of the 95% normal limit) and within the red band (outside of the 99% normal limit) in the OCT RNFL analysis map.

Acknowledgements

We thank Hyonggin An, PhD, at the Department of Biostatistics, Korea University College of Medicine, for providing statistical assistance.

Notes

This study was presented at the 96th annual meeting of the Korean Ophthalmological Society in November, 2006.

References

1. Harwerth RS, Carter-Dawson L, Shen F, et al. Ganglion cell losses underlying visual field defects from experimental glaucoma. Invest Ophthalmol Vis Sci. 1999. 40:2242–2250.
2. Sommer A, Katz J, Quigley HA, et al. Clinically detectable nerve fiber atrophy precedes the onset of glaucomatous field loss. Arch Ophthalmol. 1991. 109:77–83.
3. Airaksinen PJ, Drance SM, Douglas GR, et al. Visual field and retinal nerve fiber layer comparisons in glaucoma. Arch Ophthalmol. 1985. 103:205–207.
4. Quigley HA, Katz J, Derick RJ, et al. An evaluation of optic disc and nerve fiber layer examinations in monitoring progression of early glaucoma damage. Ophthalmology. 1992. 99:19–28.
5. Quigley HA, Miller NR, George T. Clinical evaluation of nerve fiber layer atrophy as an indicator of glaucomatous optic nerve damage. Arch Ophthalmol. 1980. 98:1564–1571.
6. Sommer A, Quigley HA, Robin AL, et al. Evaluation of nerve fiber layer assessment. Arch Ophthalmol. 1984. 102:1766–1771.
7. Tuulonen A, Airaksinen PJ. Initial glaucomatous optic disk and retinal nerve fiber layer abnormalities and their progression. Am J Ophthalmol. 1991. 111:485–490.
8. Niessen AG, van den Berg TJ, Langerhorst CT, Bossuyt PM. Grading of retinal nerve fiber layer with a photographic reference set. Am J Ophthalmol. 1995. 120:577–586.
9. Weinreb RN, Shakiba S, Zangwill L. Scanning laser polarimetry to measure the nerve fiber layer of normal and glaucomatous eyes. Am J Ophthalmol. 1995. 119:627–636.
10. Greenfield DS, Knighton RW, Feuer WJ, et al. Correction for corneal polarization axis improves the discriminating power of scanning laser polarimetry. Am J Ophthalmol. 2002. 134:27–33.
11. Zhou Q, Weinreb RN. Individualized compensation of anterior segment birefringence during scanning laser polarimetry. Invest Ophthalmol Vis Sci. 2002. 43:2221–2228.
12. Huang D, Swanson EA, Lin CP, et al. Optical coherence tomography. Science. 1991. 54:1178–1181.
13. Schuman JS, Hee MR, Puliafito CA, et al. Quantification of nerve fiberlayer thickness in normal and glaucomatous eyes using optical coherence tomography. Arch Ophthalmol. 1995. 113:586–596.
14. Medeiros FA, Zangwill LM, Bowd C, et al. Evaluation of retinal nerve fiberlayer, optic nerve head and macular thickness measurements for glaucoma detection using optical coherence tomography. Am J Ophthalmol. 2005. 139:44–55.
15. Bagga H, Greenfield DS, Feuer W, Knighton RW. Scanning laser polarimetry with variable corneal compensation and optical coherence tomography in normal and glaucomatous eyes. Am J Ophthalmol. 2003. 135:521–529.
16. Brusini P, Salvetat ML, Zeppieri M, et al. Comparison between GDx VCC scanning laser polarimetry and Stratus OCT optical coherence tomography in the diagnosis of chronic glaucoma. Acta Ophthalmol Scand. 2006. 84:650–655.
17. Medeiros FA, Zangwill LM, Bowd C, Weinreb RN. Comparison of the GDx VCC scanning laser polarimeter, HRT II confocal scanning laser ophthalmoscope, and stratus OCT optical coherence tomograph for the detection of glaucoma. Arch Ophthalmol. 2004. 122:827–837.
18. Kanamori A, Nagai-Kusuhara A, Escano MF, et al. Comparison of confocal scanning laser ophthalmoscopy, scanning laser polarimetry and optical coherence tomography to discriminate ocular hypertension and glaucoma at an early stage. Graefes Arch Clin Exp Ophthalmol. 2006. 244:58–68.
19. Leung CK, Chan W, Chong KKL, et al. Comparative study of retinal nerve fiber layer measurement by StratusOCT and GDx VCC, I: correlation analysis in glaucoma. Invest Ophthalmol Vis Sci. 2005. 46:3214–3220.
20. Jeoung JW, Park KH, Kim TW, et al. Diagnostic Ability of Optical Coherence Tomography with a Normative Database to Detect Localized Retinal Nerve Fiber Layer Defects. Ophthalmology. 2005. 112:2157–2163.
21. Laser Diagnostic Technologies, Inc.RNFL analysis with GDx VCC, a primer and clinical guide. 2004. Laser Diagnostic Technologies, Inc.;31.
22. Kook MS, Cho HS, Seong M, Choi J. Scanning laser polarimetry using variable corneal compensation in the detection of glaucoma with localized visual field defects. Ophthalmology. 2005. 112:1970–1978.
23. Choi J, Cho HS, Lee CW, Kook MS. Scanning laser polarimetry with variable corneal compensation in the area of apparently normal hemifield in eyes with normal-tension glaucoma. Ophthalmology. 2006. 113:1954–1960.
24. Bagga H, Greenfiel DS, Feuer WJ. Quantitative assessment of atypical birefringence images using scanning laser polarimetry with variable corneal compensation. Am J Ophthalmol. 2005. 139:437–446.
25. Airaksinen PJ, Nieminen H. Retinal nerve fiber layer photography in glaucoma. Ophthalmology. 1985. 92:877–879.
26. Chihara E, Tanihara H. Parameters associated with papillomacular bundle defect in glaucoma. Graefes Arch Clin Exp Ophthalmol. 1992. 200:511–517.
27. Hwang JM, Kim TW, Park KH, et al. Correlation between topographic profiles of localized retinal nerve fiber layer defects as determined by optical coherence tomography and red-free fundus photography. J Glaucoma. 2006. 15:223–228.
28. Fleiss JL. Statistical methods for rates and proportions. 1981. 2nd ed. New York: John Wiley and Sons;212–213.
29. Jonas JB, Schiro D. Localised wedge shaped defects of the retinal nerve fibre layer in glaucoma. Br J Ophthalmol. 1994. 78:285–290.
30. Jonas JB, Nguyen NX, Naumann GOH. The retinal nerve fiber layer in normal eyes. Ophthalmology. 1989. 96:627–632.
31. Jonas JB, Dichtl A. Evaluation of the retinal nerve fiber layer. Surv Ophthalmol. 1996. 40:369–378.
32. Quigley HA, Addicks EM. Quantitative studies of retinal nerve fiber layer defects. Arch Ophthalmol. 1982. 100:807–814.
TOOLS
Similar articles