

 PDF
PDF ePub
ePub Citation
 Print
Print


Many factors contribute to myopia.1-3 In East Asia, where there has been rapid industrialization and urbanization, several reports show that the prevalence of myopia is increasing. 4,5 Notably, an increase in education level is associated with an increase in myopia.6,7 In 2004, Kang et al.8 published a Korean study relating environmental factors, such as the level of education and urbanization, to an increase in the
prevalence of myopia.
Histopathologic findings associated with myopia are well documented. The sclera becomes thinner, and there is a partial expansion of the posterior pole. With choroidal degeneration and atrophy,9 it has been shown that the sensory retina becomes thinner.10 In light of those changes, caution is called for when interpreting results from the fundus examination as well as other eye tests for myopia.
Recently, optical coherence tomography (OCT) has been applied to measure fovea and the peripapillary retinal nerve fiber layer (RNFL) thickness. When the OCT projects light beams into the tissue, the difference in time of the reflected lights from each part of the tissue is measured using the optical interferometer, resulting in acquisition of high resolution transverse images of the retina. OCT is easy to use and highly reproducible in clinical practice.11,12
Since OCT has been implemented in the clinic, a concern has been raised regarding the accuracy of this technique with aging. Many investigators have reported that the thickness of the fovea and the peripapillary RNFL decreases with increasing age.13-17 As there are few studies to date on those changes in myopia, and what studies do exist yield inconsistent reports,18-20 we have evaluated the relationship between fovea and peripapillary RNFL thickness and myopic changes in healthy Korean adults.
Material and Methods
Sixty-five healthy Korean adults (for a total of 130 eyes) between the ages of 23 and 26 were selected on the basis of basic ophthalmic examination. Using the Snellen chart, vision was measured. The same experimenter measured the intraocular pressure three times in each eye with the Goldmann tonometer. The refractive error from the manifest refraction (MR) was adjusted to the spherical equivalent. The visual field was measured using the Humphrey® field analyzer (HFA 750i, Carl Zeiss Meditec), with the central 30-2 SITA-standard program. Every patient was instilled with a drop of Mydrin-P® (1% tropicamide and 2.5% phenylephrine hydrochloride) in each eye 3 times at 15 minute intervals to dilate the pupil. A fundus examination was precisely performed in all subjects.
The thicknesses of the fovea and the peripapillary RNFL were measured through the dilated pupil using the StratusOCT (Carl Zeiss Meditec, Dublin, CA). The thinnest dimension was used as the thickness of the fovea using Retinal Thickness/Volume Analysis. To determine the thickness of the peripapillary RNFL, RNFL thickness analysis on a RNFL thickness (3.46 mm) scan was used to measure the average thickness in four sectors, the superior, inferior, temporal and nasal parameters.
Any subject who had measurements outside of normal range on their basic ophthalmic examination was excluded. The normal group included subjects with corrected vision than 20/25, an intraocular pressure between 10 to 21 mmHg, a mean deviation ≥-2.79 and a pattern standard deviation ≤2.24 with an adequate confidence level for the visual field test.21,22 From the fundus examination, those included in the study had a tigroid fundus and a peripapillary chorioretinal atrophy of less than 3.46 mm from the disc, as well as an impression of myopia.
From the spherical equivalent data, measurements between zero to -2D were classified into group one (emmetropia and low myopia), measurements between -2 to -5D were classified into group two (moderate myopia), and measurements more than -5D were classified into group three (high myopia). From the total of 130 eyes, 14 eyes were excluded from the study as their measurements fell outside of the normal range. For the eyes studied, group one contained 45 eyes, group two contained 43 eyes, and 28 eyes were included in group three. The SPSS 10.0 program was used for statistical analysis. Differences among the three groups were compared using ANOVA, and multiple comparisons were performed using the Turkey's HSD procedure. Simple regression analysis was used to analyze changes in the axial length, the thickness of the fovea and the peripapillary RNFL depending on the differences in the spherical equivalent (p=0.05).
Results
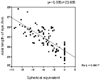
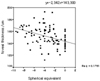
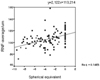
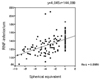
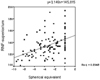
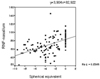
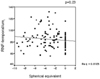
The average of the spherical equivalents was -0.34±0.63 D in group one (45 eyes, 38.8%), -3.88±0.85 D in group two (43 eyes, 37.1%), and -6.85±1.32 D in group three (28 eyes, 24.1%). The range was 0 to -9.25. The average axial length was 24.46±1.00 mm (range, 22.31 to 26.40 mm). The spherical equivalents, axial lengths, and thickness values for the fovea and the peripapillary RNFL are shown in Table 1. In all three groups, there were significant differences in axial length and in the thickness of the inferior RNFL. As for the foveal thickness, group one showed the thinnest thickness in the average, superior and nasal RNFL compared to the other groups. However, for all three groups, there were no significant differences in the thickness of the temporal RNFL. As myopia increased, changes in other parameters were evaluated by simple regression analysis. The axial length of the eye became longer (P<0.001; Fig. 1), and the thickness of the fovea significantly increased (P<0.001; Fig. 2). Conversely, the thickness of the average, superior, inferior and nasal RNFL decreased (P<0.001; Figs. 3, 4, 5, 6). There was no correlation between myopia and thickness of the temporal RNFL (P=0.236; Fig. 7).
Discussion
Histopathologic findings of the sensory retina and choroidal atrophy of the choroid in myopia are well known.9,10,23 However, tissue samples used to measure thickness of the retina are very sensitive to the condition of the specimens, such as hydration. This leads to wide variations in the measurements.14,15 Therefore, the OCT and the Retinal Thickness Analyzer have been employed to give accurate and reproducible measurements.14,15,18-20,24,25
Since Huang et al.24 first introduced the OCT in 1991, it has become the most widely used piece of equipment in the eye clinic. The OCT is a noninvasive imaging technology, which needs no direct contact with the eye. It is analogous to the B-scan of the ultrasonograph, using light beams instead of sound waves. Time differences in reflected light from each part of the tissue are measured using optical interferometry. In this study, we used the StratusOCT (Carl Zeiss Meditec, Dublin, CA), which projects a broad bandwidth near-infrared light beam (820 nm) onto the retina from a super luminescent diode. The longitudinal (depth) scan range is 2 mm into the tissue.26 The StratusOCT has a smaller footprint, can scan four times faster, and store 10 times as much data than earlier models.25
The StratusOCT model used in this study is known for its reproducibility and reliability.11 One experimenter tested all subjects. The OCT test was performed when the pupil was dilated more than 5 mm, with internal fixation used to avoid fixation loss during the test.
Healthy Korean adults between the ages of 23 and 26 were selected to exclude age related differences. The range of the spherical equivalents was 0 to -9.25D, which is within the focus adjustment range of the OCT (-12 to +20D) suggested by Huang et al.24
Group one, classified as emmetropia, represents healthy Korean adults. In this study, the thickness of the average, superior, inferior, temporal and nasal RNFL were similar to that reported by Lee et al.27 Our results showed the characteristic double hump pattern28 of the normal eye, where the superior and inferior RNFL was the thickest. The thickness of the fovea was 142.16±8.99 µm, similar to that in previous reports.13,20,29 Except for the thickness of the temporal RNFL, there was a statistically significant difference between the myopia (groups 2 and 3) and emmetropia (group 1) (P<0.05), especially in the axial length and thickness of the inferior RNFL. As myopia increased, the thickness of the fovea increased, while the thickness of the RNFL decreased. This relationship to myopia is shown in Fig. 1-7. The R-squared correlation was the highest (0.67) for axial length, and thickness of the inferior and nasal RNFL was the next highest value observed. However, the thickness of the temporal RNFL was not correlated to myopia (P=0.23).
Our findings are inconsistent with those reported by Mrugacz et al.12 who showed that as myopia increased, the thickness of the fovea decreased while the thickness of the peripapillary RNFL remained unchanged. However, other authors19,20 had results consistent with our study, where the thickness of the fovea increased as myopia increased. Few reports concerning the relationship between myopia and thickness of RNFL have been issued to date. Mrugacz et al. used the OCT 2000 and 60 eyes for their experiment, fewer cases than used in our study. In addition, the subjects that participated in Mrugacz et al.'s study were between the ages of 14 and 18, which makes comparison with our data difficult, as all of our subjects were adults.
In conclusion, we found that as myopia increased, the thickness of the fovea increased , while the thickness of the RNFL decreased, except for the temporal RNFL. Therefore, more attention is required to accurately interpret OCT results in patients with high degrees of myopia.

 XML Download