

 PDF
PDF ePub
ePub Citation
 Print
Print


Following improvements in diabetes treatment methods, complications such as diabetic retinopathy have become the focus of research attention in the field of medical science. More than 80% of patients with a 20-year history of diabetes experience some types of retinal lesion, and these patients are 20 times more likely to become blind than other members of the general population.1 Recently, diabetic retinopathy has become a major cause of blindness.
It is known that the capillaries are dilated and the flow of the retinal vessels increases at the initial state in diabetic retinopathy, and that with progression of the disease the flow decreases and hypoxia are locally induced with injury of the capillary endothelial cells and hemodynamic changes.2 For that reason, the pathophysiological study of the progression of diabetic retinopathy has been performed through the measurement of retinal blood flow with various methods.3 Retinal circulation time can be quantitatively analyzed by arm to retinal time (ART), arteriovenous passage time (AVP), and venous filling time (VFT)4,5 with video fluorescein angiogram (FAG) using scanning laser ophthalmoscope (SLO, Rodenstock, Germany).
Yang et al4 and Kang et al6 proposed that VFT is a suitable index to indicate peripheral microcirculation of the retina. They found that VFT was delayed in diabetic retinopathy and that VFT could be utilized as an indicator of diabetic retinopathy progression. Pae et al7 reported that VFT was more delayed in proliferative diabetic retinopathy (PDR) than in non-proliferative diabetic retinopathy(NPDR) and that VFT in PDR was shortened to the level in NPDR after PRP. Furthermore, Jang et al8 proposed that VFT measured before PRP could be a prognostic indicator of the progression and development of complication in PDR. Nevertheless, no study has investigated the association between AVP and VFT changes through PRP with the clinical course of DM reitnopathy, and previous studies have been limited by the lack of clinical correlation to the PRP effect.
The purpose of the present study was to verify the correlation between diabetic retinopathy progression and the changes of AVP and VFT through PRP. To this end, we measured AVP and VFT, which reflect the microcirculation of the posterior pole and mid-periphery, respectively, in patients separated into stabilized and progressed subject groups, and analyzed the changes of those two circulation times in each group. In this study, we evaluated the correlation of VFT changes through PRP with the progression of diabetic retinopathy and the PRP effect.
Materials and Methods
The study subject were the 32 patients (32 eyes) entered in the PDR registry of our hospital between April 1998 and January 2004 who had received PRP for PDR. These patients were subdivided into two groups according to the clinical course of PRP: the stabilized group (20 patients, 20 eyes) in which retinal neovascularization was regressed, and the progressed group (12 patients, 12 eyes) in which retinal neovascularization was continued and complication, such as vitreous hemorrhage or tractional retinal detachment, was developed within 12 months of laser treatment. The mean follow-up duration was 23.3 months.
The 32 eyes were diagnosed as PDR through video fluorescein angiogram using SLO based on the Diabetic Retinopathy Study (DRS)9,10. Within two weeks of diagnosis, all eyes underwent PRP composed of four separate procedure at one-week intervals. For each procedure, between 350 and 450 burns were applied with 500 µm, 0.2-second, krypton green laser burns of moderate intensity, placed one-half burn apart, extending from the posterior pole to the equator. Three months later, the video fluorescein angiograms were re-examined using SLO.
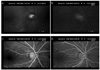
We reviewed the recorded S-VHS videotape containing video fluorescein angiogram using SLO, using the pause and jog shuttle devices, and examined the frames moving at a time rate of 1/30th of a second while keeping a record of the time appearing on the right upper corner of the picture. AVP and VFT, which reflect the microcirculation of the retinal posterior pole and the mid-peripheral retina, respectively, were measured at the upper temporal quadrant at a distance of 2 disc diameters from the optic disc margin. AVP was recorded from when the arterial flow began appearing at the upper temporal quadrant of the retina to when the venous lamina flow began appearing. VFT was recorded from when the venous lamina flow began appearing at the upper temporal quadrant of the retina to when the retinal vein was completely filled (Fig. 1).
AVP and VFT in each patient group were measured by three individuals and the mean times were used in this study. To examine the association of AVP with VFT changes through PRP with the clinical course of DM retinoapthy, the unpaired student T-test was used for statistical evaluation and the level of statistical significance was set at P<0.05.
Results
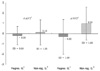
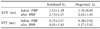
In the stabilized group (20 patients, 20 eyes) in which retinal neovascularization was regressed, the mean AVP was decreased by 0.20±0.89 sec from 2.93±1.18 sec measured before PRP to 2.73±1.07 sec after PRP, and the mean VFT was decreased by 0.30±1.69 sec from 8.35±2.07 sec measured before PRP to 8.05±1.83 sec after PRP (Table 1, 2, Fig. 2).
In the progressed group (12 patients, 12 eyes) in which retinal neovascularization was continued and complications were developed, the mean AVP was increased by 0.12±1.22 sec from 2.76±0.84 sec measured before PRP to 2.92±1.04 sec after PRP, and the mean VFT was increased by 0.99±1.60 sec from 8.28±2.02 sec measured before PRP to 9.27±2.62 sec after PRP (Table 1, 2, Fig. 2).
Discussion
In the 1950s, with the appreciable improvements in diabetes treatment methods, complications such as diabetic retinopathy have received necessary attention from the medical science community, even as diabetic retinopathy has became a major cause of blindness. For a long time, diabetic retinopathy had been considered as an incurable disease. However, findings from the Diabetic Retinopathy Study (DRS)9,10 and the Early Treatment Diabetic Retinopathy Study (ETDRS)11,12 have shown that photocoagulation can reduce the risk of severe vision loss by 90%. Since these studies in the 70s and 80s, using photocoagulation of the retina has become an important approach to limiting the loss of vision caused by diabetic retinopathy. Many studies have hypothesized a mechanism to explain the PRP effect. Wolbarsth et al13 explained that PRP reduces the production of vascular growth factor by destruction of ischemic retinal tissue, promotes oxygenation in the ischemic inner retinal layer by destruction of metabolic active photoreceptor cells and promotes oxygen diffusion from choroidal capillary to retinal inner layer. Glasser et al14 described how new vessel growth inhibitor production is increased in response to photocoagulation by retinal pigment epithelium.
The etiology of diabetic retinopathy is presumed to involve capillary change leading to microaneurysm and capillary obstruction which progresses to diabetic retinopathy, but this etiology has not yet been confirmed. Therefore, the progressional degree and pathophysiology of diabetic retinopathy have been studied by using various methods to measure the retinal blood flow.2,5 Fluorescein Angiography, ICG Angiography, Laser Doppler Velocimetry, Laser Doppler Flowmetry, Scanning Laser Doppler Flowmetry, Color Doppler Ultrasound Imaging, and so on have all been used in the measurement of retinal circulation.3 The special advantages of using video fluorescein angiogram with SLO to measure retinal circulation time, such as ART, AVP, VFT, is that we can repetitiously measure objects more objectively and quantatively,4,5 and that SLO's high resolution of 30 frames per second allows the circulation time to be quantified with a continous picture. Yang et al4 reported the mean retinal circulation times of non-diabetics as 13.9±1.9 sec, 1.8±0.7 sec and 6.4±2.4 sec for ART, AVP and VFT, respectively. Pae et al7 and Lim et al18 reported similar results.
Woo et al15 reported that microcirculation flow was decreased at the retinal posterior pole in diabetic retinopathy by scanning laser Doppler flowmetry, Blair et al16 reported that retinal mean circulation time was decreased in diabetic retinopathy by two-point fluorophotometry. According to the study by Niki et al17, the distribution of capillary nonperfusion area in diabetic retinopathy appeared first at the part in 26.3% of cases, at the mid-peripheral part in 61.2% of cases, and at the periphery in 2.6% of cases. It is evident that diabetic retinopathy invades the midperipheral part most frequently.
In more recent studies, Yang et al4 and Kang et al6 showed that VFT, which reflects the microcirculation of the midperipheral retina, is more significantly delayed than AVPT, which reflect the microcirculation of the posterior pole. In addition, Jang et al8 proposed that VFT measured before PRP could be a prognostic indicator of the disease progression and development of complication in PDR. Pae et al7 reported that VFT was more delayed in PDR than in NPDR and that VFT in PDR was recovered to the level in NPDR after PRP. They suggested that this finding might account for the ablation of damaged capillaries and the relieved retinal edema at the midperiphery. In addition, Bertram et al19 reported that AVP was significantly prolonged in diabetic patients and significantly decreased after PRP in those patients.
However, no study has examined the association of AVP and VFT changes through PRP with the clinical course of diabetic reitnopathy, and furthernore, previous studies have been limited by the lack of clinical correlation to the PRP effect.
The purpose of our study was to verify the association of AVP and VFT changes through PRP with the clinical course of diabetic reitnopathy, and then to evaluate whether VFT could be utilized as an indicator for the clinical effect of PRP. To this end, we measured AVP and VFT which reflect the microcirculation of the posterior pole and mid-periphery, respectively, in the stabilized and progressed patient groups and analyzed the changes of these two circulation times in each group. We evaluated the correlation of VFT changes through PRP with the progression of diabetic retinopathy and the PRP effect in comparison with the findings of Jang et al8 and Pae et al7.
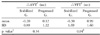
AVP and VFT were decreased through PRP in the stabilized group (20 patients, 20 eyes) but were increased through PRP in the pregressed group (12 patients, 12 eyes) (Table 1). The change of VFT was significant (P=0.04) in both groups with the unpaired student T-test, but that of AVP was not in either (P=0.34) (Table 2, Fig. 2). From this findings, we suggest that the changes of VFT can be a prognostic indicator of the clinical course of diabetic retinopathy after PRP and of the clinical effect of PRP.
 XML Download