

 PDF
PDF ePub
ePub Citation
 Print
Print


INTRODUCTION
Diabetic retinopathy (DR) is divided into nonproliferative (NPDR) and proliferative (PDR) forms.1,2 Various growth factors and proteins are produced and increased in the diabetic retina showing ischemia due to the occlusion of micro vessels, and leading to the proliferation of vascular endothelial cells to induce new vessels in various ocular tissues.2 Vascular endothelial cells, glial cells, lymphocytes, monocytes and fibroblasts originated from the retinal pigment epithelium work on these new vessels to induce the proliferation of fibrous tissue. This fibrovascular proliferation can eventually lead to blindness by causing vitreoretinal traction, which results in vitreous hemorrhage or tractional retinal detachment.3 Especially during this process, the retinal pigment epithelium is crucial in the development of DR (Ed- the use of the noun abbreviation form here for the adjective is acceptable) complications by promoting the secretion of various cytokines, which are important in the formation of abnormal proliferation tissue within the eye.4-6 Thus, fibrovascular proliferation is the main cause of this serious retinal complication of diabetes. Fibrovascular proliferation starts from the existing microvessels. Once the vascular basal membrane is degraded in a microvessel, vascular endothelial cells migrate out of the vessel. Therefore, the degradation of the extracellular matrix, i.e., the basal membrane, is crucial in the proliferation of fibrovascular tissue.1,7-10
As a family of zinc-binding, calcium-dependent endopeptidases, matrix metalloproteinases (MMPs) expressed in various tissues and cells are responsible for the dissolution of extracellular matrix. MMPs are expressed in normal or diseased states and are known to participate in extracellular matrix degradation, neovascularization, wound healing, and tumor metastasis.11-14 MMP activity is modulated through interaction with the MMP inhibitors, i.e., tissue inhibitors of metalloproteinases (TIMPs).4,15 Balance in the activities of MMPs and TIMPs through their interactions is very important in the maintenance of extracellular matrixes such as collagen, vitronectin, fibronectin, laminin, elastin and proteoglycan.14,15 Recently, the expressions and changed activities of MMPs were reported in new vessels caused by choroidal neovascularization.8,14 Considering the finding that DR is also a retinopathy caused by fibrovascular proliferation, it is also possible that MMP expression might change in DR and that extracellular matrix degradation would be also accompanied accordingly. This possibility is supported by the recent finding of increased expressions of MMP-2 and -9 in the vitreous body and proliferative tissue in diabetic patients.16-19 Nonetheless, cellular changes of these endopeptidases have not been examined through the molecular biologic approach in an experimental model of diabetes using retinal pigment epithelial (RPE) cells.
In this study, it was hypothesized that a high glucose level would bring about some characteristic changes in RPE cells, which would thereby change the expression of endopeptidases in the retinal pigment epithelium. This hypothesis is based on the assumption that hyperglycemia is the major risk factor for proliferative changes in the retina in diabetic microvascular complications, especially in DR,6,25-27 since the degree and duration of hyperglycemia are related with the development of microvascular complications and because correction of hyperglycemia could delay the development of diabetic complications.20-24 After an experimental model of diabetes was constructed using cultured RPE cells, the effects on the proliferation and migration of RPE cells were examined in this study. Moreover, changes in the expressions of MMPs and TIMPs affecting the activities of MMPs were investigated at the mRNA level by exposing cultured RPE cells to various concentrations of glucose at varying times to observe changes in RPE cells due to glucose and to determine whether these changes are one of the causes of diabetic complications.
MATERIALS AND METHODS
1. Cell culture
The human RPE cell line, CRL 2302, was obtained from the American Type Culture Collection. These cells were cultured in a medium prepared using a 1:1 ratio of Dulbecco's modified Eagle's medium and Ham's F-12, heat-treated at 56℃ for 30 min, and cultured in a medium containing 10% of fetal bovine serum, 4.75g/L of N-2-hydroxyethylpiperazine-N'-2-ethane sulfonic Acid, 100 IU/ml of penicillin and 100ug/ml of streptomycin (Gibco, NY, U.S.A.) by changing the medium once every 2 or 3 days in an incubator (Forma Scientific, OH, U.S.A.) at 37℃ supplied with 95 % air-5 % CO2.
2. Glucose treatment
CRL 2302 cells cultured in a monolayer in a 95 % air-5 % CO2 incubator at 37(C were treated with various concentrations of glucose (5.5 mM, 11.0 mM, 16.5 mM) by varying the exposure times (2 h, 24 h, 14 days). The culture medium was replaced every day.
3. Analysis of cell growth
Cells aliquotted into a 96-well (1 × 10⁴ cells/well) culture plate (Corning, NY, U.S.A.) were cultured with 5.5 mM, 11.0 mM, and 16.5 mM of glucose by varying the exposure time. Once 70% of these cells were confluenced in an 95% air-5% CO2 incubator at 37℃, these cells were treated with 3-(4,5-dimethylthiazol-2-yl)-2, 5-diphenyltetrazolium bromide (MTT) to measure the growth rate by 24 h, 48 h, and 60 h as follows. After discarding the existing medium, 100 µl of new medium and 20 µl of MTT were placed into each well and kept warm at 37℃ for 4 h in humid and dark conditions. The medium containing MTT was discarded. The cells were treated with MTT-formazan crystal dissolved in 50 µl of dimethyl sulfoxide for 10 min. The absorbance was read at 595 nm. As for the baseline dye absorption fraction (baseline absorption), i.e., the blank, a mixture of 100 µl of the medium and 20 µl of MTT was used. The rate of cell growth obtained by 12 h of culturing was used as the control value in each group. The growth rate was calculated using the following equation:

4. Analysis of cell migration
After allotting RPE cells (3 × 10⁴ cells/well) into a 12-well culture plate (Corning, NY, U.S.A.), they were cultured in DMEM/F12 medium for 2 days to observe cellular migration. After exposing the cells in DMEM/F12 medium to 5.5 mM, 11.0 mM, and 16.5 mM of glucose for 2h, 24 h, and 14 days, a 10 × 5 mm rectangle was cut out from the cell monolayer using a razor blade. Each well was washed 4 times using Hank's balanced salt solution (Gibco, NY, U.S.A.) and the suspending cells were removed. The sample was then fixed in 8% paraformaldehyde solution for 5 min at 4℃ and stained using Richardson staining. Cell migration was quantified by measuring the number of cells moved to the exposed rectangle under 30X magnification.
5. Expressions of MMP-2 and -9 and TIMP-1 and -2 using Western blot analysis
In order to determine the amount of MMP2, MMP9, TIMP1 and TIMP2 production, electrophoresis was performed using 10% acrylamide by placing a reducing agent into each sample exposed to glucose at different concentrations and durations. Using Hybond-C extra membrane (Amersham, U.K.), the samples were moved electrically. The sample was treated by shaking in 5% fat milk at room temperature to prevent non-specific binding. It was washed 3 times in Tween Tris-buffered saline (TTBS) for 10 min, treated with the primary antibody for 2 h at room temperature, washed again 3 times in TTBS for 10 min, and treated with the secondary antibody for 10 min at room temperature. The primary antibody for MMP2 and MMP9 was 1:200 polyclonal anti-goat antibody (Santa Cruz Biotechnology, CA, U.S.A.), and that for TIMP1 and TIMP2 was 1:5,000 monoclonal anti-mouse antibody (Oncogene, MA, U.S.A.). The secondary antibody used was horseradish peroxidase labeled anti-goat IgG and horseradish peroxidase labeled anti-mouse IgG 1:5,000 (BioRad, CA, U.S.A.), respectively. The membrane obtained after primary and secondary antibody treatment was treated in enhanced chemiluminescence detection solution (Amersham, U.K.) for 1 min and exposed to Hyperfilm (Agfa, E.C.) for 1 min and 3 min to develop the images. The degrees of enzyme secretion were compared.
6. mRNA expressions of MMP-2 and -9 and TIMP-1 and -2 using RT-PCR
RT-PCR was used to examine changes in the mRNA expressions of MMP-2 and -9 and TIMP-1 and -2. The primers used were designed specific to the genes related with MMP-2 and -9. RNAs were isolated from the cells using TRIzol from Gibco BRL Co. After washing cells with HBSS, the sample was treated using 1 ml of TRIzol 1 ml, 0.4 ml of chloroform was added 10 min later, and the sample was centrifuged at 12,000 rpm for 15 min to obtain RNA from the supernatant. After adding 0.4 ml of isopropanol into the isolated RNAs, the mixture was left at -20℃ for 2 h and centrifuged at 12,000 rpm for 10 min to obtain RNAs in the precipitate. The resulting RNAs were washed with 70% RNase-free alcohol and dissolved in RNase-free tertiary distill water. Then, an absorbance gauge was used to read the absorbance at A260/A280. Reverse transcription was done using a Premix RT-kit (Bioneer, Korea). The total amount of RNAs was 1.5 µg. PCR was done using a 20 µl mixture containing 5 ng of cDNA, 4 pmol of each primer, 0.5 unit of Taq DNA polymerase (Becton Dickinson, NJ, U.S.A.) and 200 µM of dNTP-mix (Boehringer Mannheim, IN, U.S.A.). Reaction was carried out according to each primer at annealing. The PCR byproducts were analyzed by electrophoresis in 1.2% agar gel.
RESULTS
1. Changes in cellular growth according to different concentrations of glucose and exposure time to glucose
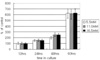
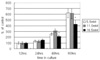
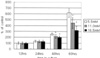
When RPE cells were exposed to 5.5 mM of glucose for 2 h, the rate of cellular growth compared with the control group was increased by 150 ± 18%, 200 ± 20% and 621 ± 80% at 4 h, 48 h and 60 h, respectively. When exposed to 11.0 mM of glucose, the rate was increased by 155 ± 20%, 250 ± 30% and 614 ± 90%, respectively. With 16.5 mM of glucose, the rate was increased by 150 ± 20%, 250 ± 25% and 624 ± 75%. Thus, no significant difference was seen in growth rate according to different glucose concentrations (Fig. 1). When the cells were exposed to 5.5 mM of glucose for 24 h, the rate of cellular growth was increased by 130 ± 18%, 255 ± 20% and 621 ± 80% at 24 h, 48 h, and 60 h, respectively. When exposed to 11.0 mM of glucose, the rate was increased by 129 ± 20%, 314 ± 30%, and 614 ± 90%, respectively. With 16.5 mM, the rate was increased by 148 ± 20%, 213 ± 25%, and 424 ± 75%, respectively. Thus, the degree of proliferation was significantly inhibited after 48 h with 16.5 mM of glucose (Fig. 2). When the cells were exposed to 5.5 mM of glucose for 14 days, the rate of cellular growth compared with the control group was increased by 130 ± 18%, 255 ± 20%, and 621 ± 80% at 24 h, 48 h, and 60 h, respectively. With 11.0 mM of glucose, the rate was increased by 129 ± 20%, 214 ± 30%, and 445 ± 90%, respectively. With 16.5 mM, the rate was increased by 128 ± 20%, 197 ± 25%, and 321 ± 75%, respectively. Thus, the degree of proliferation was significantly inhibited after 48 h with 1.0 mM and 16.5 mM of glucose (Fig. 3).
2. Cellular migration according to exposure time to, and concentration of, glucose
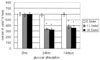
The number of migrated cells when RPE cells were exposed to 5.5 mM, 11.0 mM, and 16.5 mM concentrations of glucose for 2 h was 600 ± 30, 590 ± 28 and 598 ± 28, respectively. At 2 h, there was no significant difference according to the glucose level. When the cells were exposed to glucose for 24 h, the number of migrated cells was 580 ± 30, 340 ± 20, and 330 ± 25, respectively, showing significant inhibition of cell migration with 11.0 mM and 16.5 mM of glucose. When the cells were exposed to glucose for 14 days, the number of migrated cells was 590 ± 30, 380 ± 35 and 360 ± 45, respectively, showing significant inhibition of cell migration with 11.0 mM and 16.5 mM of glucose (Fig. 4).
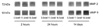
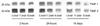
3. Expressions of MMP-2 and -9 and TIMP-1 and -2 seen with Western blot analysis
The results of Western blot analysis after treating retinal epithelia cells at different concentrations of glucose (5.5 mM, 11.0 mM and 16.5 mM) at different exposure times (2h, 24 h, 14 days) showed no significant difference by 2 h in the expressions of MMP-2 and -9 according to different glucose concentrations. However, these expressions were significantly increased according to increasing glucose concentrations by 24 h and 14 days of exposure (Fig. 5). The expressions of TIMP-1 and -2 were not significantly different by 2 h of exposure but were decreased with increasing glucose concentrations by 24 h and 14 days of exposure (Fig. 6).
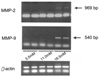
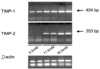
4. mRNA expressions of MMP-2 and -9 and TIMP-1 and -2 using RT-PCR
According to RT-PCR performed to examine the effects of protein expressions on mRNA expressions by 14 days of exposure, the expression of MMP-2 was not significantly different in 5.5 mM and 11.0 mM of glucose but was increased in 16.5 mM. The expression of MMP-9 was increased with increasing glucose concentrations (Fig. 7). With increasing concentrations of glucose, the expression of TIMP-2, the MMP-2 inhibitor, was significantly increased, whereas the expression of TIMP-9, the MMP-9 inhibitor, was not significantly different (Fig. 8).
DISCUSSION
PDR is still a leading cause of blindness, despite leaping advancements made in vitreoretinal surgery, because new vessels in the retina grow into the vitreous cavity to form fibrovascular tissue, resulting in serious complications such as vitreous hemorrhage and tractional retinal detachment.1,2 A fibrous membrane is formed along the retinal surface with tractional retinal detachment due to abnormal proliferation of RPE cells, glial cells, fibroblasts, and macrophages. When this fibrous membrane shrinks under the action of RPE cells and collagenous fibers, the retina is pulled and finally be detached.3,17,18 RPE cells are important in the formation of abnormal proliferative tissue within the eye. They directly participate in the shrinkage of proliferative tissue along with collagenous fibers and promote the secretion of various cytokines, playing a core role in tractional retinal detachment.3-6 Neovascularization, which is one of the important retinal complications in diabetic patients, is seen when various substances within the vessel are released due to the destruction of the blood-retina barrier. At this time, the formation of fibrous proliferative tissue is promoted by RPE cells that have migrated to the vitreous cavity under the actions of various chemical substances, thereby inducing tractional retinal detachment.4,5,9
Believing that the internal limiting membrane, which is a type of basal membrane, acts as a barrier during this series of proliferative processes and that internal limiting membrane injury is an important factor for RPE cells to migrate through the internal limiting membrane, this study proposed the hypothesis that the endopeptidases, MMPs, are important for internal limiting membrane injury.4,5,11,13 It was recently reported that RPE cells release MMPs4,13,15 and that the expressions of MMPs were seen in proliferative tissue and the vitreous body obtained from diabetic patients at the time of surgery for PDR.16-19 Thus, the assumption was made in this study that RPE cells would migrate to the vitreous cavity after the internal limiting membrane is damaged due to increased expressions of MMPs and decreased expressions of TIMPs in RPE cells that are important for the formation of proliferative tissue.10,14
MMPs are a family of enzymes important for tissue differentiation, formation and restoration by dissociating proteins composing extracellular matrixes such as collagen.7,11 Released in their inactive precursor forms, MMPs are activated when some bonds are broken through proteolytic processing and are important in the field of ophthalmology such as for basal membrane degradation, which starts wound healing.11,12 Gelatinases, which come in two types, i.e., MMP-2 (gelatinase A) and MMP-9 (gelatinase B), were reported to dissociate collagen types I, IV, V and VII changed by collagenase.
MMP-9 is produced abundantly during the process of wound epithelialization and decreased drastically when the wound is healed. On the other hand, MMP-2 is activated at a slower rate than MMP-9 but stays activated for a longer period of time.11 Their changes are parallel to the conglomeration of fibroblasts to the wound site; thus, MMP-2 is thought to affect tissue maintenance and scar reconstruction.7,11,14 MMPs are regulated during the production stage and by their specific inhibitors, i.e., TIMPs, which are known to regulate activated MMPs or MMP precursors.4,15 A suitable balance in the interaction of MMPs and TIMPs is very important for the maintenance of extracellular matrixes such as collagen, vitronectin, fibronectin, laminin, elastin, and proteoglycan.14,15 Thus, the assumption was made that internal limiting membrane integrity is also affected when a suitable balance could not be achieved since the internal limiting membrane is also an extracellular matrix. Furthermore, the mRNA and protein expressions of MMPs and TIMPs were confirmed to change with different concentrations of glucose in the experiments of stimulating choroidal endothelial cells, bovine aortic endothelial cells and retinal microvascular cells.8-10 Thus, it was assumed in this study that the expressions of MMPs and TIMPs would change when RPE cells were exposed with glucose.
An experimental model of diabetes was constructed in this study to determine the effects of diabetes on the biochemical and molecular biologic characteristics of RPE cells. The glucose concentrations used in this study were 5.5 mM, which is the physiologic glucose concentration, and 11.0 mM and 16.5 mM, which are twice and three times higher than the physiologic concentration, to the reflect changes in glucose level in diabetic patients.6 In order to reflect the morbidity term of diabetes, RPE cells were exposed to glucose at varying times, i.e., 2h, 24 h, and 14 days. Considering the survival period of RPE cells, 2 h exposure represented acute damage, 24 h, subacute damage, and 14 days, chronic damage.6,9 Cellular proliferation and migration were not affected when the cells were exposed to different levels of glucose for 2 h, whereas they were affected when the cells were exposed to glucose for 14 days, suggesting that the cell characteristics were changed by chronic injury. As for the protein expressions of MMP-2 and -9 and TIMP-1 and -2, when the cells were exposed to increasing glucose concentrations for 14 days, the expressions of MMP-2 and -9 were increased, whereas the expressions of TIMP-1 and -2 were decreased. Furthermore, the mRNA expressions of MMP-2 and -9 and TIMP-1 and -2 were all increased with increasing glucose level. In other words, the balance between MMP-2 and -9 and TIMP-1 and -2 was changed. The expression of TIMP-2 was especially affected by the glucose level. Different post-translational regulation according to different MMPs suggests that the mechanism of RNA feedback due to the protein is differently regulated according to glucose levels during the process of DNA transcribing to RNA and translating to protein. This supports the assumption that glucose stimulation affects extracellular matrix metabolism by affecting the secretion and regulation of MMPs and TIMPs differently than normal conditions. Furthermore, the overexpressions of MMP-2 and -9 eventually affect the destruction of the internal limiting membrane, which is related with the retinopathy seen frequently in diabetic patients.
In the treatment of DR, as there is no specific method to prevent the progression of retinopathy in NPDR, the progression is monitored regularly through observation. Once it progresses to PDR, laser photocoagulation or vitrectomy is performed; nonetheless, poor vision usually results. Thus, it is very important to find a method to prevent the progression of PDR in patients with DR. Through the results of this study, it was confirmed that interactions among MMPs and TIMPs were off balance due to changed expressions of these enzymes in DR, which is believed to be an important factor in the progression of PDR. Thus, vision loss due to PDR may be preventable by maintaining balance between MMPs and TIMPs through inhibition of MMP expressions or induction of TIMP expressions in RPE cells in diabetic patients. Further studies are required to identify the hormones related with MMP and TIMP expressions and to determine the signal transduction system related with these enzymes.
The growth and migration of human RPE cells were inhibited with increasing glucose exposure time and concentration. Western blot analysis of the cells exposed to glucose for 14 days showed increased expressions of MMP-2 and -9, but decreased expressions of TIMP-1 and -2. According to RT-PCR, the mRNA expressions of MMP-2 and -9 were increased with increasing glucose levels. The expressions of TIMP-2, the MMP-2 inhibitor, and TIMP-9, the MMP-9 inhibitor, were increased with increasing glucose levels, although that of the latter was not significant. The experimental model of diabetes in this study confirmed that changes in MMP and TIMP expressions and in post-translational regulation of MMP and TIMP probably caused the proliferation of fibrous vessels by changing extracellular matrix integrity. In other words, it is possible that the progression of DR maybe a result of MMP and TIMP activities becoming unbalanced.
 XML Download