

 PDF
PDF ePub
ePub Citation
 Print
Print


INTRODUCTION
Scanning laser polarimetry (GDx-Nerve Fiber Analyzer [NFA], Laser Diagnostic Technologies, San Diego, CA, USA) can be used to quantitatively assess the thickness of peripapillary retinal nerve fiber layers (RNFL).1-5 Many factors, however, including corneal birefringence, peripapillary atrophy, chorioretinal scarring, and optic disc size, may affect the accurate measurement of RNFL thickness by scanning laser polarimetry, requiring careful interpretation of the results.5-8 For example, scanning laser polarimetry incorporates a proprietary anterior segment compensator device that neutralizes the polarization effects of the cornea, under the assumption that all individuals have a fixed corneal polarization axis of 15 degrees nasally downward. Variation of this axis among individuals can lead to incomplete compensation of corneal birefringence, and posterior retardation can increase with increasing corneal polarization axis. Despite these shortcomings, GDx-NFA has been widely used to identify patients in whom glaucoma is suspected, as well as those with preperimetric glaucoma and glaucomatous eyes. GDx-NFA has been reported to have a sensitivity of 96% and a specificity of 93% in discriminating between normal eyes and those with a variable degree of glaucomatous damage.9 In contrast, using the GDx-NFA parameter called the number, the sensitivity of this technique is 64% and its specificity is 77%,10 whereas using a linear discriminate function, its sensitivity is 74% and its specificity is 92%.11 In the Japanese population, GDx-NFA has been found to have an overall specificity of 66.7% and a sensitivity of 80.9%.12 The clinical usefulness of these findings may be limited by differences in study design, disease severity, and study population characteristics. This diagnostic method therefore requires a race-specific determination of its ability to detect glaucoma in eyes with a variable degree of glaucomatous damage. To our knowledge, there is no useful information to date on the most useful parameters of GDx-NFA software for discrimination among early glaucoma, ocular hypertension and normal controls in Korean individuals. We therefore sought to determine the usefulness of GDx-NFA in Korean subjects, the optimal diagnostic parameters of this technique for detecting early glaucomatous eyes and the association between GDx parameters and visual field indices.
SUBJECTS AND METHODS
We retrospectively reviewed the medical records of 217 consecutive subjects enrolled in the glaucoma service at the Asan Medical Center between January 2001 and June 2002. Subjects were divided into three study groups: 61 early glaucoma patients, 68 ocular hypertensive patients, and 88 normal subjects. For subjects in whom both eyes qualified for study, one eye was randomly selected.
All subjects had visual acuity better than or equal to 20/40, were at least 50 years old, and were free of neurological or systemic disease. All subjects had undergone complete ophthalmologic examinations, Humphrey Glaucoma Hemifield tests (GHT) and GDx-NFA tests. The complete ophthalmologic examination included tests of visual acuity, refraction, pupillary reaction, and extraocular movements, a slit lamp examination, a stereoscopic optic disc examination with a 90-diopter lens, and a fundus examination with an indirect ophthalmoscope.
For GDx-NFA scanning, the ambient lights were on, pupils were not dilated, and the subject's head was placed in as upright a position as possible. Multiple images were obtained for each individual, and the three best images were selected for composite imaging and data analysis. We previously showed that interoperator variability among the three operators in our laboratory was not statistically significant (p = 0.075) and that the difference was lower if a single ellipse drawn by one operator was used in all measurements (p = 0.1528).13 In all composite images, the average standard deviation per pixel was less than 8.0 µm. In order to minimize any interoperator variability, one operator (HWH) drew an ellipse around the inner margin of the peripapillary scleral ring, thereby producing a measurement ellipse that was 1.75 times the diameter of the disc in the peripapillary retina. The sectors of the peripapillary area were divided into superior and inferior segments of 120 degrees each, a nasal segment of 70 degrees, and a temporal segment of 50 degrees. The mean RNFL thickness for all quadrants, as well as for the superior and inferior quadrants along with the superior and inferior ratios (i.e. the ratio of the superior and inferior to the temporal RNFL thickness), and the superior nasal ratio (i.e. the ratio of the superior to the nasal RNFL thickness) were calculated. These ratios were obtained to standardize the measurements and reduce the influence of the optic disc size and the variability of intensity adjustments by the examiners. In addition, symmetry, defined as the ratio of the superior to the inferior quadrant RNFL thickness, was calculated.
Diagnostic criteria for early glaucoma patients consisted of a glaucomatous optic nerve change, open anterior chamber angle with or without intraocular pressure (IOP) elevation over 21 mm Hg, and visual field abnormality based on at least two consecutive and reliable Humphrey GHTs (i.e. outside normal limits, as analyzed by the software system, a mean deviation [MD] equal to or better than -6dB, and a corrected pattern standard deviation [CPSD] outside 95% normal limits),14 regardless of any previous history of antiglaucoma therapy. None of these patients had secondary open-angle glaucoma due to pigment dispersion syndrome, pseudoexfoliation, traumatic anterior chamber angle recession, or other secondary causes.
For ocular hypertension, the inclusion criteria were multiple IOP readings greater than 21 mm Hg with the Goldmann applanation tonometer (GAT), no demonstrable glaucomatous visual field loss in either eye on the Humphrey Field Analyzer (HFA) central 30-2, or 24-2 full threshold test, no evidence of ocular disease known to cause increased IOP, and no concurrent use of any medication (for example, corticosteroids) capable of increasing the IOP. Normal controls had IOPs less than 21 mm Hg on multiple readings and no evidence of glaucomatous optic discs and visual fields as defined by the Baltimore Eye Study.15-16 All subjects had to have rates of false-positive and false-negative responses less than 25%, as well as a 25% fixation loss in visual field testing.
For statistical analysis, the SPSS software package (Version 10.0) was used. Statistical tests included analysis of variance (ANOVA) and linear regression analysis. Sex, age and refraction were adjusted with linear regression. The chi-square test was used for comparison of proportions. GDx-NFA parameters were compared among the three study groups by ANOVA. Post-hoc comparison of GDx parameters between any two groups was performed after Bonferroni correction. A Receiver Operating Characteristics (ROC) curve for each GDx-NFA parameter was obtained to determine the cut-off values that would result in optimal diagnostic sensitivity and specificity. A z-test was employed to determine if the area under the ROC curve of the parameter with the largest area was significantly different from that of each other parameter.17 The association between each GDx-NFA parameter and the visual field indices in early glaucoma was assessed using Pearson's correlation coefficients. A probability less than 0.05 was considered statistically significant.
RESULTS
Demographic data for the three study groups are shown in Table 1. HFA showed that the MD and CPSD in the early glaucoma group were -4.31 dB and 5.05 dB, respectively. There were significant differences among the three groups in these parameters. In contrast, we observed no significant differences among the three study groups in age, sex and refraction.
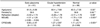
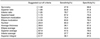
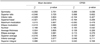
Mean GDx parameters in the three study groups are shown in Table 2. For all parameters except symmetry, the ocular hypertensive patients had values intermediate between the early glaucoma and normal subjects. Between the early glaucoma and normal groups, there were significant differences in superior ratio, inferior ratio, superior/nasal ratio, maximum modulation, ellipse modulation, the number and inferior average.
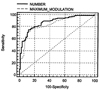
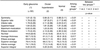
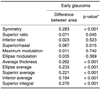
The area under the ROC curve for each GDx-NFA parameter in the early glaucoma group is shown in Table 3. Inferior ratio, maximum modulation, ellipse modulation and the number had areas larger than 0.8. The ROC curve of the number had the largest area under the ROC curve at 0.854. Differences between the ROC curve of the Number and curves of the other parameters are shown in Table 4. When we compared the ROC curves of inferior ratio, maximum modulation, and ellipse modulation with that of the number, we observed no statistical differences.
Using the ROC curves for each GDx parameter, we calculated the optimal cut-off values that best differentiated the early glaucoma and normal groups (Table 5). Of all parameters, the number gave the optimal sensitivity (80.3%) and specificity (80.7%), at a cut-off value of 26.9.
Pearson correlation coefficients were calculated to assess the association between each GDx-NFA parameter and the visual field indices in early glaucoma (Table 6). Symmetry was positively correlated with CPSD (γ = 0.269, p = 0.036), but none of the other GDx-NFA parameters was significantly correlated with visual field indices in early glaucoma.
DISCUSSION
GDX-NFA measurements have been shown to bequantitative and reproducible.1-5 Its retardation values have been reported to be significantly lower in glaucomatous and ocular hypertensive eyes than in healthy eyes, although there was considerable overlapin their values among Caucasian populations.9-12,18-20 In the present study, we found that all RNFL thickness values based on GDx-NFA, except for superior integral, were statistically different among the three groups of subjects. Eyes with ocular hypertension showed thickness values intermediate between those of normal subjects and patients with early glaucoma.
Using scanning laser polarimetry as measured by the Laser Diagnostic Technologies NFA II, there were significant differences in RNFL parameters between normal subjects and patients with glaucoma, and between normal subjects and patients suspected of having glaucoma (i.e. those with IOP greater than 21 mmHg but with normal visual fields).22 In our study, however, using a post-hoc, two-group comparison with Bonferroni's correction, only a few GDx-NFA parameters (superior average, the number, and superior ratio) differed significantly between patients with ocular hypertension and normal subjects. Although our results also showed overlap in the range of RNFL thicknesses among the three groups, most of the GDx-NFA parameters (i.e. superior ratio, inferior ratio, superior/nasal, maximum modulation, ellipse modulation, the number, and inferior average) differed significantly between normal subjects and patients with glaucoma. The discrepancies between these two studies may have been due to differences in study design, age, race and sample size.
The overlap in RNFL values among the three groups may stem from a large physiological variation in the RNFL thickness among healthy and glaucomatous individuals.18-20 In addition, the RNFL thickness threshold, which causes functional visual field defects, differs among individuals, such that the amount of RNFL damage necessary for visual field loss may vary among individual subjects.21 This overlap may also have been due to retardation noise, since corneal polarization was not fully compensated for in some eyes by GDx-NFA.
Our study was confined to Korean patients over the age of 50 at an early stage of glaucoma, based on a visual field index (MD < -6 dB). Our selection criteria for inclusion into the study were arbitrary, but were based on findings that the incidence of glaucoma increases over age 50 and that early detection of glaucoma still remains the most difficult challenge in practice.
We used ROC curves to describe the ability of each GDx-NFA parameter to differentiate glaucomatous from healthy eyes. An area under the ROC curve of 1.0 represents perfect discrimination, whereas an area of 0.5 represents a 50% loss in the ability to discriminate. We found that the GDx-NFA parameters with optimal ability to discriminate between early glaucomatous and normal eyes were the number, maximum modulation, ellipse modulation and inferior ratio. Two ROC curves of number and maximum modulation in early glaucoma are shown in Figure 1. These findings were consistent with those in Western populations, in which these parameters, all of which use ratios rather than absolute values, were found to give optimal sensitivity and specificity.9-12 Our findings confirm that parameters using ratios (e.g., modulation and inferior ratio) were more valuable than absolute thicknesses in discriminating early glaucoma from normal controls, and in minimizing the effects of wide variations in absolute retardation values among normal and glaucomatous individuals.
We arbitrarily selected cut-off points to determine the best sensitivity/specificity relationship for each GDx-NFA parameter. These allowed us to formulate cut-off points specific to the Korean population that provide optimum sensitivity and specificity. Using the Number, which provided the largest area under the ROC curve, a cut-off point of 26.9 gave the best combination of sensitivity (80.3%) and specificity (80.7%) in the detection of early glaucoma.
Use of a cut-off point that provides the best combination of sensitivity and specificity in a given specific population is desirable in the detection of early glaucoma. A cut-off point of 32 for the number yielded a specificity of 84% and a sensitivity of 79%, whereas a cut-off point of 26.9 yielded a specificity of 82% and a sensitivity of 62%.10 These results suggest that the optimal cut-off value, along with its sensitivity and specificity, can differ according to study design, severity of disease, and study population. We therefore suggest, as in this study, that a determination of optimal GDx-NFA parameters be performed in any desired study population.
An additional purpose of this study was to identify the structural parameters derived from GDx-NFA that were associated with visual field indices derived from HFA in patients with early glaucoma without addressing the temporal relationships between the two. We found that symmetry was statistically correlated with CPSD in early glaucomatouseyes. The highest correlation between GDx-NFA parameters and visual field indices in patients with glaucoma was between the number and MD (r = 0.56 to 0.57, p < 0.05).23 Symmetry, which represents the ratio of the average 1500 thickest pixels in the superior quadrant divided by the average of the 1500 thickest pixels in the inferior quadrant, is therefore expected to be altered at an early stage of localized RNFL damage, either in the superior or inferior hemiretina. Early localized structural damage in RNFL should also lead to abnormalities in the CPSD since it reflects loss of visual sensitivity in the localized area. This finding is consistent with the results of a study showing that NFL photograph grading identified localized RNFL defects that correlated well with CPSD.24 Further longitudinal studies of visual field and GDx-NFA measurements on ocular hypertensive and early glaucomatous eyes will elucidate the correlation between changes in structural parameters and glaucomatous visual field defects. These correlations may be enhanced if the interindividual variability in corneal polarization can be taken into account using a variable corneal compensator (GDx-VCC).
The limitations of this study included the derivation of our results from cross-sectional, rather than longitudinal, data. A longitudinal follow-up of the glaucoma suspects is needed to confirm whether those eyes we identified with abnormal GDx-NFA parameters show early development of conventional visual field defects based on HFA. Another limitation of this study was the possible effect of different disc sizes, which were not accounted for in our GDx-NFA measurements of RNFL thickness. We attempted to minimize this effect by comparing the retardation values of studied eyes with those of normal controls, as both were equally affected by this inherent error in the device. Moreover, we did not test the pattern of early glaucomatous damage in focal, generalized, or variable visual fields.
In summary, we found statistical differences in mean measurements of structural GDx-NFA parameters in early glaucomatous eyes, ocular hypertensive eyes and normal eyes among age-matched Korean individuals over age 50. Although there are large RNFL thickness variations in this population, the use of optimal cut-off values for the Number parameter may provide optimal sensitivity and specificity in the detection of early glaucoma. In conclusion, GDx-NFA is a helpful technique for discriminating among early glaucoma, ocular hypertension and normal patients, and is therefore useful in the detection and treatment of glaucoma.
 XML Download