

 PDF
PDF ePub
ePub Citation
 Print
Print


INTRODUCTION
Obesity is a worldwide epidemic that leads to the development of chronic metabolic disorders, such as type 2 diabetes (T2D), cardiovascular disease, and non-alcoholic fatty liver disease (NALFD) (123). NAFLD is a condition where fat, mainly triglycerides (TG), accumulates in the hepatocytes of patients who have not consumed excessive amounts of alcohol (4). Estimates of the prevalence of NAFLD range from 6.3% to 33%, depending on the population (56), and are expected to rise as obesity rates increase, populations become older, and physical activity levels decrease (4). Moreover, there is an increased prevalence of NAFLD in T2D patients (7), and its severity may be aggravated by T2D (89). However, beyond epidemiology, there are many challenges in the diagnosis and treatment of NAFLD.
As patients with NAFLD are mostly asymptomatic, the gold standard for its diagnosis is based on liver biopsy, which is highly invasive and expensive. Alternatively, imaging techniques, such as ultrasound (US), computed tomography, and magnetic resonance imaging, are used for NAFLD diagnosis (10). Among these methods, abdominal US is commonly used due to its relatively low expense. However, the major drawbacks of US include its inability to quantify liver fat amounts and its variability due to examiner techniques. Recently, a novel physical index, called controlled attenuation parameter (CAP), has been developed based on the properties of ultrasonic signals examined by transient liver elastography (Fibroscan®; Echosens, Paris, France). CAP relies on the concept that fat attenuates US propagation, and it non-invasively quantizes this ultrasonic attenuation at the center frequency of the FibroScan® M probe (3.5 MHz) (11). Furthermore, a large prospective study has demonstrated the accuracy of CAP in diagnosing NAFLD (12).
Despite the increasing number of patients being diagnosed with NAFLD, there are no optimal therapeutic agents to manage NAFLD. The American Association for the Study of Liver Diseases (AASLD) and the American Gastroenterological Association (AGA) have recommended vitamin E supplementation for NAFLD patients without diabetes, and thiazolidinediones (TZDs) for NAFLD patients with diabetes (5). TZDs are potent peroxisome proliferator-activated receptor gamma agonists that lower blood glucose levels by ameliorating systemic insulin sensitivity and inflammation (13). Recently, a novel TZD called lobeglitazone was developed, and is currently being prescribed for T2D in Korea (14). The efficacy and safety of lobeglitazone in T2D has been well-investigated (151617). To identify better treatment options for T2D patients with NAFLD, we investigated the effects of lobeglitazone on these patients by analyzing alterations in their CAP values using transient liver elastography, as well as in their glycemic, lipid, and liver profiles.
MATERIALS AND METHODS
Study patients
Participants were considered eligible for the study if they had been diagnosed with T2D and were ≥ 20 years old. Participants also had to be drug-free (or naïve for more than three months) with HbA1C values between 7.0% and 8.5% (53.0 and 69.4 mM) or taking a stable dose of metformin with HbA1C values between 7.0% and 9.0% (53.0 and 74.9 mM) at the time of screening. Subjects were excluded if they consumed > 210 g/week of alcohol for males and 140 g/week for females or were positive for hepatitis B or C, type 1 diabetes, or secondary diabetes. Subjects with a history of renal dysfunction (serum creatinine ≥ 1.5 mg/dL for males and 1.4 mg/dL for females), heart failure (New York Heart Association [NYHA] class III and IV), uncontrolled heart arrhythmia, or cardio-cerebral events (unstable angina, myocardial infarction, transient ischemic attack, cerebral infarct, or hemorrhage) within the 12-week period prior to screening were excluded. Subjects with a history of corticosteroid treatment for at least 14 days within the two-month period prior to screening or those with cancer treatment, including chemo- or radiotherapy within two years, were also excluded. Pregnant women and nursing mothers were excluded. Of the remaining T2D subjects, those with NAFLD, as confirmed by a CAP value ≥ 250 dB/m, were enrolled in this study.
Study design
A 24-week, prospective, single-arm, open-label clinical trial (ELLEGANCE [Efficacy and Safety of the Use of LobEGlitazone in T2D PAtients with Non-alcoholiC Fatty LivEr Disease] trial) was conducted in five tertiary medical centers in the Korea to evaluate the efficacy and safety of using once-daily lobeglitazone (0.5 mg) to treat T2D patients with NAFLD. If a patient’s HbA1C value exceeded 8.5% at 12 weeks after treatment, rescue medication (2.0 mg glimepiride) was introduced. The primary endpoint was change in CAP, as measured by transient elastography (FibroScan®), from baseline to the end of 24-week lobeglitazone treatment. The secondary endpoints were changes from baselines in multiple values and parameters, including HbA1c, fasting plasma glucose (FPG), glycated albumin (GA), liver enzymes (aspartate transaminase [AST], alanine transaminase [ALT], and gamma glutamyl transferase [γGTP]), lipid profile components (low-density lipoprotein cholesterol [LDL-C], high-density lipoprotein cholesterol [HDL-C], total cholesterol [TC], and TG), and high-sensitivity C-reactive protein (hsCRP). In addition, alterations from baseline in the homeostasis model assessment of insulin resistance (HOMAIR), which was quantified based on FPG and fasting insulin levels, were used as secondary endpoints. During the study period, patients visited the clinic for initial screening and baseline measurement, in addition to weeks 12 and 24. During both the initial screening and at 12- and 24-week visits, fasting blood samples for all subjects, as well as urine pregnancy tests for female participants of child-bearing age, were taken for laboratory assessment. At the baseline visit, CAP and liver US were performed. At the 24-week visit, CAP was performed again. Before entering the study, we assessed the daily dietary and exercise routines of all participants, and then, they were educated and asked to maintain a calorie limited-diet while performing more than 150 min/week of medium-intensity aerobic exercise.
Laboratory and imaging studies
We used a hexokinase method to measure FPG levels and an enzymatic colorimetric method to measure TG, TC, LDL-C, and HDL-C levels. Serum levels of liver enzymes and other profiles were measured by standard methods at each hospital. Ion-exchange high-performance liquid chromatography (Bio-Rad Laboratories, Hercules, CA, USA) was used to measure HbA1C levels. The serum GA level was measured by an enzymatic method, using Lucica GA-L reagents (Asahi Kasei Pharma Co., Tokyo, Japan) and a Hitachi 7699 P module autoanalyzer (Hitachi Instruments Service, Tokyo, Japan).
We used the right lobe of the liver through intercostal space to obtain CAP values and liver stiffness measurements (LSM), as described previously (18). For the CAP assessment, we used a Fibroscan 501® (Echosens), placing the tip of the M probe on the skin between the ribs, over the right lobe of the liver. To ensure an accurate CAP value, we only calculated US attenuation when the matched LSM was valid, while attempting to collect ≥ 10 valid LSMs. A success rate of ≥ 60% and a ratio for the interquartile range (IQR) to the median value of LSM (IQR/MLSM) of ≤ 30% were considered reliable and used for the final analysis. CAP values were measured by a trained operator following the manufacturer’s instruction. The steatosis grade (S) was determined using the following CAP-cutoff values that were previously reported by Sasso et al. (11): 238 dB/m for S ≥ 1, 260 dB/m for S ≥ 2, and 293 dB/m for S = 3. US scanning was performed by professional radiologists. Because US was not performed to investigate the study endpoint and merely used to rule out other liver disorders, the US methods and devices were not standardized.
Safety was assessed at every visit via patient-reported adverse events, physical examination, and regular monitoring of multiple parameters, including vital signs and laboratory test results. Peripheral edema, which was defined as a > 10% increase in ankle circumference from baseline, was also monitored, along with pitting edema.
Statistical analyses
All continuous variables were expressed as the mean ± standard deviation (SD). The AST, ALT, and TG values were log transformed, because value distributions were skewed. Student’s t-tests and Pearson’s χ2 tests were used for continuous and categorical variables, respectively, to evaluate any differences according to lobeglitazone responsiveness. A responder to lobeglitazone was defined as any individual who showed a decrease in CAP after treatment. Changes in clinico-laboratory parameters, including CAP and HbA1C values, after lobeglitazone treatment were evaluated using a paired t-test. We performed correlation analyses to examine the relationship between changes in CAP values and clinico-laboratory parameters at baseline and after treatment. Multivariate linear regression analysis was performed to assess the association between CAP value changes and various clinico-laboratory parameters. The results are expressed as values of standardized (STD) β-coefficients and P values. A two-sided P value < 0.05 was considered significant. All statistical analyses were conducted using SPSS for Windows software (version 20.0; SPSS Inc., Chicago, IL, USA).
Ethics statement
This study complied with the Declaration of Helsinki, and is registered at clinicaltrials.gov. The registration identification number is NCT02285205. The clinical trial protocol was approved by the Institutional Review Board of each center. All patients in the present study provided their written informed consent.
RESULTS
Baseline characteristics of the study population
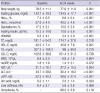
Of the 50 enrolled patients, 43 had completed the study by week 24 (Fig. 1). The main reason for drop-out was an outbreak of Middle East Respiratory Syndrome (MERS) that occurred in Korea at the time of clinical trial. Since the drop-out participants feared visiting the hospital, they failed to conform to the study schedule. Analysis of baseline characteristics showed that the participants had a mean age of 52 years, body mass index (BMI) of 27.5 kg/m2, and HbA1C of 7.4% (57.4 mM) (Table 1). The average levels of HOMAIR, AST, ALT, and γGTP were 5.5 ± 4.1 IU/L, 31.7 ± 16.1 IU/L, 43.7 ± 28.0 IU/L, and 52.3 ± 40.2 IU/L, respectively. The mean CAP value was 313.4 ± 30.9 dB/m, and the mean LSM value was 6.4 ± 2.7 kPa. At baseline visit, about 53% of the patients were prescribed and, reportedly, taking metformin.
Fig. 1
A flow chart illustrates the disposition of subjects participating in the ELEGANCE study.
ELEGANCE = Efficacy and Safety of the Use of LobEGlitazone in T2D PAtients with Non-alcoholiC Fatty LivEr Disease.
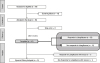
Table 1
Characteristics of study population according to patient responsiveness to lobeglitazone
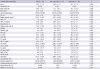
BMI = body mass index, NL = normal, WC = waist circumference, HOMAIR = homeostasis model assessment of insulin resistance, AST = aspartate transaminase, ALT = alanine transaminase, γGTP = gamma glutamyl transferase, TC = total cholesterol, HDL-C = high-density lipoprotein cholesterol, TG = triglycerides, LDL-C = low-density lipoprotein cholesterol, WBC = white blood cell, hsCRP = high sensitivity C-reactive protein, CAP = controlled attenuation parameter.
*log transformed.
Changes in hepatic steatosis evaluated by CAP after lobeglitazone treatment for 24 weeks
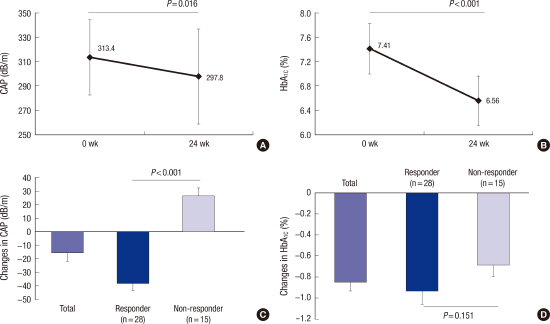
After 24 weeks of treatment with lobeglitazone, the mean CAP value significantly decreased by 5.0%, from 313.4 ± 30.9 dB/m to 297.8 ± 39.1 dB/m (P = 0.016); the mean HbA1C value was reduced by 11.1%, from 7.4% ± 0.4% (57.9 ± 4.9 mM) to 6.6% ± 0.4% (48.5 ± 4.8 mM) (P < 0.001) (Figs. 2A and 2B). Among the 43 participants, 28 (65.1%) showed significant decreases in their CAP values after the 24-week lobeglitazone treatment, compared with their CAP values at baseline; therefore, the select 28 were defined as lobeglitazone responders.
Fig. 2
Changes in CAP (A) and HbA1C (B) values following lobeglitazone treatment for 24 weeks and changes in CAP (C) and HbA1C (D) values according to patient responsiveness to lobeglitazone, as assessed by CAP, are shown. Values are presented as mean ± standard deviation (SD).
CAP = controlled attenuation parameter, wk = week.
To assess whether the improvement in hepatic steatosis was associated with better glycemic control, we examined changes in CAP and HbA1C values in patients according to their lobeglitazone responsiveness (Figs. 2C and 2D). After the 24-week treatment, the mean CAP value in the lobeglitazone-responder group decreased from 320.9 dB/m to 282.6 dB/m, whereas the mean CAP value in the lobeglitazone-non-responder group increased from 299.4 dB/m to 326.0 dB/m. Regarding glycemic control, reductions in HbA1C levels were not significantly different between responders (from 7.4% [57.4 mM] to 6.5% [47.5 mM]) and non-responders (from 7.4% [57.4 mM] to 6.8% [50.8 mM]) (P = 0.151). These data indicate that the improvement in hepatic steatosis by lobeglitazone is independent of its glucose-lowering effect.
Changes in glycemic, lipid, and hepatic profiles after lobeglitazone treatment for 24 weeks
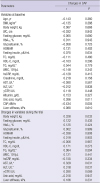
Among secondary endpoints, the 24-week treatment with lobeglitazone significantly improved glycemic parameters, such as GA and the fasting levels of glucose and insulin (P < 0.001) (Table 2). Insulin resistance, as assessed by HOMAIR, was ameliorated from 5.5 to 3.4 by lobeglitazone treatment. Among lipid profile components, lobeglitazone treatment significantly increased HDL-C (P = 0.001) and decreased TG levels (P = 0.019). However, TC and LDL-C levels did not change. All components of the hepatic profile, including AST, ALT, and γGTP, showed significantly decreased levels after 24 weeks of treatment (P < 0.01). In addition, LSM and hsCRPs values were marginally decreased, whereas average body weight increased by 1.4 kg after lobeglitazone treatment. At the 24-week time point, drug compliance was 98.2%.
Table 2
Changes in glycemic, lipid, and liver profiles by lobeglitazone treatment for 24 weeks
HOMAIR = homeostasis model assessment of insulin resistance, TC = total cholesterol, HDL-C = high-density lipoprotein cholesterol, TG = triglycerides, LDL-C = low-density lipoprotein cholesterol, WBC = white blood cell, hsCRP = high-sensitivity C-reactive protein, AST = aspartate transaminase, ALT = alanine transaminase, γGTP = gamma glutamyl transferase.
*log transformed.
Clinical and biochemical parameters associated with changes in hepatic steatosis
To investigate whether any clinical and biochemical parameters were associated with lobeglitazone responsiveness, baseline characteristics of the study population were stratified by responsiveness (Table 1), followed by two-step correlation and linear regression analyses with three statistical models of independent variables (Tables 3 and 4). These analyses showed that the baseline CAP values were higher in patients who responded to lobeglitazone (320.9 ± 31.0 dB/m) than those who failed to respond (299.4 ± 26.3 dB/m) (P = 0.028). Other parameters did not show any association with lobeglitazone responsiveness.
Table 3
Correlation analyses between changes in CAP values and clinico-laboratory parameters
CAP = controlled attenuation parameter, BMI = body mass index, WC = waist circumference, HOMAIR = homeostasis model assessment of insulin resistance, TC = total cholesterol, HDL-C = high-density lipoprotein cholesterol, TG = triglycerides, WBC = white blood cell, hsCRP = high-sensitivity C-reactive protein, AST = aspartate transaminase, ALT = alanine transaminase, γGTP = gamma glutamyl transferase.
*log transformed.
Table 4
Multiple linear regression models for factors associated with changes in hepatic steatosis, as assessed by CAP
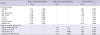
Model 1: adjusted for age, sex, HbA1c, body weight, BMI, waist circumference, liver stiffness, WBC, AST, ALT, γGTP, creatinine, uric acid, fasting glucose, albumin, TC, HDL-C, TG, hsCRP, Glycoalbumin, HOMAIR, metformin use, and CAP. Model 2: adjusted for age, sex, changes in following variables (HbA1C, body weight, liver stiffness, AST, ALT, γGTP, uric acid, fasting glucose, TG, hsCRP, and HOMAIR). Bold values indicate statistical significance.
BMI = body mass index, STD β = standardized β, CAP = controlled attenuation parameter, WBC = white blood cell, AST = aspartate transaminase, ALT = alanine transaminase, γGTP = gamma glutamyl transferase, TC = total cholesterol, HDL-C = high-density lipoprotein cholesterol, TG = triglycerides, hsCRP = high-sensitivity C-reactive protein, HOMAIR = homeostasis model assessment of insulin resistance.
*log transformed.
The first-step correlation analyses between changes in CAP values and various baseline parameters also demonstrated that patients with higher CAP values tended to have larger CAP decrements after lobeglitazone treatment (r = −0.434, P = 0.004). Moreover, uric acid levels were positively correlated with changes in CAP values (r = 0.386, P = 0.011). The second-step correlation analyses further showed that changes in body weight, as well as AST and ALT levels were significantly correlated with changes in CAP values (P < 0.05). These correlations indicate that people with less of an increase in body weight, or AST and ALT levels, after 24 weeks were also likely to show improvements in hepatic steatosis by lobeglitazone treatment.
For multivariate linear regression analyses, a change in CAP value following lobeglitazone treatment was used as a dependent factor, and the baseline variables were adjusted (Model 1). Changes in CAP values were independently associated with baseline CAP and LSM values, white blood cell (WBC) counts, ALT, and γGTP levels, and the use of metformin. Using such analyses, we would expect CAP decrements after lobeglitazone treatment in subjects with higher baseline levels of CAP, WBC, and ALT, as well as metformin users; on the other hand, we would expect non-responsiveness to lobeglitazone in those who have higher baseline LSM values and γGTP levels. Model 2, which included changes in clinico-laboratory parameters, showed that CAP value changes were only independently associated with alterations in ALT levels after 24 weeks of treatment (STD β = 2.15; P = 0.039). A combined model revealed that CAP values at baseline (STD β = −2.23), the use of metformin (STD β = −2.16), and alterations in ALT levels (STD β = 2.59) and LSM values (STD β = 2.39) were all significant determinants in the changes in CAP values (P < 0.05).
DISCUSSION
There is accumulating evidence regarding the serious complications and mortality of NAFLD and its large burden on public healthcare systems (19). However, optimal strategies for the prevention and treatment of NAFLD, particularly in the context of glucose metabolism, have not yet been fully investigated. Guidelines put forth by the AGA and the AASLD have recommended that TZD pioglitazone be used to treat patients with biopsy-proven, non-alcoholic steatohepatitis (NASH) (520). Therefore, we hypothesized that lobeglitazone, a novel TZD, could alleviate hepatic steatosis and improve hepatic function in T2D patients with CAP-proven NAFLD. In this multicenter, prospective, and exploratory trial, transient liver elastography assessed that a 24-week treatment with lobeglitazone had significantly ameliorated hepatic steatosis in T2D patients with NAFLD, independent of glycemic control. Lobeglitazone treatment also resulted in improved glycemic profiles with reduced HbA1C and HOMAIR values, lipid profiles with increased HDL-C and decreased TG levels, and liver profiles with decreased AST, ALT, and γGTP levels. Multiple linear regression analyses further demonstrated that hepatic fat reduction by lobeglitazone was independently associated with baseline CAP values, metformin use, and changes in LSM and ALT levels.
Several clinical studies have investigated the effects of anti-diabetic TZDs on NAFLD (2122232425). Ratziu et al. (22) reported that rosiglitazone ameliorates hepatic steatosis and aminotransferases, but not necroinflammation or fibrosis. A randomized clinical trial (RCT) conducted with 55 NASH patients who had impaired glucose tolerance or T2D, showed that pioglitazone treatment improves liver enzyme profiles and NASH histology, but not fibrosis (23). Moreover, the trial also found that 73% of the pioglitazone-treated, compared with 24% of the placebo-treated, NASH patients showed improvement. Another RCT, conducted with 61 non-diabetic NASH patients, showed that a 12-month treatment with pioglitazone does not improve steatosis, but ameliorates hepatocellular injury and fibrosis, compared with placebo treatment on NASH patients (25). However, the Pioglitazone versus Vitamin E versus Placebo for the Treatment of Nondiabetic Patients with Nonalcoholic Steatohepatitis (PIVENS) trial, which is a multicenter RCT of 247 non-diabetic patients with NASH, showed that 69% of pioglitazone-treated patients, compared with 31% of placebo-treated patients, achieved improvements in hepatosteatosis, as assessed by histology (P < 0.001) (24).
In this study, we showed that 65% of NAFLD patients responded to lobeglitazone treatment, which is comparable to the 69% improvement in steatosis by pioglitazone treatment that was observed in PIVENS trial. Interestingly, a recent RCT meta-analysis showed that TZDs improve hepatic steatosis and inflammation, but not fibrosis (26). Similarly, in this study, we demonstrated that lobeglitazone treatment in NAFLD patients improved hepatic steatosis, as assessed by CAP, and liver enzyme profiles, as assessed by aminotransferase and γGTP levels, but not liver fibrosis, based on measurements of liver stiffness. Because this was not a liver-biopsy proven study, we could not assess alterations in hepatic inflammation and hepatocellular ballooning following treatment. Regarding CAP, previous studies have analyzed the association of CAP values with liver histology, particularly in NAFLD patients with high-grade steatosis and elevated BMI, and have verified the utility of CAP as a non-invasive tool for diagnosing and monitoring NAFLD patients (27282930). However, despite its relatively high accuracy in detecting hepatic steatosis, the agreement between histologic analysis and CAP in hepatic fat quantification varies among individuals with mild steatosis (27). Thus, for our study, we recruited T2D subjects with NAFLD using a higher cut-off CAP value (250 dB/m).
A previous study had suggested that better glycemic control affects improvement in fatty liver in T2D patients in response to drug treatment (31). Thus, it could be argued that improvement of glycemic control alone might be responsible for reduced hepatic steatosis. To address this concern, we, in our current study, classified patients into two groups according to their lobeglitazone responsiveness. During the 24-week trial, two subjects, one in the responder group and the other in the non-responder group, received 2.0 mg glimepiride for rescue therapy. With the exception of these two subjects, participants showed improved glycemic control, as assessed by HbA1C and GA levels. Interestingly, although CAP values were only significantly reduced in the responder group, HbA1C values were significantly reduced in both the responder and non-responder groups. These data suggest that the reduction in hepatosteatosis is independent of the degree of glycemic control.
There have been studies that investigate the pharmacologic mechanisms of TZDs in altering fat content and adipocytes (13), and these mechanisms are thought to positively affect the distribution of fat mass and the proliferation of adipocytes resulting in weight gain (32). Nevertheless, TZDs have also been shown to reduce liver fat content and enhance peripheral tissue glucose uptake (31). In this regard, the negative side effects of TZDs on weight gain should be viewed in a balanced manner. Previous studies have shown that pioglitazone treatment increases body weight between 2.5 and 4.7 kg, depending on the study (232425). In our study, lobeglitazone treatment showed a lower increase in the average body weight of 1.4 kg (from 76.5 ± 11.1 kg to 77.9 ± 11.8 kg [P = 0.001]), which is similar to the weight gain, ranging from 0.89 to 1.48 kg, that was observed in other clinical trials using 0.5 mg/day lobeglitazone (151617).
In this study, we identified predictive factors that were associated with lobeglitazone responsiveness, and found that individuals with higher values of CAP, WBC, and ALT, and lower values of LSM and γGTP at baseline showed greater reductions in hepatic fat following lobeglitazone treatment. Although most previous trials with TZDs did not analyze predictors of responsiveness, a trial with rosiglitazone showed that responders have lower baseline γGTP levels and higher baseline amounts of steatosis than non-responders (22), which is consistent with our findings. Similar to previous studies (2225), we also observed greater reductions in the ALT levels of responders, compared with those observed in non-responders, following treatment. Previous studies have also shown that responders show greater increments in serum adiponectin levels after TZD treatment than non-responders (2223). Furthermore, Ratziu et al. (22) reported greater reductions in insulin levels in responders to rosiglitazone than in non-responders, which we did not observe in our trial. Such difference was likely due to the fact that 100% of patients in our study had diabetes, whereas only 32% of the patients in the Ratziu et al. (22) study had diabetes. Moreover, our multiple regression analysis demonstrated that patients treated with metformin and lobeglitazone showed a greater reduction in hepatic steatosis than patients treated with lobeglitazone alone. Previous RCTs have shown inconsistent effects using metformin alone to treat NAFLD (533); thus, the combination of metformin and lobeglitazone may synergistically act to reduce hepatic fat. One plausible explanation could be that they act together on the pathogenic heterogeneities in NAFLD. For example, lobeglitazone may play a role in decreasing the availability of plasma fatty acids arising from adipose tissue through abated lipolysis and the positive distribution of fat mass; on the other hand, metformin may activate either fatty acid oxidation or lipophagy, as well as mitophagy, via upregulation of the adenosine monophosphate kinase and/or sirtuin 1 pathways (3435). In addition, metformin may ameliorate the adverse effects of weight gain caused by TZD treatment.
The present study has some limitations that should be addressed in future studies. Lobeglitazone is a novel TZD; thus, its long-term safety in treating patients with NAFLD has not been established. Moreover, findings from the current study should be taken with some caution in that our clinical trials included a relatively small number of participants, without having any quality control for CAP measurements conducted by the five centers. Additionally, we did not perform liver biopsy, which is the gold standard method, to evaluate the status of NAFLD because it is a highly invasive and costly procedure. Furthermore, our study does not clearly show how lobeglitazone works on NAFLD. Finally, we performed a single-arm trial without a placebo or an active arm. However, even with these limitations, the current study has several strengths: First, we conducted a study with the novel drug lobeglitazone to assess its additional benefits on NAFLD in T2D patients. Second, to the best of our knowledge, this is the first trial to demonstrate that CAP can be used as a simple, non-invasive tool to quantify and monitor changes in liver fat content during intervention. Finally, we identified several parameters that may be used to predict NAFLD-patient response to lobeglitazone treatment.
In conclusion, we investigated the effects of the anti-diabetic drug lobeglitazone on T2D patients with NAFLD, using transient liver elastography with CAP and gluco-metabolic profile analysis, and found that the method was effective not only in lowering glucose levels but also in reducing intrahepatic fat content. Furthermore, increased steatosis grade and metformin use in patients at baseline, as well as decreased ALT and LSM levels after treatment, were all reliable factors in predicting responsiveness to lobeglitazone. Together, our data indicate that lobeglitazone is a valid, novel therapeutic that should be used to treat NAFLD patients with T2D.
 XML Download