

 PDF
PDF Citation
 Print
Print


INTRODUCTION
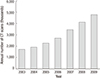
The number of computed tomography (CT) examinations has been rapidly increasing due to the diagnostic usefulness and technical development. Worldwide, the number of CT scans increased from 1-3 examinations per 1,000 in the human population between 1977 and 1980 to approximately 35 examinations per 1,000 in the human population between 1997 and 2007 (1234). In Korea, there were 1.7 million CT examinations in 2003, and with a rapid increase to 4.8 million examinations in 2009 (Fig. 1) (56).
The concern for risks from increased radiation exposure is also increasing because CT examinations are the major source of radiation exposure (78). In 2006, the US National Council on Radiation Protection and measurements (NCRP) reported that while CT constitutes only 17% of all radiologic and nuclear medicine examinations, it accounts for approximately 49% of the collective effective radiation dose due to the relatively high dose per examination (9). Under most circumstances, the risk to an individual patient for developing a malignant tumor due to the CT radiation is low and acceptable compared to the substantial benefit of the CT examination. However, the large number of patients exposed suggests that even a small individual risk can cause a relatively large number of cancer developments (11011). Also, in pediatric patients, the lifelong amount of potential radiation exposure is very considerable (12131415).
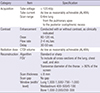
As radiologists have a major role regarding radiologic examinations, we must assure proper radiation dose and good image quality in order to optimize CT examinations according to the general principles of “as low as reasonably achievable (ALARA)” (16171819). For these goals, many countries have implemented continuing education policies with several countries announcing specific guidelines for CT scans, such as The American College of Radiology Practice Guideline and the European Guideline on Quality Criteria for CT (24). Also in Korea, the Korean Society of Thoracic Radiology (KSTR) established the first thoracic CT guideline in 2008 (Table 1) (20). Therefore, the purpose of our study is to analyze changes of thoracic CT protocols and technical parameters between 2007 and 2012, before and after the establishment of the thoracic CT guideline.
Table 1
Summary of the KSTR thoracic CT guideline in 2008 (20)
![]()
MATERIALS AND METHODS
We retrospectively reviewed outside hospital CT scans, one group from a one-month period in May 2007 and the other group from a one-month period in January 2012. All of the CT scans were registered on a picture-archiving communication system (PACS) in our hospital, i.e. a single tertiary-care medical center, by a clinician for the purpose of obtaining the opinion of the thoracic radiologists. We randomly selected only one CT scan from each hospital, with a total of 100 CT scans from May 2007, and a total of 173 CT scans from January 2012. In addition, each group of scans was divided into two subgroups, A and B, according to the health care delivery level, i.e. the “A” subgroup from primary care hospitals and the “B” subgroup from secondary and tertiary care hospitals (Fig. 2).

We obtained variable CT dose parameters and the scan-obtaining techniques from each CT scan, i.e. the tube voltage, tube current, scan thickness, scan interval, and phase number. We got tube voltage, scan thickness, scan interval and phase number from the DICOM information. The tube current was obtained through two different ways. At first, we used data from the dose report sheet if available. Secondly in much more cases with no information from the dose report sheet, we obtained tube current values (mA) from the DICOM information at three points of the topmost level, the mid-thoracic/main pulmonary trunk level, and the lowest level of the CT scan. We calculated the mean value of those three levels. After that, we got “mAs” value from multiplying mean tube current (mA) by exposure time (seconds).
Two radiologists analyzed the scan range and the image quality. We defined insufficient scan range as the scan range that did not include lung apex or costophrenic angle, according to the KSTR thoracic CT guideline of 2008 (Table 1) (20). We defined excessive scan range, which is not specifically indicated in the KSTR thoracic CT guideline, as the scan range that included images more than the upper clavicle or more than the mid-kidney level. We defined poor image quality scan as the scan that had a large scan interval (≥ 10.0 mm), a gap (larger scan interval than scan thickness), or a severe artifact interfering the interpretation of the image. We also obtained data regarding whether or not the CT scans included the dose report sheet.
We compared the data between 2007 and 2012, using the Mann-Whitney test with continuous variables and the χ
2 test with categorical variables. We also compared data between groups A and B, using the t-test or the Mann-Whitney test with continuous variables and the chi-square test or Fisher’s exact test with categorical variables. By convention, P value < 0.05 was considered statistically significant.
RESULTS
A comparison between 2007 and 2012
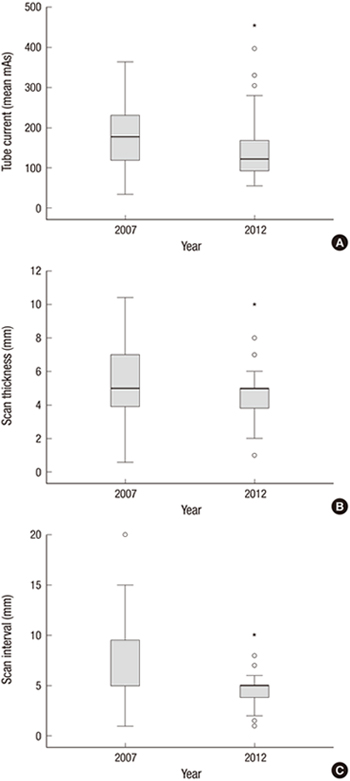
When comparing data between the year 2007 and the year 2012, the tube voltage did not show a significant change. The tube current decreased from 179.1 mAs to 137.2 mAs with decreased standard deviation from 76.1 to 65.0. The scan thickness did not show a significant change, although the standard deviation decreased from 2.7 to 1.9. In terms of the scan interval, it decreased from 6.4 mm to 4.8 mm with decreased standard deviation from 3.0 to 1.7. In addition, scans with a gap decreased from 18.0% (n = 18) to 1.7% (n = 3). The number of non-single phase CT scans was still quite considerable in 2012 (Table 2) (Fig. 3).
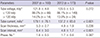
Table 2
A comparison between 2007 and 2012: tube voltage, tube current, scan thickness, scan interval, and phase number
![]()
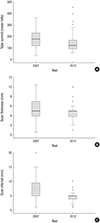 | Fig. 3A comparison between 2007 and 2012. (A) Tube current. (B) Scan thickness. (C) Scan interval. °, outliers; *, extreme values.
|
The insufficient scan range decreased from 19.0% (n = 19) to 8.7% (n = 15). Especially the lower margin insufficiency significantly decreased, rather than the upper margin insufficiency. The excessive scan range did not show a change. Poor image quality scans decreased from 33.0% (n = 33) to 5.2% (n = 9), and more CT scans included the dose report sheet in 2012 (35.8%, n = 62) than in 2008 (8%, n = 8) (Table 3).
Table 3
A comparison between 2007 and 2012: insufficient scan range, excessive scan range, poor image quality scan, and included dose report sheet

![]()
A comparison between group A (primary hospitals) and group B (secondary and tertiary care hospitals)
When comparing the data between groups A and B in both 2007 and 2012, group B had scans with lower tube voltages (≤ 120 kVp) (92.2% in 2007 and 91.8% in 2012) than group A (75.0% in 2007 and 78.9% in 2012). There was no significant difference in the tube current (mean mAs) in either 2007 or 2012. Group B had smaller scan thicknesses (4.7 mm in 2007 and 4.5 mm in 2012) than group A (6.5 mm in 2007 and 5.5 mm in 2012) in both 2007 and 2012. Group B also had smaller scan intervals (6.0 mm in 2007 and 4.4 mm in 2012) than group A (7.2 mm in 2007 and 5.3 mm in 2012) in both 2007 and 2012. Group B had more phase numbers (1.8) than group A (1.6) in 2012, with no significant difference in 2007 (Table 4) (Fig. 4).
Table 4
A comparison of tube voltage, tube current, scan thickness, scan interval, and phase number between group A and B hospitals.
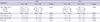
A group, primary care hospitals; B group, secondary or tertiary care hospitals.
*Mean ± standard deviation.
![]()
 | Fig. 4A comparison between group A and B. (A) Tube current. (B) Scan thickness. (C) Scan interval. °, outliers; *, extreme values.
|
In the scan range, group B had fewer insufficient scan ranges, although more excessive scan ranges than group A in both 2007 and 2012. Group B had fewer numbers of poor image quality scans and included more dose report sheets in 2012, although without a significant differences from those in 2007 (Table 5).
Table 5
Comparison of insufficient scan range, excessive scan range, poor image quality scan, and included dose report sheet between group A and B

![]()
DISCUSSION
When the data between 2007 and 2012 were compared, the tube current decreased, although the tube voltage showed no change. Even though the parameters of radiation dose were lacked in our study, perhaps the decrease in the tube current can reflect the tendency of the decreased radiation dose. Also, we found more unification of the tube current variability among the hospitals in 2012 from the decreased standard deviation. There were smaller scan intervals with decreased gaps, fewer insufficient scan ranges, and fewer poor image quality images in 2012, and thus reflecting the improved image quality. The scan thickness did not suggest a significant change, although the variability (standard deviation) among the hospitals had decreased by 2012. In addition, more dose report sheets were included in CT scans in 2012. Even though there is no information regarding the dose report sheet in the guideline, we believe it is valuable for monitoring and managing CT radiation dose. In summary, during the 5-year period, the tube current decreased and the image quality improved in thoracic CT scans obtained in Korea. The variability of the CT protocols among the examined hospitals also became more unified. We assume that these changes can be attributed to the implementation of the thoracic CT guideline in 2008.
Secondary and tertiary care hospitals showed better image quality scans than primary care hospitals from smaller scan thicknesses, smaller scan intervals, and fewer insufficient scan ranges in both 2007 and 2012. These hospitals showed more phase numbers in 2012 and more excessive scan ranges in both 2007 and 2012, reflecting more radiation dose exposures. They included more dose report sheets in 2012. In summary, we noted better image quality scans in the secondary and tertiary care hospitals than in the primary care hospitals, although the primary care hospitals also showed image quality improvement between 2007 and 2012. On the other hand, secondary and tertiary care hospitals showed more radiation dose exposures from CT scans.
Continuous education and dissemination of the guideline are still critical because of several reasons. At first, there is significant variability in CT protocols in each hospital. Second, some hospitals showed only a slight change between 2007 and 2012. Third, suboptimal quality CT scans still exist. Lastly, secondary and tertiary care hospitals showed excessive phase numbers and scan ranges.
Many countries including US, UK, Germany, the Netherlands, Japan, Taiwan, Sudan, Kenya, Nigeria, and Korea reported their national surveys about CT radiation dose exposure. Among them, the US and UK started national surveys earlier than other countries and both of them have been doing surveys with making and revising of the guideline continuously and periodically (161121222324252627). In Korea, we started the national survey since 2007 and the thoracic CT guideline was established for the first time in 2008 (245). It is important to improve the Korean guideline through continued national surveys and revisions in the future. Specifically, we think that revisions about relatively larger scan thickness criteria of 8 mm and no detailed excessive scan range criteria creating more radiation exposure in the 2008 thoracic CT guideline are needed, from the result of this study.
Our study has some limitations. At first, we did not use questionnaires and direct replies regarding CT protocols and the radiation doses from each hospital, which are usually used in the surveys. Instead, we analyzed referred CT scans from other hospitals. Therefore, the data did not officially represent each hospital. However, we believe that the data sufficiently represented the clinical thoracic CT protocols in Korea. Second, we could not obtain sufficient data regarding the radiation dose parameters, such as CTDI (CT dose index) and DLP (dose length product), which are widely used to evaluate the radiation dose. That was because the CT scans in our study did not include a sufficient number of dose report sheets, which had the CTDI and DLP data. However, we saw that CT scans in 2012 included far more numbers of the dose report sheets than those in 2008. Therefore, we expect that future studies will include the values of CTDI and DLP.
In conclusion, during the 5-year period from 2007 to 2012, the reduction in the tube current values, improvement of overall image quality, and more unification among hospitals were seen. Based on this study, we conclude that the implementation of the guideline serves as a platform to bring about those changes. We expect that the present result may be used for future revisions of the guideline.
 XML Download