

 PDF
PDF Citation
 Print
Print


INTRODUCTION
In the modern world, degenerative and life-style-related diseases have displaced infectious diseases as the chief cause of morbidity and death (1). This epidemiologic transition is well-advanced in developed countries and measures of mortality or health status alone do not provide a realistic view of public health. The disability-adjusted life year (DALY), a metric introduced by the 1990 Global Burden of Disease (GBD) project introduced, provides a unique perspective by quantifying gaps between actual and ideal health conditions based on units of time lost (2). As the sum of years of life lost (YLLs) due to premature mortality and years lived with disability (YLDs) (3), DALY integrates disease-specific fatal and non-fatal outcomes into a single measure while still allowing the two outcomes to be examined separately (45). Thus, DALY enables comparisons between health losses due to mortality and morbidity and those due to different diseases by considering the time lost due to individuals' premature death from each disease and the severity level associated with different states of poor health caused by each disease. DALY analysis can therefore be a useful tool for estimating which diseases and injuries contribute to health loss the most in a given population, as well as for prioritizing health policy concerns, such as resource allocation, interventions, and research (236789).
With its low fertility rate and high life expectancy, Korean demographics are shifting rapidly. The number of people aged ≥ 65 years has tripled over the last 30 years and is projected to reach 32.30% of the population by 2040 (10). In this ageing population, the prevalence and mortality rate of chronic diseases have grown continuously in last 10 years, and health spending, which as a share of GDP increased about 2% point since 2005, has outpaced the nation's strong economic growth (11). Thus, understanding changes in diseases and major disorders and their risk factors is crucial, both for identifying opportunities to improve the nation's health (12) and for reducing the socio-economic burden of illness. Since changes in health policy should be based on scientific evidence, the Ministry of Health and Welfare established a 5-year project supporting research on estimating and projecting the national burden due to diseases, injuries, and their risk factors, as well as on the cost-effectiveness of potential health interventions. The project was implemented by four collaborating institutions (Korea University, University of Ulsan, Ewha Womans University, and Kyung Hee University). Here we summarize the key findings of the recently-completed first phase: assessing the national burden of diseases and injuries in 2012. The study examined more than 300 medical conditions using the best available sources, including the entire population's medical records. We hope that these findings provide a comprehensive view of the current level of health in Korea.
MATERIALS AND METHODS
The concept and approach were consistent with the original GBD study (313) with some modifications to make the study more suitable for the Korean population and comparable with other burden of disease studies.
Levels of analysis
Reference year & age groups
The reference year for this study is 2012. To be consistent with previous Korean burden of disease studies, we divided the subjects into nine age groups (0-9, 10-19, 20-29, … 70-79, ≥ 80 years) to use as base cases. In the analyses of maternal, neonatal, and nutritional conditions, we subdivided the age-groups depending on the characteristics of the disease (14).
Disease and injury categories
To capture our population's current health status and enable comparisons with other burden of disease studies, we modified the recently published GBD 2010 cause list using several local data sources. These sources included the 298 disease classifications from the National Health Insurance Service (NHIS), the 53 infectious diseases in the Mandatory Surveillance System from the Korea Centers for Disease Control and Prevention (KCDC), the 24 cancer lists from the Korea Central Cancer Registry (KCCR), and cause lists from the previous national burden of disease studies. Subdivision or grouping, or renaming of diseases was determined by an expert panel of clinicians from the divisions of gastroenterology, cardiology, infectious diseases, and psychiatry. The 27 causes from the GBD 2010 list were modified, leading to agreement on the most disaggregated level of 260 mutually exclusive causes. The GBD 4-level hierarchical structure was maintained. Our list includes 3 level I causes, 21 level II causes, 166 level III causes, and 123 level IV causes. Of the 166 level III causes, 137 do not have any level IV causes below them in the hierarchy. The three broad level I causes were 1) communicable, maternal, neonatal, and nutritional conditions; 2) non-communicable diseases; and 3) injuries. A complete list of causes with ICD-10 codes will be provided upon request.
Database
We used national representative data sources to estimate national epidemiologic parameters and to sustain reliability. These sources included the database of residents registered in 2012 from the Ministry of the Interior, the 2012 Causes of Death Statistics and Life Expectancy Table from the Statistics Korea, NHIS claims data for 2007-2012, the 2012 Health Insurance Statistical Yearbook, 2008-2012 National Cancer Registration and Statistics from the KCCR, survey data from the Korea National Health & Nutrition Examination Survey, the list of 53 infectious diseases in the Mandatory Surveillance System, the 2012 Infectious Diseases Surveillance Yearbook, and 2010 Korea National Hospital Discharge Injury Surveillance data from KCDC.
Social value choices
Life expectancy
The Statistics Korea publishes age- and sex-specific life tables annually (10). Here we used the life expectancies provided in the 2012 tables as the ideal health status, allowing us to estimate how many years of life are lost when death occurs at any given age (3). According to the table, the Korean life expectancy at birth is 77.95 years for males and 84.64 years for females (15).
Time discounting & age weights
The original 1990 GBD study and World Health Organization (WHO) DALY updates applied a 3% time discount rate to future lost years of healthy life for one data set and a 0% discount to an alternative data set, and incorporated age-weighting into all health outcome measures in their base case analyses (16). There are arguments for and against discounting future health and age-weighting in Korean burden of disease studies, but we tend to agree with the recent arguments that a year of healthy life is equally important in terms of population health regardless of age and the year in which it is lived, particularly where the DALY quantifies loss of health rather than the social value of loss of health (1617). Given the lack of consensus on the issue, we followed the original WHO guide for national burden of disease studies (13) and computed a set with standard age-weighting (C = 0.1658, β = 0.04) and 3% time discounting and another with no age-weighting and 0% time discounting. The set with standard age-weighting and 3% time discounting constitutes the main reporting of results here.
Disability weights
We quantified the severity of non-fatal health outcomes from 228 diseases and injuries in Korea. A total of 496 medical professionals (specialists, physicians, and third- and fourth-year medical students) conducted discrete choice experiments and estimated the weights of the 228 most disaggregated disabilities, scaled from 0 (perfect health) to 1 (equivalent to death) using methods described elsewhere (18). Disability weights for residual categories, such as “other diarrheal disease” and “other lower respiratory infection”, were not estimated because those categories were part of a collection of detailed causes and therefore could not be described clearly enough for proper quantification. Instead, we applied the mean value of the superordinate category for the target subject where the residual category belonged in the hierarchy. For some non-communicable diseases where outpatients accounted for more than 95% of cases but were weighted relatively high, we considered the severity level by dividing each category into outpatient and inpatient cases and applied the lowest disability weight value in its superordinate category to outpatient cases and its own estimated value to inpatient cases.
Cause of death
By law, all deaths in Korea must be reported to the Statistics Korea within one month, and causes of death are coded according to the 6th Korean Classification of Diseases (KCD-6), which is based on the 10th revision of the International Classification of Causes of Death (ICD-10). The Statistics Korea collects death data from death certificates transmitted by the family of the deceased and verifies any questionable information from other administrative sources. The Statistics Korea allows registration to be delayed up to 4-month period until April of the following year. Infant deaths, which are often unregistered, are adjusted through cremation reports and neonatal mortality data produced by the Mother and Child Health Law. Wrongful or external causes (e.g., accidents) are confirmed by data from the National Cancer Center, the NHIS, the National Forensic Service, the Korean National Police Agency, the Ministry of National Defense, or the maritime police (10). Still, a problem remains due to the direct-input system, which is associated with the registration of ambiguous or vague codes (“garbage codes” [3]). Senility (ICD-10, R54), for example, accounts for 22% of garbage codes. Although Korea's garbage code rate is lower than that of other countries, it is still high (19). In order to address incomplete data and to ensure the accuracy of cause of death estimates, we modified the GBD 2010 study's algorithms and redistributed the problematic underlying causes of death (19).
Estimating epidemiologic parameters
To quantify burden of non-fatal health outcomes on the population, several epidemiologic parameters needed to be estimated. Since the Korean national insurance system, NHIS, is the single insurer covering approximately 97% of the population (20) and is supposed to maintain complete medical records for the insured as well as for medical aid beneficiaries, we mainly used NHIS data to estimate prevalence and incidence rates for each disease. Diagnoses were coded using KCD-6 organized according to ICD-10. We decided on an extraction range of whether to include secondary diagnosis with the principal diagnosis through consultation with health professionals, and we developed case definitions for each disease by considering frequency of attendance at a health care facility and whether there was a hospital admission in 2012. Incidence cases were extracted from prevalence cases and were defined as those with no prior diagnosis in a time period of 1-5 years (from 2007 up until 2011), depending on the nature of the disease. Thus, through analyses for every possible combination of prevalence and incidence cases, literature reviews, and professional consultations, we determined final case definitions and were thereby able to estimate prevalence and incidence rates for each cause. In order to ensure the accuracy of cancer cases, we asked the KCCR to extract the number of prevalence and incidence cases for each type of cancer by age and sex according to the ICD-10 codes classified in this study's disease categories. Details of the KCCR's Korea National Cancer Incidence Database and estimation method for prevalence cases were previously published (21). For injuries, we used 7th Korea National Hospital Discharge Injury Surveillance data to capture more reliable mechanisms and complex types of injuries that would not be covered in the NHIS claims data. Details on the characteristics of data and analysis method for injuries are described elsewhere (22). We estimated the duration and average age at onset through the DISMOD II program (23) and carefully examined the outputs and adjusted duration values for overestimated cases. For infectious diseases, such as lower respiratory infections that have a morbidity period of less than a month and commonly recur, we replaced values by recalculations based on information in the Health Insurance Statistical Yearbook 2012 (24). When the estimated disease duration exceeded the life expectancy at that age, we replaced the case's estimated duration with the life expectancy.
Calculation of YLLs, YLDs, and DALYs
For each cause, we computed YLLs by multiplying the number of deaths at a given age by the standard life expectancy at that age, and we computed incidence YLDs by multiplying the number of incident cases by their mean duration and the disability weight of the disease (25). For both, we incorporated 3% time discounting and age-weighting and, for an alternative set, 0% time discounting and no age weighting. DALYs were calculated as the sum of the YLLs and YLDs.
Final ranking lists
Before releasing the results of this study, we examined their potential influence on health interventions and policy. Because residual categories (e.g., other musculoskeletal disorders, other chronic respiratory diseases, other digestive diseases) do not provide a clear basis for decision making or interventions, we excluded the 18 residual categories from the final ranking list. Therefore, the final ranking contains 242 of the 260 most disaggregated, mutually exclusive causes.
RESULTS
Non-communicable diseases (NCDs) comprised the predominant burden of disease in Korea in 2012, accounting for 85.21% of total DALYs, compared with 7.77% for injuries and 7.02% for communicable, maternal, neonatal, and nutritional disorders (Fig. 1). Of the total DALYs, 88.67% were from YLDs and 11.32% from YLLs. Females contributed a larger proportion of YLDs than males across all three broad level I cause groups. In both sexes, those aged 50−59 years had the highest level of DALYs, followed by those aged 40−49 years, 60−69 years, 30−39 years, and 70−79 years. In all age groups except 80+ years, YLDs accounted for at least 71.72% of DALYs in both sexes, and in the 80+ year age group they accounted for 48.74% in men and 49.03% in women (Fig. 2).
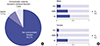 | Fig. 1DALY shares by broad cause groups (A) and YLL & YLD composition of total DALYs by sex and broad cause groups (B), 2012.
DALYs, disability-adjusted life years; YLLs, years of life lost due to premature mortality; YLDs, years lived with disability; NCD, non-communicable diseases; CMMN, communicable, maternal, neonatal, and nutritional disorders; INJ, injuries.
|
 | Fig. 2Total disability-adjusted life years (DALYs), by sex and age group, 2012. DALYs per 100,000 population.
|
Among level II broad cause groups (Fig. 3), diabetes, urogenital, blood, and endocrine diseases accounted for 13.83% of total DALYs and ranked first. Other non-communicable diseases, which included periodontal disease, refraction and accommodation disorders, vision loss, and glaucoma accounted for 12.48%; cardiovascular and circulatory diseases for 12.04%; and musculoskeletal disorders for 12.03%. All neoplasms collectively caused 8.44% of total DALYs. Of the 31 types of cancers included in the analysis, the five top-ranked cancers accounted for more than 60% of the burden of all neoplasms – cancer of the trachea, bronchus, and lung (14.05%); stomach (13.55%); liver (12.74%); colon and rectum (12.08%); and thyroid (8.48%). Within chronic respiratory diseases (6.86%), chronic obstructive pulmonary disease (COPD) accounted for more than two-thirds and asthma nearly one-third. Mental and behavioral disorders caused 6.23% of total DALYs and digestive diseases accounted for 6.00%. Within injuries, unintentional injuries other than transport injuries made up the largest portion (4.70%), followed by transport injuries (4.20%) then self-harm and interpersonal violence (2.87%). The top 10 level II cause groups accounted for about 86.80% of total DALYs. All of the communicable, maternal, neonatal and nutritional disorders ranked low and are not shown in the figures. Within that category, the major causes were maternal disorders (1.40%); diarrhea, lower respiratory infections, meningitis, and other common infectious diseases (0.99%); HIV/AIDS and tuberculosis (0.56%); and neonatal disorders (0.24%). YLLs contributed relatively little to the total burden. Neoplasms, cardiovascular and circulatory diseases, and self-harm and interpersonal violence were dominant causes of total YLLs, accounting collectively for about 64.57%.
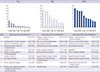 | Fig. 3Ten leading broad cause groups of YLLs, YLDs and DALYs, 2012. YLLs*, YLDs*, and DALYs
*
per 100,000 population. Sums may not add up to exact total due to rounding. 18 residual categories were excluded in calculation of percentages of YLLs, YLDs, and DALYs.
YLLs, years of life lost due to premature mortality; YLDs, years lived with a disability; DALYs, disability-adjusted life years.
|
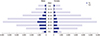
Table 1 shows the 30 leading conditions with and without age-weighting and time discounting. Diabetes mellitus (DM) was the leading specific cause of total DALYs, followed by low back pain, COPD, ischemic heart disease, and ischemic stroke. The top 30 specific causes accounted for about 68.01% of all DALYs. In the set with neither age-weighting nor time discounting, three of the top 30 causes – motorized vehicle with three or more wheels, schizophrenia, and neck pain – declined slightly while nearly all others increased; Alzheimer's disease and other dementias more than doubled. The results seem fairly consistent, and there was no noticeable re-ranking effect in the highest ranked causes. Fig. 4 presents a graphical comparison of ranks for causes of DALYs calculated with and without age-weighting and time discounting. No age-weighting and 0% discounting gave more importance to causes with the greatest burden in children, such as preterm birth complications and sepsis and other infectious disorders of the newborn baby, while giving less importance to causes largely affecting middle-aged women, such as iron-deficiency anemia. Overall, these results confirmed that the application of age-weighting and discounting did not cause any large changes in the rank ordering of diseases and injuries included in the analysis.
Table 1
Top 30 leading specific causes of disability-adjusted life years (DALYs), with and without discounting and age weighting, in total, 2012
![]()
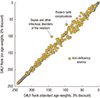 | Fig. 4Relationship between the rank of causes of disability-adjusted life years (DALYs) with and without age weighting and discounting, 2012. Rank 1 is the largest cause.
|
Fig. 5 shows the 30 leading conditions by sex. The burden in females was about 2.19 times that for males for major depressive disorder, 2.23 for Alzheimer's disease and other dementias, and 3.35 for osteoarthritis. Conversely, the burden of cirrhosis of the liver in men was 2.22 times that in women. Some cancers were only ranked within the top 30 in males, including tracheal, bronchial, and lung; liver; stomach; and colon and rectum cancers.
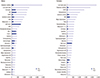 | Fig. 5Top 30 specific causes of disability-adjusted life years (DALYs) by sex with fraction of years of life lost (YLLs) and years lived with disability (YLDs), 2012. DALYs per 100,000 population.
Cirrhosis-, cirrhosis of the liver; IHD, ischemic heart disease; COPD, chronic obstructive pulmonary disease; motorized v. 3+, motorized vehicle with three or more wheels; BPH, benign prostatic hyperplasia; c, cancer(s); hemorrhagic-, hemorrhagic and other non-ischemic stroke; gastroesophageal-, gastroesophageal reflux disease; major depressive-, major depressive disorder; hypertensive HD, hypertensive heart disease; gastritis-, gastritis and duodenitis; refraction-, refraction and accommodation disorders; mechanical forces, mechanical forces (other); motorized v. 2+, motorized vehicle with two wheels; Alzheimer's-, Alzheimer's disease and other dementias; tubulointerstitial-, tubulointerstitial nephritis; pyelonephritis, and urinary tract infections, phobic anxiety-, phobic anxiety disorders, et al.
|
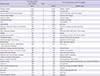
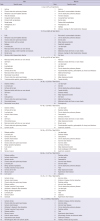
Table 2 shows the top 10 leading causes by sex and age group. For children aged 0−9 years, asthma, COPD, refraction and accommodation disorders, viral skin diseases, and congenital heart anomalies were highest ranked. Major causes of DALYs in those 10−19 years old included falls, refraction and accommodation disorders, COPD, accidents with motorized vehicles with two wheels, and epilepsy in boys; and refraction and accommodation disorders, COPD, dental caries, major depressive disorder, gastritis and duodenitis in girls. For men and women aged 20−29, injuries, including motorized vehicle with three or more wheels and self-harm, were included in the top-ranked causes of DALYs. In women of childbearing age (20−39 years), abortion and female infertility were among the highest causes of burden. For the three decadal groups between 30 and 59 years of age, DM, low back pain, and cirrhosis of the liver were consistently ranked in the top three for men while low back pain, COPD, DM and osteoarthritis were ranked highly for women. DM was the most important cause for men and women in their 60s, and cardiovascular and circulatory diseases started to be highly ranked for men in their 40s and women in their 50s. Alzheimer's disease and other dementias appeared important for both men and women in their 70s, but the burden was higher in women.
Table 2
Top 10 specific causes of disability-adjusted life years (DALYs) by sex and age group, 2012
![]()
DISCUSSION
As improved living conditions and advances in medical technology and treatment have lowered death rates due to infectious diseases globally, the relative importance of NCDs as a cause of death have increased (26). Korea is no exception to this epidemiologic transition. As can be predicted in a population with a rapidly rising mean age, NCDs formed the predominant burden of disease in Korea in 2012, accounting for 85.21% of total DALYs, and contributing 87.27% of total YLD. Because age-related causes are main contributors to this burden, this phenomenon is likely to persist or increase in the near future, as it has in other high-income countries. Compared to the top ranked causes in 2002 and 2007 population-based Korean burden of disease studies (2728), the present study showed that DM, cerebrovascular disease, IHD, cirrhosis of the liver, asthma, and COPD had become consistently greater causes of DALYs in both sexes. The most noticeable difference in 2012 was the appearance of low back pain among the top 10 DALY causes. This result could be partially attributed to the frequency of treatments and the fact that traditional medical treatment records, which contain a great portion of musculoskeletal disorders, have been included in NHIS claims data since 2010. However, the absolute number of low back pain patients was indeed high, even in young ages groups (29), owing to the lack of exercise, bad posture habits, and obesity that have become increasingly common in modern life. Due to differences in methodology, data sources, and years of reference, the present study is not directly comparable to the recent GBD study, but the latter reported back pain, neck pain, and other musculoskeletal diseases as the most important three contributors for Korean DALYs in 2013 (30). These conditions generate a considerable cost to both individuals and society through life-long disability and substantial health care needs, and it is therefore urgent to develop strategies for dealing with such age-related conditions, especially considering our rapidly ageing population and the associated increase in health care expenditures (63132).
Injuries including accidents with motorized vehicles and self-harm were ranked within the top 10 for ages 10−19 and were consistently important causes of DALYs for the proceeding three decades of age. As the burden from those causes is largely related to social factors, multi-sectoral policy options should be addressed for targeted intervention.
Time discounting is applied to future health loss while age-weighting values a year lived by young and middle-aged adults more highly than a year lived by a child or older adults (813). In our analysis, when no discounts or age-weights were applied, some causes with high incidence cases in young and middle-aged adults, such as motorized vehicle with three or more wheels, schizophrenia, and neck pain, became slightly less important. In contrast to those causes, Alzheimer's disease and other dementias, which were highly ranked in those aged ≥ 70 years in both sexes, more than doubled when age-weighting and discounting were eliminated, especially in women. For most specific causes, however, we found no dramatic changes between the two data sets in values or rank orders. As for the overall increase after no discounting and no age-weighting, the incidence rates by age groups were considered relatively stable.
Over the course of this study, it became apparent that a number of methodological issues need to be addressed to improve the validity and applicability of the DALY metric in Korea. Here we briefly summarize those issues.
Discrepancies existed between actual and recorded causes of death in Korea. About 25% of the codes were inappropriate and had to be redistributed to validate the age-sex-cause specific mortality and fatality rates for this study. We modified the GBD 2010 study's garbage code redistribution algorithm to be more suitable for the Korean disease classification system, but this needs further work to approach the target accuracy (19).
Our main source for disease prevalence and incidence data in this study was NHIS claims data. Although NHIS is a national database that helps us understand health care utilization at the population level, it has limitations. The accuracy of diagnoses has been questioned. NHIS also does not provide data on people with unmet medical needs and therefore prevalence and incidence rates could have been underestimated, especially for conditions such as mental and behavioral disorders (33). To improve the utility of the database for defining disease prevalence and incidence cases more specifically, combining treatment or prescription information with the main diagnosis codes in NHIS claims data analyses could be performed as part of a revision process. Since we analyzed the different case definitions and consulted with clinical experts, however, we are fairly confident in our results. Consistent longitudinal epidemiologic studies and population-based surveys are always important and can provide supplementary information to help validate the epidemiologic indicators as well as to judge how the NHIS claims data can be adjusted to reflect population estimates more precisely.
Adjustments were not made in disability weighting and YLD computations for individuals with comorbidities. Modelling the comorbidity combinations and their effect on future progression of conditions is challenging, but we plan to address this in the 2017 follow-up study.
If diseases were divided into severity levels and disability weights were available for each level, the validity of the results would be greater. Further analytical methods would be required.
A meaningful and accurate assessment of trends and of the relative magnitude of a population's burden of disease over time requires strictly consistent methodology and reliance on the same data sources (917). The DALY estimates we report here are not directly comparable with those of the previous Korean burden of disease studies mainly due to differences in disease categories, database, and newly estimated disability weights (34). To continue providing the comprehensive, comparative, and consistent evidence required to appropriately guide policy and practice priorities (30), such estimates should be produced and updated on a regular basis with consistent data and metrics, for a wide range of health problems rather than for a limited set. This would strengthen future assessments of health in Korea, enhancing their value for policy and program development (12).
Despite these limitations in methodology and data, the results reported here identify key health challenges and opportunities for improving health in Korea. As the first comprehensive study covering 313 causes and making full use of the best national representative databases, this study presents a substantially different picture from the previous studies, which included limited disease categories. In our current analysis using DALY as a metric, causes that did not receive much attention previously because they are not directly related to mortality – such as low back pain, osteoarthritis, and major depressive disorder – were evaluated on equal terms with all other causes and given a place among health priorities. Thus, we provide a broad base of evidence for assessing the major public health issues that can inform decision making on policy options or health interventions.
The next steps of our project involve mainly risk factor and cost effectiveness analyses. Linking our study results to such analyses will provide insights into how best to investigate avoidable burdens of disease and to evaluate the relative impact of health interventions. After the follow-up assessment of disease burden, the forces driving changes in population health patterns should be identified. Because disease patterns are constantly changing, population-level burden of disease studies should be regularly updated. When that is done with consistent methodology, our DALY estimates, by broadly characterizing disease transition, will be strengthened as a tool for setting priorities for health policy, interventions, and research topics.
 XML Download