

 PDF
PDF Citation
 Print
Print


INTRODUCTION
Life expectancy (LE) has been defined as "based on known statistical data, the number of years which any person of a given age may reasonably expected to live" according to the Medical Subject Headings (MeSH) (1). It represents an important indicator that reflects population health status as a measure of life expectancy at birth, i.e. how long individuals may expect to live from birth to death. However, LE has critical weakness as it cannot reflect morbidity, disability, or health status. This new concept of a "summary measure of population health" has appeared to compensate for the disadvantages of LE (23). Notably, in 1971, Sullivan proposed a novel method to calculate a single index that reflected both mortality and morbidity (45).
Among various summary measures of population health, Health-Adjusted Life Expectancy (HALE) is a summary measure that can estimate the average number of years that a person at a given age can expect to live as an equivalent of full health (67). Some experts believe that HALE may represent the best summary measure for estimating the overall level of health for a population. Accordingly, the World Health Organization (WHO) has used it as an official measurement method for annual reports to provide information regarding the average level of health for the population of member states (78). In many countries, HALE has been estimated at the national or regional levels (9101112131415). The main reason that HALE is widely used is that it represents an integrative measure that reflects mortality and morbidity and could provide relevant information to both the public and policy makers.
However, to the best of our knowledge, HALE has not yet been measured at the national or regional levels in Korea. This study aimed to measure HALE from 2005 to 2011 in Korea at both the national and regional levels as a part of the Korean National Burden Study of 2012.
MATERIALS AND METHODS
In this present study, we estimated the health-adjusted life expectancy for 2005, 2008, and 2011 at the national level and for 2011 at regional levels according to 16 metropolitan and provincial levels. We used the life table method with the approach proposed by Sullivan to estimate the HALE (416). The approach proposed by Sullivan adapted the conventional life table method by considering the expectation of a life free of disability and showed the average number of additional healthy life years for all ages (16). Three main data sets are needed to estimated healthy life expectancy: probability of death, prevalence of disease, and disability weights.
Probability of death
Probabilities of death data were obtained from the Korean Statistical Information Service (KOSIS) from Statistic Korea (accessible from: http://kosis.kr/). The KOSIS offers abridged life tables at 5-year intervals from 1970 to 2013 as well as complete life tables at 1-year intervals from 1997 to 2013. Data for age-specific probabilities of death (0, 1, 2, ... , 98, 99, 100+) by gender and year are available from complete life tables. We used the probabilities of death data for 2005, 2008, and 2011 to estimate healthy life expectancy at a national level. Data for the probabilities of death by administrative districts were also obtained from the KOSIS. The KOSIS provides abridged life tables by administrative districts for 2005, 2008, and 2011. Based on the abridged life table by administrative districts for 2011, we obtained probabilities of death data for 7 metropolitan cities and 9 provinces (known as 'do' in Korean) at 5-year intervals.
Prevalence of disease
We used prevalence of disease data from the Korea National Health and Nutrition Examination Survey (KNHANES), which has been conducted to evaluate the health and nutritional status of the Korean population (17). Since 1998, surveys for the KNHANES I (1998), KNHANES II (2001), KNHANES III (2005), KNHANES IV (2007–2009), and KNHANES V (2010–2012) have been conducted, and a survey for KNHANES VI (2013–2015) is currently ongoing. The KNHANES is a cross-sectional survey from a representative sample of the Korean population (≥ 1 year old individuals) that used a complex, stratified, and multistage probability sample method. We took advantage of KNHANES III, KNHANES IV, and KNHANES V to estimate the HALE for 2005, 2008, and 2011, respectively.
The KNHANES can be divided into three sections: health examination, health interview, and nutrition survey. Data for various medical conditions are collected in the health interview using a face-to-face interview method. Among them, self-reported morbidity diagnosed by the physician was used as data for estimating the prevalence of disease. For KNHANES V, self-reported morbidity data were collected for 45 diseases (Supplementary Table 1). To compare estimated healthy life expectancies by years, the 45 diseases in KNHANES V served as criteria for generating a list of diseases in KNHANES III and KNHANES IV. In other words, we identified whether the survey respondents reported morbidity for the 45 diseases in KNHANES III and KNHANES IV.
Disability weights
The prevalence of disease data from the KNHANES was linked with the disability weights that were estimated for each disease. The method used to estimate disability weights of diseases has been described in detail elsewhere (18). Using disability weights of disease, the self-reported morbidity of each survey respondent was converted into weights with disability that was measured on a scale from 0 (full health) to 1 (being dead). Each disease had unique disability weights, but hepatitis B and C were undifferentiated in KNHANES III, so the average of the disability weights for hepatitis B and C was used for chronic hepatitis in this present study. If a survey respondent had two or more diseases, a multiplicative disability weight was applied (19).
Calculating healthy life expectancy

Dx,g: years lived with disability rates at age x by gender;
Lx,g: number of person-years lived between ages x and x+1 by gender;
L'x,g: health-adjusted number of person-years lived between ages x and x+1 by gender;
ln: number of people who were alive at age x by gender;
x: 1-year intervals, from 0 to 100;
g: gender, 1 (men) or 2 (women).
First, we calculated the number of person-years lived between age intervals based on the probability of death at each age. Next, we estimated the health-adjusted number of person-years lived, considering the years lived with disability rates at each age by gender. The rates of years lived with disability, which indicates the average probability of health loss resulting from diseases at each age, were computed to reflect a proportion of the disability weights at each age by gender from the KNHANES. Because we could not obtain years lived with disability rate at age 0 because of the characteristics of the KNHANES survey population (≥ 1 year old individuals), we used the rate of years lived with disability at age 1 as a proxy for the rates of years lived with disability at age 0. Furthermore, if the rates of years lived with disability at an old age (for example, at age 98 or 99) were not estimated, the rates of years lived with disability of the nearest age was used instead. Cumulative health-adjusted years lived at each age was the sum of the number of person-years lived in the remaining lifespan. Healthy life expectancy at each age was calculated as the cumulative health-adjusted years lived at each age divided by the number of individuals alive at each age.
We computed the 95% confidence interval based on the disability weights (18). SPSS v21.0 software was used for all statistical analyses.
RESULTS
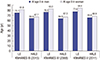
The LE at age 0 between 2005 and 2011 increased by 2.5 and 2.6 years for men (from 75.1 to 77.6 years) and women (from 81.8 to 84.4 years), respectively, and HALE at age 0 during the same time period increased by 1.4 and 1.2 years for men (from 64.4 to 65.8 years) and women (from 67.7 to 68.9 years), respectively. Although the difference in LE between men and women increased from 6.7 years (2005) to 6.8 years (2011), the difference in HALE between men and women decreased from 3.4 years (2005) to 3.1 years (2011). In men, HALE at age 0 was 65.8 years (95% confidence interval (CI): 63.8–67.7) for 2011, 64.0 years (95% CI: 62.0–66.0) for 2008, and 64.4 years (95% CI: 62.8–66.0) for 2005. For women, HALE at age 0 was 68.9 years (95% CI: 66.2–71.5) for 2011, 67.3 years (95% CI: 64.6–69.9) for 2008, and 67.7 years (95% CI: 65.2–70.1) for 2005 (Fig. 1).
Fig. 1
Life expectancy and healthy life expectancy at age 0 in 2005, 2008, and 2011. KNHANES, Korea National Health and Nutrition Examination Survey; LE, life expectancy; HALE, health-adjusted life expectancy.
Differences between LE and HALE for women tended to be greater than that for men (Fig. 2). For women, differences between HALE and LE at age 0 were 15.5 for 2011 and 14.1 for 2005. However, for men, differences between HALE and LE at age 0 were 11.8 years for 2011 and 10.7 years for 2005. Table 1 shows the LE and HALE for 2005, 2008, and 2011 at 5 year interval by gender. Supplementary Table 2 provides estimates of the confidence interval for HALE for 2005, 2008, and 2011 at each age by gender.
Fig. 2
Differences between life expectancy and health-adjusted life expectancy by age and gender in 2005 and 2011. KNHANES, Korea National Health and Nutrition Examination Survey; LE, life expectancy; HALE, health-adjusted life expectancy.
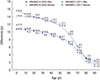
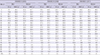
Table 1
Life expectancy and health-adjusted life expectancy by age in 2005, 2008, and 2011
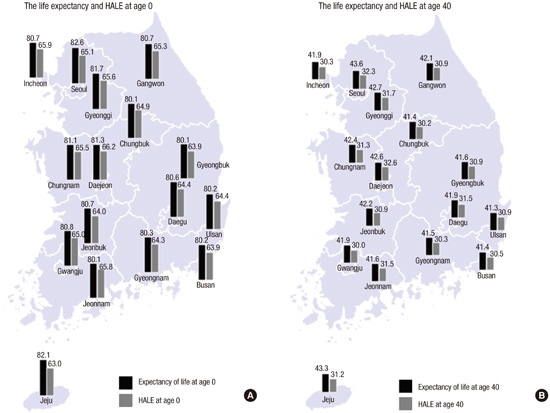
In 2011, among 16 metropolitan cities and provinces, LE at age 0 was greatest in Seoul (82.6 years), followed by Jeju-do (82.1 years) and Gyeonggi-do (81.7 years), while it was shortest in Chungcheongbuk-do (80.1 years) (Fig. 3). However, HALE at age 0 was greatest in Daejeon (66.2 years), followed by Incheon (65.9 years) and Jeollanam-do (65.8 years), and it was shortest in Jeju-do (63.0 years).
Fig. 3
Life expectancy and HALE (A) at ages 0, (B) at ages 40. HALE, health-adjusted life expectancy.
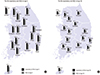
The maximum gap among sub-regions in LE was 2.5 years (82.6 in Seoul and 80.1 Chungcheongbuk-do) and that of HALE was 3.2 years (66.2 in Daejeon and 63.0 Jeju-do). Differences between LE and HALE in same region were greatest in Jeju-do (19.1 years) and it was smallest in Jeollanam-do (14.3 years).
DISCUSSION
Many composite summary indicators for measuring population health have been developed since Sullivan introduced a single index for mortality and morbidity (47). Indicators can be categorized as one of two types of composite summary measures based on the following characteristics: "health gap measures" (e.g., healthy life years [HeaLYs], disability adjusted life years [DALYs], and quality-adjusted life years [QALYs]) and "health expectances" (e.g., disability-free life expectancy [DFLE] or HALE) (7). These indicators can provide valuable data about the health status of a population along with comparable measures of the disease burden of a population. Therefore, these can serve as vital tools for health policy decision making (35678). Among them, HALE is a single measure indicator that can summarize mortality and non-fatal outcomes of the health of an average population (5). Compared to other summary indicators, it is easily understandable to the public because it can be described as an improved form of "life expectancy at birth".
HALE can be commonly used in three ways: an evaluation tool for international comparison in health status; health status evaluation in national level; and health status measuring and monitoring tool according to sub-regional level (20). First, HALE is an appropriate measurement tool for international comparison. For example, WHO has used HALE to compare the health status among member countries and measure changes in this over time (578). European Union (EU) has also used HALE as a tool for health status comparison among member states. For example, recently, it was used to compare Healthy Life Years at age 50 (HLY50) in order to reveal the substantial variation in healthy ageing among the EU25 countries (21). Also, the European Commission set a goal of increasing healthy lifespan of Europeans by 2 years by 2020 and HALE will be used to monitor and evaluate the achievement of each member states (22).
Second, it has been increasing number of countries which measure HALE at their national level (9101112131415). HALE can be used in a variety of policy applications such as measuring the quality of life and monitoring disparity (20). In the United Kingdom, it has been analyzing past trend and predicting future trend of LE, HALE, and DFLE. Also, they are focusing and monitoring on the main influence factors on HALE such as chronic conditions, health behaviors, and socio-economic and environmental factors (23). In case of Australia, they analyzed the annual trends in the levels and social distribution of LE and HALE (12). One Canadian research indicated that body mass index can affect on LE and HALE (24).
Third, even though HALE has been less commonly used in sub-national level analysis, the importance of sub-national analysis is rapidly growing and many countries have tried to yield the results (232526). For example, United Kingdom and Canada, individual state of United States of America have published the results of sub-national level analysis using HALE (2627). Measuring sub-national level disparities of health status is the first step in order to reduce the health gap. It is why many western countries have been measuring and monitoring HALE according to regional levels.
We measured the HALE of the Korean population in two ways at the national and regional levels from 2005 to 2011. Overall, LE and HALE have increased from 2005 to 2011. Based on these measures, the health status of the Korean population has been continually increasing. However, we confirmed that a gap between LE and HALE still existed. Additionally, we found that there was a significant difference between LE and HALE among different sub-regions. Ideally, a perfect health population should show no difference between LE and HALE and the values should be similar across the country. Of course, this is an impossible situation in the real world. However, regarding the gap between LE and HALE, several questions remain. Which factors influence the gap? What is the cryptic reason? What should be done to reduce the gap? The possible reason for the difference between LE and HALE is the increased burden of chronic diseases that has occurred because Korea is an aging society and the burden of chronic disease has escalated (28). The HALE has not increased as much as the LE because the increase in LE is mostly affected by reductions in mortality, whereas an increase in HALE requires reductions in both morbidity and disability. Additionally, regional differences in health status could become a very serious political issue in Korea if this trend continues, as it would be interpreted as an indicator that some regions are not good places to live (29). Therefore, further studies should be carried out to define the factors that can affect LE and HALE according to regions.
For health authorities or policy makers, increasing HALE across country should be top priority for healthy people. At the same time, reducing health gap among regions should set an important political goal. However, it is not easy work to increase HALE and to reduce regional variation. In order to increase HALE across the country, not only reducing mortality but also decreasing in incidence and prevalence of chronic diseases should be done. To do so, activities of primary prevention for chronic diseases should be strengthened. At the same time, we should focus on behavioral changes, strengthen activities for health promotion, and fix circumstantial factors. For example, one possible reason of regional differences in HALE might be the differences in the prevalence of chronic diseases among sub-regions. In particular, lowest regions in HALE (Jeju-do, Busan, and Gyeongsangbuk-do) should be carefully monitored and evaluated HALE in a regular base. In addition, further researches are need to define what factors can affect the regional differences. Then, we intervene to correct the influential factors. In this point of view, we take into consideration of benchmarking the case of the United Kingdom. They measure health status in a regular base, estimate the future trend according to national and regional level, lastly monitor main influential factors on HALE such as chronic conditions, health behaviors, and socio-economic and environment factors (23).
Regarding the methodology used to measure HALE, we used a method similar to that of Sullivan and the Global Burden of Disease (GBD) project (45). The major difference is that we used our own disability weights that were measured in the Korean National Burden of Study in 2012 (18). To measure HALE, we need to measure three criteria—the probability of death, the prevalence of disease, and disability weights. Among these criteria, disability weight can be strongly affected by societal preferences. Therefore, if possible, the use of customized disability weights to reflect societal preferences is recommended. In this present study, we used the disability weight measured from the Korean medical experts (18). By comparing the results of this present study with those of the GBD project (5), the differences in results were as follows: LE in males was 77.6 in Korea and 76.5 in GBD; HALE in males (65.8 vs. 67.9); LE in females (84.4 vs. 82.7); and HALE in females (68.9 vs. 72.6). Overall, our results were very similar to those of the GBD project, but the LE values were higher in this study, whereas the HALE values were lower compared with the results of the GBD project.
There were some limitations to this study. We did not include all disease categories to calculate HALE because we used the KNHANES database, which contained 45 major disease categories. This might act to overestimate the HALE value in this study. However, 45 disease categories would cover over a majority of all disease categories in terms of burden of disease. Therefore, the actual overestimating effect of HALE might be less significant. Additionally, we used self-reported morbidity by participants, which could represent a weak point of this study.
This study is the first to measure HALE using our own database, including the disability weight to reflect Korean preferences. Based on this study, we confirmed that LE and HALE have increased, but the difference between LE and HALE persisted. Notably, there were regional differences across the country. The Korean government and society should make an effort to reduce the gap between LE and HALE and to reduce any regional differences.
 XML Download