

 PDF
PDF Citation
 Print
Print


INTRODUCTION
Measuring the burden of disease allows for determination of the overall health status of a population and the rational allocation of limited health care resources (1). An indicator of burden of disease, disability-adjusted life years (DALYs), is a combination of years of life lost (YLLs), which indicates loss of life years due to premature death, and years lived with disability (YLDs), which indicates loss of healthy years due to disability (2). In 1990, YLLs accounted for 76.7% of DALYs worldwide, showing a higher proportion than YLDs; in 2010, YLLs represented 68.8% of DALYs measured worldwide by the Global Burden of Diseases (GBD) Study. When compared by region, YLLs comprised approximately half of the DALYs in developed countries with a high income, such as Asia Pacific, Western Europe, and North America, and over 80% of the DALYs in developing countries, such as Sub-Saharan Africa (3). Therefore, measuring YLLs is considered an important factor for determining burden of disease.
Given that YLLs are measured using the mortality rate and cause of death (CoD), accurate measurement of the cause-specific mortality rate is important. In Korea, CoD data collected by the Statistics Korea are utilized to estimate the cause-specific mortality rate. CoD is collected from death certificates using the Korean Standard Classification of Diseases (4). However, death certificates contain errors owing to incorrect entries and are thus limited. For example, some entries, such as senility or cardiac arrest, may not reflect the real CoD. Therefore, correcting CoD codes is necessary to estimate the burden of disease.
In order to increase the accuracy of CoD, Statistics Korea supplements data on infant deaths, which is frequently omitted from the Mother and Child Health Law registry data, as well as uncertain CoD using data from the National Cancer Center, National Health Insurance Service, National Police Agency, Ministry of National Defense, and Korean Coast Guard actually (5). The death certificate data is highly credible and easily accessible compared to other secondary sources; therefore, it is used in a variety of studies (67). However, problems regarding estimation of cause-specific mortality rates have been continuously raised despite the supplementation (78910). For example, mortality due to senility, which is not valid CoD, accounted for 5% of CoD in Korea in 2012 (11). Therefore, accurately estimating the CoD will enhance the validity of cause-specific mortality rates still.
The GBD Study researchers have tried to improve the accuracy of CoD by categorizing disease groups in accordance with CoD. For example, in 1996, Murray and Lopez, investigators for the GBD Study, used the term “garbage codes” to describe causes that cannot serve as an underlying CoD (12). Naghavi et al. (13) further characterized these garbage codes into four categories as follows: (i) causes that cannot or should not be considered as an underlying CoD (e.g. R54: senility); (ii) intermediate causes (e.g. I50: heart failure); (iii) immediate causes that are the final steps in a disease pathway leading to death (e.g. I46: cardiac arrest); and (iv) unspecified causes within a larger cause grouping (e.g. B99: other and unspecified infectious diseases). The GBD 2010 Study added to this by drafting a list of 59 garbage codes that have a wider application than the 26 garbage codes used by the World Health Organization (WHO) in 2013 (814). To estimate the burden of disease accurately, garbage code deaths should be redistributed to other valid target disease groups to avoid underestimating the burden of disease. Therefore, the GBD Study researchers developed a redistributed algorithm for the GBD 2010 Study, which, with appropriate application, may help to estimate the YLLs accurately.
However, the disease classification system used in the Korean Burden of Disease Study is different from the systems used by the GBD 2010 and 2013 studies. Furthermore, given that the methodologies of the GBD 2010 and 2013 studies were developed for worldwide use, they do not reflect the reality in each country. For example, among the garbage code list, 3.31% of deaths coded as cardiac arrest (ICD: I46) were redistributed to Chagas disease. However, Chagas disease has been shown to occur almost entirely in Latin America (15). Therefore, this particular algorithm would not work in Korea, where Chagas disease almost does not exist.
Therefore, in order to resolve these discrepancies, this study applied a modified garbage code redistribution algorithm based on the GBD 2010 Study methodology to increase the validity of CoD estimation as well as to estimate age-, sex-, and cause-specific mortality rates and YLLs in Korea.
MATERIALS AND METHODS
Data source and methodology for garbage code redistribution
The algorithm for garbage code redistribution was developed based on the GBD 2010 and 2013 Study methodologies (816), the New Zealand Burden of Disease Study report (9), and the Korean Standard Classification of Disease-6 (Fig. 1) (17). Furthermore, expert opinions were considered for a few diseases. The specialists of each disease examined the appropriateness of the distribution rate, and as a result, the final garbage code list included 84 items. The 2010–2012 data on CoD statistics from the Statistics Korea were used to calculate the number of deaths, and an age-specific life table from Statistics Korea was used to calculate the standard life expectancy (4). CoD was classified into target cause, which is target of redistributed garbage code, and garbage code deaths (811).
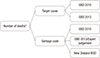
To apply the developed algorithm, the 2010–2012 CoD data from the Statistics Korea were utilized to calculate age- and sex-specific death rates for each disease in a certain period of time. Then the number of deaths within each of the 84 garbage codes was determined. Each garbage code death was then distributed to a relevant target cause based on each garbage code proportion. The distributed garbage code deaths were then redistributed again based on the sex- and age-specific rates of each target CoD. The total number of target cause death is the sum of original death due to target cause and sum of redistributed garbage code death.
Calculating YLLs
The equation used to estimate YLL is as follows (10).
r = discount rate; β = age-specific weight parameter, K = use of age-specific weight (when used age-weight, applied 1; when did not use, applied 0); C = constant; a = age at death; L = life expectancy at death.

For the purpose of this calculation, age-weight was established as 4% and the discount rate (r) was applied as 3% (111). The results were then used to calculate the standard expected years of life lost (SEYLL), which is an indicator calculated by setting the standard life expectancy for each age and multiplying the standard life expectancy by the death rate for each age as follows (10).
Here, e*x is life expectancy at the age of x, l is age at death, and dx is the death rate at the age of x.
 is life expectancy at the age of x, l is age at death, and dx is the death rate at the age of x.
Meanwhile, because of using the 2010 prevalence data to calculate YLDs of injury in this study, YLLs of injury were calculated using 2010 mortality data to ensure consistency and YLLs for all other diseases were calculated using 2012 data.
RESULTS
The number of deaths
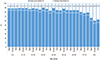
To compare the number of deaths by year, cause of specific mortality was calculated for each year from 2010 to 2012. After applying the modified garbage code algorithm, the total number of deaths was approximately 257,000 in 2010, 259,000 in 2011, and 268,000 in 2012. The proportion of garbage code deaths was 24.6% in 2010, 24.8% in 2011, and 25.2% in 2012 and was higher in women (29.6%) than in men (21.6%) (Fig. 2).
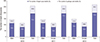 | Fig. 2The number of target cause deaths compared to garbage code deaths from Statistics Korea during 2010–2012.
|
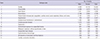
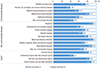
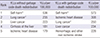
Of the 84 items on the garbage code list, the top 15 items comprised 80% of all garbage code deaths, and senility ranked the highest at 15,054 cases, representing 22% of garbage code deaths and 5% of all deaths (Table 1). According to the Statistics Korea CoD data, in 2012, lung cancer was the most frequent CoD, followed by ischemic stroke, ischemic heart disease, self-harm, and liver cancer; however, after application of the garbage code redistribution algorithm, ischemic heart disease was the most frequent CoD, followed by ischemic stroke, lung cancer, self-harm, and hemorrhagic stroke (Table 2).
Table 1
Ranking of garbage codes by number of deaths in 2012
![]()
Table 2
Ranking of cause of death in 2012 with and without garbage code redistribution
*Derived from the Statistics Korea Database; †Including tracheal and bronchial cancer; ‡The mortality data from 2010 were applied because prevalence data from 2010 were used to calculate the disability-adjusted life years.
![]()
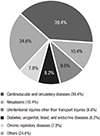
Among disease groups, the proportion of garbage code deaths was the lowest among psychological diseases (8.4%), followed by cancer (8.5%) and musculoskeletal diseases (10.6%). On the contrary, disease groups with the highest proportion of garbage code deaths were diarrhea, lower respiratory, and other communicable disease (60.7%), followed by unintentional injuries other than transport injuries (53.7%) and neglected tropical diseases and malaria (41.5%) (Fig. 3). However, 39.4% of garbage code deaths were redistributed to cardiovascular and circulatory diseases, followed by neoplasms (10.4%) and unintentional injuries other than transport injuries (9.6%) (Fig. 4).
When comparing the rates of age-specific garbage code deaths, we found that as age increased, the proportion of garbage code deaths also tended to increase. The proportion of age-specific garbage code deaths according to sex was relatively higher in men aged 20–60 years than in women of the same age group; however, the proportion was found to be higher in women aged ≥ 60 years than in men of the same age group. In addition, the proportion of garbage code deaths was the highest in women aged ≥ 80 years when compared to all other age groups, accounting for approximately 40% of cases (Fig. 5).
YLLs
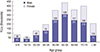
Premature death contributed 2,208 thousand YLLs in Korea in 2012, including 1,361 thousand among men and 847 thousand among women (a difference of 1.6 times). The number of YLLs was highest among those aged 50–59 years (308 thousand), and YLLs for men aged 50-59 accounted for 23% of the total YLLs. The number of YLLs was highest among women aged 70–79 years (180 thousand) (Fig. 6).
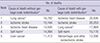
In terms of disease-specific YLLs, we found that self-harm was the most frequent cause of YLLs (573 YLLs per 100,000 individuals), followed by ischemic heart disease (YLLs = 308 per 100,000 individuals), lung cancer (YLLs = 250 per 100,000 individuals), and liver cancer (YLLs = 234 per 100,000 individuals). Differences by gender were also found. For example, among both men and women, self-harm contributed the most YLLs per 100,000 individuals (729 for men, 417 for women), followed by ischemic heart disease (374 for men, 241 for women). However, among men, liver cancer (YLLs = 362 per 100,000 individuals) was the third leading cause of YLLs, followed by lung cancer (YLLs = 351 per 100,000 individuals), and cirrhosis of the liver (YLLs = 320 per 100,000 individuals), whereas hemorrhagic stroke (YLLs = 202 per 100,000 individuals) was the third leading cause of YLL for women, followed by ischemic stroke (YLLs = 177 per 100,000 individuals), and lung cancer (YLLs= 149 per 100,000 individuals) (Table 3).
Table 3
Top 5 causes of death by YLLs per 100,000 individuals according to sex*

YLLs, years of life lost.
*Garbage code deaths redistributed; †The mortality data from 2010 were applied because prevalence data from 2010 were used to calculate the disability-adjusted life years; ‡Including tracheal and bronchial cancer.
![]()
Among the total YLLs in 2012, self-harm contributed the most YLLs followed by ischemic heart disease, lung cancer, liver cancer, and hemorrhagic stroke after applying the garbage code redistribution algorithm; however, when calculating the YLLs without the garbage code redistribution, self-harm contributed the most YLLs followed by lung cancer, liver cancer, cirrhosis of the liver, and ischemic heart disease. In particular, ischemic heart disease rose from the 5th place to the 2nd place after application of the garbage code redistribution, and hemorrhagic stroke rose from the 7th place to the 5th place (Table 4).
Table 4
Top 5 causes of death by YLLs in 2012 with and without garbage code death redistribution
YLLs, years of life lost.
*The mortality data from 2010 were applied because prevalence data from 2010 were used to calculate the disability-adjusted life years; †Including tracheal and bronchial cancer.
![]()
After redistributing all diseases into 21 sub-classifications, neoplasms represented 30.3% of the total YLLs, whereas cardiovascular and circulatory diseases accounted for 19.0%, and self-harm and interpersonal violence for 15.3%. These three disease groups comprised 64.6% of the total YLLs (Fig. 7).
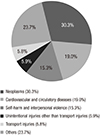 | Fig. 7Proportion of years of life lost by disease group in Korea in 2012 after garbage code redistribution.
|
For age-specific YLLs, preterm birth complications contributed the most YLLs (384 per 100,000 individuals aged 0–9 years), while self-harm contributed the most among those aged 10–59 years. Among individuals aged 60–69 years, lung cancer contributed the most YLLs (866 per 100,000 individuals), while among individuals aged ≥ 70 years, ischemic heart disease contributed the most YLLs (Table 5).
Table 5
Most common diseases and related YLLs by age group*
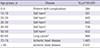
YLLs, years of life lost.
*Garbage code deaths were redistributed; †The mortality data from 2010 were applied because prevalence data from 2010 were used to calculate the disability-adjusted life years; ‡Including tracheal and bronchial cancer.
![]()
DISCUSSION
In this study, we measured the YLLs in Korea during 2010–2012 after applying a garbage code redistribution algorithm. The total YLL were 2,208 thousand in 2012. In addition, self-harm contributed the most YLLs (573 per 100,000 individuals), followed by ischemic heart disease and lung cancer. The annual proportion of garbage codes was approximately 25% from 2010 to 2012.
According to the GBD 2010 Study, ischemic heart disease, ischemic stroke, hemorrhage stroke, chronic obstructive pulmonary disease, and lower respiratory infections were the most common CoD worldwide. In Korea, ischemic stroke, ischemic heart disease, lung cancer, hemorrhage stroke, and self-harm were the most common CoD by GBD 2010 study (3). However, in this study, ischemic heart disease, ischemic stroke, lung cancer, self-harm, and hemorrhagic stroke were the most common CoD; these results are quite different from the GBD 2010 Study results. This may be due to differences in the data source or the garbage code algorithm. Actually, the original CoD data from the Statistics Korea showed that the most common CoD was lung cancer followed by ischemic stroke, ischemic heart disease, self-harm, and liver cancer. This change in order was also presented in YLLs. The rank of YLLs with and without garbage code death redistribution was different except self-harm. This indicates that using raw data to estimate CoD is not sufficient for estimating the burden of disease. Therefore, additional consideration is required when ranking diseases for health care policymaking, and health care policy measures for cardiovascular disease prevention are warranted.
In 2012, the total YLLs were 2,208 thousand, showing a slight increase from 2007 (2,188 thousand YLLs) (1). In 2012, the total YLL for men were 1,361 thousand, which was 1.6 times higher than that for women (847 thousand). Among men, the number of YLLs was the highest among those aged 50–59 years (308 thousand), while among women, the number of YLLs was the highest for those aged 70–79 years (180 thousand). The results for men are consistent with those from a previous study (1). Furthermore, unlike the age-specific mortality rate, which increases with age, the YLLs remained the highest among men aged 50–59 years. In particular, the YLL for those aged 30–59 years were 676 thousand in 2012, comprising 50% of the YLL for men and 30% of the total YLL. The premature death of individuals in the productive age group who support their household economy signifies a huge loss for the country (1). Therefore, measures to prevent loss due to premature deaths in the productive age group are urgently needed.
In addition, while ischemic heart disease contributed the most to the number of deaths, self-harm contributed the most to YLLs. This may be explained by the relatively high number of deaths at young ages due to self-harm. Diseases with high rates of YLLs signify a great burden on society, and hence, policy measures to reduce YLLs are required. In particular, self-harm, which is categorized as a preventable mortality but is the leading CoD among those in the productive age group, requires further attention (18).
Furthermore, among disease groups, cancer showed a tendency to rank lower in both the number of deaths and YLLs after applying the garbage code redistribution algorithm. On the contrary, cardiovascular diseases tended to rank higher, which may be because 47% of senility deaths, which comprise the highest proportion of all garbage code deaths, were redistributed to cardiovascular disease. Furthermore, 87% of heart failure deaths and 98% of high blood pressure deaths were redistributed to cardiovascular disease, which may also contribute to the high ranking.
Per the GBD 2010 Study, the proportion of garbage code deaths was the lowest in Finland at 5.5% and the highest in Sri Lanka at 69.6% (8). In New Zealand, the proportion of garbage codes was 10.4% for all deaths (9), while in United Kingdom, this value was 17.5% (19). On the other hand, according to a WHO report, the value in Haiti was estimated to be 32%–52% and in Thailand, the value was estimated to be 39%–54% (14). Thus, although the proportion of garbage code deaths in Korea is relatively low when compared to that in other developing countries, it is still higher than the proportion in other developed countries. This implies a need to redistribute CoD to increase the validity of the cause-specific mortality rates.
The proportion of garbage code deaths tended to increase with age. For example, in individuals aged 0-9 years, the proportion of garbage code was 11.8%. On the other hands, in case of ≥ 80 years, the proportion was 37.5%. It seems that accurate diagnosis of CoD becomes more difficult with age as the number of comorbidities increases (720). Also, the total number of deaths was 1.23 times higher for men than that for women, but the number of garbage code deaths was 1.11 times higher in women (29%) than in men (21%). This may be explained by the longer life expectancy for women as well as differences in CoD between men and women. For example, the leading cause of death for women is ischemic heart disease, for which garbage code deaths were most frequently redistributed. However, further research regarding the cause of gender differences is necessary.
This study has some limitations. For example, we used a modified garbage code redistribution algorithm based on the GBD 2010 Study, and although garbage code algorithms, like those in New Zealand and the United Kingdom, are widely used, these algorithms need to be further validated among different populations, including Korean populations. Therefore, studies examining the real cause of death in Korea are needed in the future.
Accurate estimation of YLLs is important for epidemiological research and policymaking, and estimation of CoD and YLLs should be enhanced. The results of this study showed that self-harm contributed the most to YLLs, followed by ischemic heart disease and lung cancer. In addition, the results showed that garbage code deaths that were inaccurate or did not represent the underlying CoD for 25% of all deaths every year from 2010 to 2012. Thus, the applied algorithm and results of this study may help to estimate the burden of disease more accurately by identifying the specific cause of mortality. Furthermore, these results may be used to prioritize diseases when allocating limited health care resources and establishing related policies.
 XML Download