

 PDF
PDF ePub
ePub Citation
 Print
Print


INTRODUCTION
Cardiovascular disease remains the leading cause of morbidity and mortality throughout the world. A large proportion of patients who develop sudden cardiac death or nonfatal myocardial infarction do not experience prior symptoms: indeed, as many as 50% of myocardial infarctions occur in persons without a known history of symptomatic coronary artery disease (CAD) (1). Therefore, it is important to identify individuals at risk of coronary events before they develop clinical symptoms.
To assess the cardiovascular risk in healthy individuals, most clinicians use a combination of traditional risk factors. Of the various risk-estimation systems that are available, the Framingham risk score (FRS) is the system that is most commonly used to predict 10 year cardiovascular risk (2). This system is based on history and clinical and laboratory measurements. However, although it is used as the gold standard for evaluating screening techniques, it fails to identify many people who are destined to have a coronary event (3). Therefore, noninvasive imaging tests such as coronary artery calcium (CAC) scoring and coronary computed tomography angiography (CCTA) have been evaluated for their ability to screen for CAD. It has been shown that CAC scoring can predict coronary events better than FRS, with subjects with severe CAC (≥ 300 or 400) having the greatest risk (4567). CCTA is also considered to be a very accurate diagnostic tool for detecting obstructive CAD (8). Several recent guidelines have recommended that CAC scoring should only be used to estimate the cardiovascular risk of the intermediate risk population (defined as an FRS-estimated 10 year risk of between 10% and 20%) (9). Several guidelines also consider CCTA for diagnosing CAD in asymptomatic populations, but none of these guidelines actually recommend the use of CCTA for screening (101112). Actually, the Framingham risk estimate is often invoked as a gatekeeper for imaging techniques, such as CAC scoring and CCTA (1314).
Recent data from the Multi-Ethnic Study of Atherosclerosis (MESA) suggest that the yield of screening for advanced CAC burden (CAC ≥ 300) is higher in the low to intermediate risk individuals (FRS of 5.1%–20.0%) (15). Additionally, it has been suggested that if subjects classified as low risk in the FRS system are excluded from further screening, about two-thirds of women and a quarter of men with substantial atherosclerosis will be missed (16). However, the relationships between FRS and CAC and CCTA-detected CAD remain poorly understood.
The present study was performed to evaluate the distribution of CAC scores and the prevalence of CCTA-detected CAD in the various FRS strata. Whether lower risk populations could benefit from screening with CAC scoring and CCTA was also assessed.
MATERIALS AND METHODS
Study population
Between January, 2008, and December, 2009, 2,276 participants (40–79 years of age) underwent CCTA in a health examination at the Asan Medical Center, Seoul, Korea. Participants with a past history of CAD (n = 148) or stroke (n = 32) were excluded. Participants with diabetes (n = 294) were also excluded because they were considered to be at high cardiovascular risk according to the National Cholesterol Education Program Adult Treatment Panel (NCEP-ATP) III guidelines (17). Participants who were using lipid-lowering agent (n = 41) were excluded, as were participants whose CAC scores were not measured (n = 15). Thus, in total, 1,854 asymptomatic participants (1,232 men and 622 women) were included in the analyses.
Cardiovascular risk factors
The medical history of myocardial infarction, angina, hypertension, stroke, diabetes mellitus, smoking, and current medication profile were determined by using a systemized questionnaire. Body weight, height, body mass index (BMI), and blood pressure were also measured during the visit of each participant. Total cholesterol, high-density lipoprotein cholesterol, low-density lipoprotein cholesterol, triglyceride, fasting plasma glucose, and serum creatinine levels, and white blood cell (WBC) counts were measured after a fasting period of at least 12 hours on the same day of examination.
Framingham risk score
The 10 year FRS of each participant was calculated on the basis of age, sex, total and high-density lipoprotein cholesterol levels, any smoking in the past years, blood pressure, and the use of antihypertensive medication by using the risk prediction functions of the NCEP-ATP III guidelines (17). The FRS predicts the 10 year risk of coronary events (fatal/nonfatal myocardial infarction or sudden death). On the basis of the concurrent 10 year FRS, the participants were classified as very low risk (0%–5% risk of an event within 10 years), low risk (5.1%–10%), intermediate risk (10.1%–20%), and high risk (> 20%).
Computed tomography and data acquisition
Computed tomographic examinations were performed with a 64-slice scanner VCT XT (General Electric, Milwaukee, WI, USA). First, a CAC scan without contrast was performed, followed by CCTA. Subjects with a heart rate > 70 beats/min were given beta-blocking agents before scanning. Each subject was also given nitroglycerine 0.6 mg sublingually 1 minute before scanning. A standard scanning protocol was utilized with 64 × 0.625 mm slice collimation, 350 ms rotation time, 80–120 kV tube voltage, and 500–800 mA tube current, depending on subject body habitus. All scans were performed by using electrocardiogram-gated dose modulation. A bolus of 80 mL iomeprol (Iomeron 400, Bracco, Milan, Italy) was injected intravenously (4 mL/sec), followed by a saline flush of 50 mL.
A region of interest was placed on the descending thoracic aorta and image acquisition was initiated automatically once a selected threshold (150 Hounsfield units [HU]) was reached, with bolus tracking. The electrocardiogram of each subject was recorded simultaneously to permit retrospective segmental data reconstruction. The images were initially reconstructed at the mid-diastolic phase (75% of the R-R interval) of the cardiac cycle. The mean radiation dose was 4.7 ± 1.6 mSv.
Computed tomographic data analysis
All data were analyzed on a remote workstation (Advantage Workstation; General Electric, Milwaukee, WI, USA). Each lesion was identified by using a multiplanar reconstruction technique and the maximum intensity projection of short-axis, two-chamber, and four-chamber views.
The contrast-enhanced portion of the coronary lumen was traced semi-automatically at the maximal stenotic site and compared to the mean value of the proximal and distal reference sites. A stenosis exceeding 50% was defined as significant. CAD was defined as significant (≥ 50%) luminal diameter stenosis of the coronary artery in the presence or absence of coronary calcium.
Statistical analysis
Continuous variables were compared by using Student's t test or the Mann-Whitney U test, and categorical variables were compared by using χ2 or Fisher's exact test, as appropriate. Baseline characteristics were compared on the basis of the presence of CAD. The distributions of CAC and the prevalence of CAD in the various FRS strata were compared by using χ2 test with Bonferroni multiple comparison post hoc analysis. The comparison was performed again after stratification by sex. The yield of screening for CAD was assessed by determining the number needed to screen (NNS), which was calculated by dividing the total number of participants in each FRS stratum by the number of people with CAD within that FRS stratum (15). The NNS defines the number of people who need to be screened to identify one asymptomatic individual with CAD in each FRS stratum. Multivariate logistic regression analyses were conducted to determine the odds ratio (OR) of significant CAC and CAD in the FRS strata. Adjusting variables were BMI, glucose, and WBC count.
All statistical analyses were performed with SPSS (version 19.0 for Windows, SPSS, Inc., Chicago, IL, USA). All statistical tests were 2-tailed, and a P value < 0.05 was considered to be statistically significant.
RESULTS
Baseline characteristics
Table 1 shows the clinical characteristics of all subjects and the subjects with and without CAD. There were 114 participants with CAD (6.1%). The two groups differed significantly in terms of most classical risk factors.
Table 1
Baseline characteristics of the whole study population and the subjects with and without coronary artery disease (CAD)
Data are expressed as No. (%), mean ± standard deviation, or median (1st-3rd quartile).
CAD, coronary artery disease; BMI, body mass index; SBP, systolic blood pressure; DBP, diastolic blood pressure; HDL, high-density lipoprotein; LDL, low-density lipoprotein; WBC, white blood cell; FRS, Framingham risk score; CAC, coronary artery calcium.
*Of those with CAC score > 0 and expressed as median (1st-3rd quartile).
![]()
Distribution of CAC and prevalence of CAD in the various FRS strata
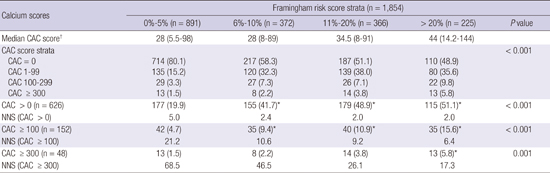
Table 2 shows the distributions and prevalence of the CAC score categories in the various FRS strata. The CAC scores rose significantly as the FRS increased (all P for trend < 0.01).
Table 2
Distribution of coronary artery calcium (CAC) scores and numbers needed to screen (NNS) in the various Framingham risk score (FRS) strata
Values are median (1st–3rd quartile) or number (%). The P values were obtained by using χ2 test.
CAC, coronary artery calcium; NNS, number needed to screen to identify one individual with a CAC score above a specified CAC cut-off point, within each specified stratum; SD, standard deviation.
*
P < 0.0083 versus very low Framingham risk score (1%–5%), as determined by Bonferroni multiple comparison post hoc analysis; †Of those with CAC score > 0.
![]()
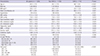
Table 3 shows the prevalence of CAD in the various FRS strata. It was low in very low risk individuals (FRS ≤ 5%) but significantly higher in the low and intermediate risk FRS subjects. About half (48.2%) of the subjects with CAD belonged to the very low and low risk FRS strata. The NNS to detect one participant with CAD decreased as the FRS rose. When the data were further stratified by sex, the prevalence of CAD correlated persistently with FRS in men (P for trend = 0.013). However, a different pattern was observed for the women: almost all of the women (620, 99.7%) were stratified into the very low and low FRS groups, and all of the CAD cases in women were in the latter groups.
Table 3
Prevalence of coronary artery disease and the number needed to screen in the various Framingham risk score strata

Values are number (%). The P values were obtained by using χ2 test.
CAD, coronary artery disease; NNS, number needed to screen to identify one individual with CAD, as detected by coronary computed tomography angiography, within each Framingham risk score stratum.
*
P < 0.0083 vs. very low Framingham risk score (0%–5%), as determined by Bonferroni multiple comparison post hoc analysis; †
P < 0.0083 vs. low Framingham risk score (6%–10%), as determined by Bonferroni multiple comparison post hoc analysis.
![]()
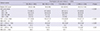
Of the individuals in the very low and low FRS strata, subjects with a CAC score of > 0 had a significantly higher prevalence of CAD (45/332, 13.6%) than the subjects with a CAC score of 0 (10/931, 1.1%) (P < 0.001, data not shown).
Prevalence of CAD in various CAC score strata
Table 4 shows how the presence of CAD associates with CAC score strata. Of the subjects with a CAC score of > 0, 95 (15.2%) had significant coronary artery stenosis. In the moderate-severe CAC score stratum, the prevalence of CAD was 38.2%. The NNSs for CAD in the moderate and severe CAC score groups were 3.6 and 1.7, respectively. When stratified by sex, the prevalence of CAD increased significantly as the CAC score rose in both men and women. In the subgroup analysis of the patients with a CAC score of 0, 19 (1.5%) subjects had CAD. Most (16, 84%) were men. These participants were classified in the very low (n = 5), low (n = 5), intermediate (n = 5), and high (n = 4) FRS groups.
Table 4
Prevalence of coronary artery disease and number needed to screen in the various coronary artery calcium (CAC) score strata

Values are number (%). The P values were obtained by χ2 test.
CAC, coronary artery calcium; CAD, coronary artery disease; NNS, number need to screen.
*
P < 0.008 vs CAC score = 0 stratum, as determined by Bonferroni multiple comparison post hoc analysis; †
P < 0.0083 versus CAC score 1-99 stratum, as determined by Bonferroni multiple comparison post hoc analysis; ‡
P < 0.0083 versus CAC score 100-299 stratum, as determined by Bonferroni multiple comparison post hoc analysis.
![]()
Multivariate logistic regression analysis of significant CAC scores and CAD according to FRS strata
In unadjusted analysis, compared to the very low risk group as a reference, the ORs for CAD were significantly high in the low, intermediate, and high risk FRS groups (Table 5). Furthermore, in multivariate logistic regression analysis adjusting for BMI, glucose, and WBC count, the low risk group (FRS 6%–10%) as well as the intermediate and high risk groups also had significantly increased ORs for occult CAD compared to the very low risk group (FRS ≤ 5%) (P < 0.05).
Table 5
Multivariate logistic regression analysis of significant coronary artery calcium (CAC) score and the presence of coronary artery disease in the various Framingham risk score strata

Model adjusted for body mass index, glucose, and white blood cell count.
OR, odds ratios; CI, confidence interval; CAC, coronary artery calcium; CAD, coronary artery disease.
*
P value < 0.05.
![]()
DISCUSSION
The major findings of the present study were: 1) a total of 6.1% of participants had occult CAD that was detected by CCTA; 2) about half (48%) of those with CAD belonged to the very low and low FRS groups; 3) the distribution of CAC scores and the prevalence of occult CAD associated significantly with 10 year FRS strata in men but not in women, because almost all of the women were classified into very low and low FRS groups; 4) in multivariate analysis, the low risk group as well as the intermediate and high risk groups had significantly increased ORs for occult CAD when compared to the very low risk group.
The FRS is suggested to be the first step in CAD assessment and to serve as a gatekeeper for imaging modalities, such as CAC scoring and CCTA (1314). Current guidelines recommend that CAC scoring should only be used in the intermediate CAD risk population, namely, those whose estimated 10 year risk (FRS) is between 10% and 20% (9). However, several studies suggest that it may not be appropriate to base treatment strategies on FRS alone; recent studies also revealed that CAC scoring and CCTA may reclassify persons into more appropriate risk categories, thereby providing a better insight into the occult CAD in apparently healthy individuals (162021). Moreover, one of the multi-ethnic study of atherosclerosis (MESA) studies reported that the yield of screening for advanced CAC burden (CAC ≥ 300) is higher in low to intermediate risk individuals, namely, those with an FRS of 5.1%–20.0% (15).
In the present study, the NNS was used as a tool to evaluate the yield of screening for occult CAD across FRS and CAC score strata, similar to another study (17). Regarding the individuals with occult CAD in the present study, the NNS decreased significantly as the FRS became more severe. However, when stratified by sex, the only significant difference was the difference between very low and high FRS strata in men. Moreover, it is difficult to use FRS for women because almost all of the women in the present study were classified into the very low and low risk FRS strata. After using CAC scoring to stratify the same population, the NNS was 64.6 and 12.8 for individuals with CAC scores of 0 and 1–99, respectively, and 3.6 and 1.7 for those with CAC scores of 100–299 and ≥ 300, respectively. Thus, there was a 38-fold difference in the NNSs for occult CAD between CAC scores of 0 and ≥ 300, and a 5-fold difference in the NNSs of CAC scores of 0 and 1–99. These trends remained significant after stratification of the basis of sex. This suggests that the yield of screening is substantially different for individuals with a CAC score of 0 compared to those with a CAC score of more than 0. This result is consistent with the observations of the previous study from MESA (422).
In addition, multivariable analysis did not show a significant correlation between the FRS strata and the prevalence of occult CAD. Compared to the very low risk group (FRS ≤ 5%), the low risk group (FRS 6%–10%), along with the intermediate and high risk groups, had a significantly increased OR for occult CAD. By contrast, when compared to CAC score of 0 as the reference stratum, the ORs for occult CAD increased significantly as the CAC score became more severe (supplement Table). This finding also suggests that CAC scoring outperforms FRS in terms of screening an asymptomatic population for occult CAD.
Although coronary angiography is generally accepted as the gold standard for diagnosing the presence of CAD, it is difficult to use coronary angiography as a screening test for asymptomatic individuals because of its highly invasive nature. Instead, CCTA has been proposed as a powerful noninvasive diagnostic test for visualizing the coronary arteries and the manifestations of coronary atherosclerosis (23). The prevalence of CAD in the asymptomatic population, as detected by CCTA, is approximately 5%–7% (21). Similarly, the prevalence of CCTA-detected occult CAD in the present study was 6.1%, which indicates that the prevalence of occult CAD in apparently healthy individuals is not negligible. However, it is questionable whether CCTA could be a routine screening modality because of problems relating to radiation exposure and cost-effectiveness.
The present study had several limitations. First, all participants underwent a general health evaluation, which suggests that a selection bias may have been present. Second, all participants were from the same ethnic background and lived in the same geographical region. Therefore, the generalizability of the findings of the present study to the worldwide population may be limited. Finally, it remains possible that some of the CAD cases detected by CCTA were not true lesions because CT has the tendency to overestimate the severity of luminal stenosis and image artifacts are the major cause of false-positive and false-negative interpretations, as we did not perform invasive coronary angiography in the subjects with CCTA-detected CAD.
In conclusion, the 10 year FRS estimate is of limited usefulness as a screening modality for coronary atherosclerosis in an asymptomatic population because approximately half of the individuals with CCTA-detected occult CAD were misclassified into very low and low risk groups on the basis of FRS. Moreover, almost all women, including those with CAD, were classified into these groups and therefore, FRS did not associate independently with the presence of CAD. By contrast, CAC scoring associated significantly with occult CAD in both men and women. This study also showed that the yield of screening for significant CAC scoring and occult CAD was low in the very low risk population but rose in the low and intermediate risk subjects. These findings suggest that CAC scoring may be useful screening tools for identifying subjects with occult CAD in the low and intermediate risk populations.
 XML Download