Journal List > J Korean Med Sci > v.31(6) > 1023302

Bhang, Ha, Park, Ha, Hong, Kim, Lee, Lee, Kim, Jeong, Jeong, Lee, and Kim: Maternal Stress and Depressive Symptoms and Infant Development at Six Months: the Mothers and Children's Environmental Health (MOCEH) Prospective Study

Abstract

Our objective is to evaluate the relationships between prenatal maternal stress and depressive symptoms, respectively, and infant neurodevelopment at 6 months, adjusted for heavy metals and oxidative stress. This research is a part of a multi-center birth cohort study in South Korea. Information on stress and depressive symptoms was collected during the first trimester using Psychosocial Well-Being Index Short Form (PWI-SF) and Center for Epidemiological Studies Depression Scale (CES-D). The Korean Bayley Scales of Infant Development-II assessment (BSID-II), which includes the standardized mental development index (MDI) and psychomotor developmental index (PDI), and Korean Ages & Stages Questionnaires (K-ASQ) were applied to infants at six months of age. A higher index score indicates better development. Among 641 babies, 320 were female (50%). Maternal PWI ≥ 29 (vs. PWI ≤ 18) during early pregnancy was associated with a decrease in MDI scores of 5.37 points (P = 0.02) after adjusting for socioeconomic factors. Maternal CES-D ≥ 26 (vs. CES-D ≤ 10) during early pregnancy was associated with a decrease in MDI scores of 8.18 points (P = 0.01). The associations remained significant even after adjustment for lead, cadmium, and MDA levels (P < 0.05). However, no association was found between maternal PWI/CES-D and PDI score. No interaction was observed between stress and lead exposure. We found an inverse association between prenatal maternal stress and depressive symptoms, and MDI scores in 6-month-old infants after adjustment for prenatal lead exposure, which is known to affect cognitive function negatively.

Graphical Abstract

jkms-31-843-ab001

INTRODUCTION

It is well known that stress during pregnancy has negative effects on physical outcomes (1), such as pre-eclampsia, miscarriage, preterm birth, and low birth weight. In addition to the physical growth that takes place during gestation, the prenatal period may be a critical window that determines the level of health during both childhood and adulthood. It is suggested that antenatal maternal stress can negatively affect fetal neurodevelopment in animals and humans (2). Maternal self-report of elevated stress, depression and anxiety during pregnancy is associated with delayed infant cognitive and motor development (34). This delay in cognitive development may persist into adolescence, although this result is not obtained in all studies (5).
Maternal stress can release cortisol and other stress-related hormones into the blood stream. Children of mothers in the Netherlands who had higher concentrations of morning cortisol during pregnancy had higher concentrations of cortisol themselves (6). In addition to cortisol and other stress-related molecules, there is a report which states psychological stress induces oxidative damage (7). Oxidative stress has a harmful effect during pregnancy (8910). It has been suggested that among the accepted measures used for analyzing oxidative stress, including lipid peroxidation and amino acid oxidation products, oxidative DNA damage, and activity of the antioxidant defense, malondialdehyde (MDA) level is an appropriate and robust biomarker (11). A previous case control study measuring MDA oxidants reported that remarkably high levels of MDA oxidants suggest an oxidative imbalance in pediatric patients with attention deficit hyperactivity disorder (ADHD) (12).
In the prenatal period, the heavy metal level can negatively affect fetal development. Lead exposure is suggested to be a risk factor for decreased attention and other cognitive functions and impaired spatial working memory, attention set shifting, and executive control (13), Growing concerns about the effect of cadmium exposure on children's health (14) have been reported. A study from the Oswego Newborn and Infant Development Project (15) measured the lead, Hg as well as prenatal stress, but they focused on the heavy metals rather than prenatal stress.
As suggested in prior studies, large population-based cohort studies combining repeated multi-dimensional and standardized perinatal maternal stress measurements with biomarkers of heavy metal exposure are needed to understand perinatal maternal stress etiology and pathophysiology in human populations (1). Our objective is to evaluate the relationships between prenatal maternal stress and depressive symptoms, and infant neurodevelopment at 6 months, after adjustment for prenatal heavy metal exposure, which is known to affect cognitive function negatively.

MATERIALS AND METHODS

Study subjects

This research is a part of the Mothers and Children's Environmental Health (MOCEH) study (16), which is a multi-center birth cohort study in South Korea. The study sample was comprised of women who were in their first trimester of a normal (not at-risk) pregnancy with a single fetus who registered at the local center of the MOCEH study from August 2006 to December 2009. Among 1,286 participants recruited, scores of 6-month development were available for 648 babies. In addition, we excluded data on children born before 37 weeks of gestational age yielding a final sample of 641 mother-baby dyads.
All participants were interviewed by trained interviewers. Included in the interview were questions relating to diet, demographic and socioeconomic factors, medical history and health-related behavior. Blood samples were collected from mothers (first trimester and delivery) and from umbilical cords at delivery. Because the procedure used in the study has been reported in detail (16), here we provide only a brief description of the study process.

Korean Bayley Scales of Infant Development-II (BSID-II) assessment

The BSID-II produces indicators of infant neurodevelopment from birth to 3 years (17). Each test produces developmental indices, which are expressed as the mental developmental index (MDI) and the psychomotor developmental index (PDI). The MDI consists of developmental tasks that assess mental capabilities in children, including sensory and perceptual acuities, object constancy, memory, learning, problem solving, early verbal communication, early abstract thinking ability, and early number conceptualization. The PDI consists of developmental tasks that gauge body control, such as fine and gross motor skills. The MDI and PDI each have a mean of 100 and a standard deviation of 15 (composite score that compares the child's developmental performance with the norms for typically developing Korean children of the same age in the Korean general population). A standard score of 70 or below, which is 2 standard deviations below the mean, on the MDI or PDI component of the BSID-II was considered abnormal. Training of raters in each center on the BSID-II was coordinated by a specialist before commencing the evaluation of the infants. Inter-rater reliability (kappa value > 0.8) was confirmed annually through rater training sessions and video monitoring of the examination process. All test procedures and interpretation of the results took place according to “The Standards for Educational and Psychological testing” recommended by the American Psychological Association. BSID-II tests were conducted on infants at 6 months of age. Each measurement was double-checked and confirmed through feedback between the examiner and the central coordinator (BNK).

Korean Ages & Stages Questionnaires (K-ASQ)

Researchers including Bricker and Squires (18) developed the ASQ in 1995. Each questionnaire contains items designed to assess infant development in the areas of communication, gross motor, fine motor, problem solving, and personal-social skills. Mothers completed the K-ASQ at six months of age.

Psychosocial Well-Being Index-Short Form (PWI-SF)

The stress level of the mothers was measured with the PWI-SF questionnaire based on the General Health Questionnaires-60 and developed by Chang (19). The internal consistency (Cronbach's α coefficient) of the PWI-SF was 0.90 in the study by Chang. When the total score was greater than or equal to 27, the respondent was said to be experiencing stress. Mothers completed the questionnaire at the recruitment day (first trimester).

Center for Epidemiological Studies Depression Scale (CES-D)

Maternal depression status was measured using the CES-D developed by Kohout et al. (20) The total score was calculated by adding up the scores of the 20 questions, and when the total score was greater than or equal to 25, the mother was said to be experiencing depression (21). The CES-D Scale has been demonstrated to be a valid and reliable epidemiological tool in diverse populations, including pregnant women (22). Mothers completed the questionnaire on the recruitment day (first trimester).

Determination of cadmium and lead in whole blood

To assess the levels of heavy metals in whole blood, 1-mL blood samples were drawn into standard commercial evacuated tubes containing sodium heparin (Vacutainer®, BD, Franklin Lakes, NJ, USA). Blood cadmium and lead were measured by graphite furnace atomic absorption spectrometry with Zeeman background correction (Perkin Elmer AAS800, Perkin Elmer, Waltham, MA, USA). All blood metal analysis was carried out by Neodin Medical Institute, a laboratory certified by the Korean Ministry of Health and Welfare.
For the internal quality assurance and control program, commercial reference materials were used (Lyphochek® Whole Blood Metals Control, Bio-Rad, Hercules, CA, USA). The method detection limits for blood cadmium and lead in the present study were 0.056 μg/L and 5.8 μg/L, respectively. For participants with blood levels below the detection limit, we assigned a level equal to the detection limit divided by the square root of 2 (23).

Malondialdehyde (MDA)

Urinary MDA was determined by measuring adduct obtained with a 23 mmol/L solution of thiobarbituric acid reagent (TBA) (Merck, Damstadt, Germany). A 10 mmol/L stock standard of MDA (Aldrich, Milwaukee, WI, USA) was then prepared by dissolving 247 μL of 1,1,3,3-tetraethoxypropane (Sigma, St. Louis, MO, USA) in 100 mL of aqueous ethanol (40% ethanol by volume). TBA-MDA adducts were then prepared in glass tubes with a polypropylene stopper. In each tube, 300 μL of phosphoric acid (0.5 M) was mixed with 50 μL of urine and 150 μL of TBA reagent. Next, the tubes were stoppered and heated to 95°C for 1 hour. The tubes were then cooled in ice water for 5 minutes and methanol (500 μL) was added to the tubes. Thereafter, the tubes were centrifuged at 5000 × g for 5 minutes. Samples were then transferred to glass autosampler vials and 20-μL aliquots were analyzed by HPLC (DX-500, Dionex, Sunnyvale, CA, USA). The concentration of TBA-MDA adduct was determined at 532 nm using a Nova-Pak C18 column (Waters-Millipore, Milford, MA, USA) that was eluted with a mobile phase of potassium phosphate buffer (50 mmol/L, pH 6.8), and methanol (58:42, v/v) at a flow rate of 0.8 mL/min.

Statistical analysis

Blood lead and cadmium concentrations, and MDA were natural log transformed to normalize their distributions. We examined the potential nonlinearity of the association between the PWI and MDI using penalized splines in generalized additive models (GAMM procedure in R, F = 2.90, P = 0.04). Three categories were applied: For PWI, 0–50 percentile (0–18 point) vs. 51–90 percentile (19–28 point) vs. 90–100 percentile (29– point). For CES-D, 0–50 percentile (0–10 point) vs. 51–95 percentile (11–25 point) vs. 96–100 percentile (26– point). Here, the highest groups of PWI and MDI were defined as the top 10 percentile or 5 percentile of PWI and CES-D scores, respectively, based on the classification in Korea of PWI score ≥ 27 as stressed and CES-D score ≥ 25 as depressive.
We examined the relationships of potential confounders with neurodevelopment assessed by the BSID-II and K-ASQ. We included the variable small for gestational age (SGA), indicating fetal growth restriction in utero. The characteristics of the variables were analyzed using t-tests or analysis of variance (ANOVA). To select covariates for inclusion in the multivariate models, we looked for the literature to identify risk factors related with heavy metal exposure or infant neurocognitive development (24). The key covariates used in this study were the following: maternal age at conception, residential area, alcohol consumption, exposure to smoking, family income, paternal education level, presence of SGA, gender of the newborn, and feeding type. The relationships between prenatal maternal stress and depressive symptoms, and infant neurodevelopment were examined using multiple regression. Statistical analysis was conducted using SPSS 19.0 version (SPSS, Chicago, IL, USA) and R version 2.15.0 (The R Foundation for Statistical Computing, www.r-project.org). All statistical significance testing was two-sided with α-error of 0.05.

Ethics statement

Study protocols and informed consent forms were approved by the institutional review boards of Ewha Womans University (Seoul) (IRB No. 12-07B-15), Dankook University Hospital (Cheonan) (IRB No. 2011-09-0340), and Ulsan University Hospital (Ulsan) (IRB No. 06-29), all located in the Republic of Korea. All subjects submitted informed consents before enrollment.

RESULTS

Participant characteristics

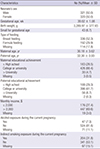
There were no significant differences between infants with (641) and without data on neurodevelopment (645) with respect to maternal age, paternal age, income status, PWI score and CES-D score. Among 641 babies, 320 were female (50%). Mean gestational age was 39.02 ± 1.08 weeks. Maternal age at conception was 30.18 ± 3.62 years, and paternal age was 32.30 ± 3.93 years. Forty three (6.7%) babies were categorized as SGA. The rate of breastfeeding was 52.3% (Table 1). Means and SD of MDI and PDI scores by potential confounders are shown in Table 2. The mean PWI score during pregnancy was 18.12 ± 7.11, and the mean CES-D score was 11.61 ± 7.43. Distributions of MDA, lead, and cadmium are shown in Table 3. Because their distribution was skewed, we presented their geometric mean and geometric standard deviation. MDI and PDI score measured by the BSID-II at 6 months of age was related to lead level (delivery) (Table 3).
Table 1

Demographic characteristics of newborns* and their parents

jkms-31-843-i001
Characteristics No (%) / Mean ± SD
Neonate's sex
 Male 321 (50.0)
 Female 320 (50.0)
Gestational age, wk 39.02 ± 1.08
Birth weight, g 3,289.97 ± 377.65
Small for gestational age 43 (6.7)
Type of feeding
 Breast feeding 336 (52.3)
 Formula feeding 192 (29.9)
 Missing 114 (17.8)
Maternal age, yr 30.18 ± 3.62
Paternal age, yr 32.30 ± 3.93
Maternal educational achievement
 ≤ High school 183 (28.5)
 College or university 426 (66.4)
 > University 30 (4.7)
 Missing 3 (0.5)
Paternal educational achievement
 ≤ High school 188 (29.3)
 College or university 396 (61.7)
 > University 56 (8.7)
 Missing 2 (0.3)
Monthly income, $
 ≤ 2,000 176 (27.4)
 > 2,000 447 (69.6)
 Missing 19 (3.0)
Alcohol exposure during the current pregnancy
 Yes 47 (7.3)
 No 524 (81.6)
 Missing 71 (11.1)
Indirect smoking exposure during the current pregnancy
 Yes 204 (31.8)
 No 341 (53.1)
 Missing 97 (15.1)
*Numbers vary due to missing information in some cases.
Table 2

Mean and SD of BSID-II score by demographic characteristics

jkms-31-843-i002
Classification variables No. MDI Score PDI Score
Mean ± SD P value Mean ± SD P value
Maternal age at pregnancy
 ≤ 30 384 96.72 ± 11.88 0.028* 97.28 ± 14.27 0.002
 > 30 256 94.59 ± 12.13 93.46 ± 16.35
Residential area
 Area 1 188 91.02 ± 14.38 < 0.001 89.82 ± 17.02 < 0.001
 Area 2 151 96.20 ± 10.72 97.21 ± 14.80
 Area 3 303 98.50 ± 10.16 98.35 ± 13.47
Alcohol exposure during the current Pregnancy
 Yes 47 94.91 ± 12.81 0.580 94.13 ± 15.04 0.419
 No 524 95.93 ± 11.95 96.03 ± 15.47
Indirect smoking exposure during the current pregnancy
 Yes 204 97.03 ± 11.47 0.061 96.35 ± 14.84 0.456
 No 341 95.06 ± 12.55 95.33 ± 15.75
Monthly income, $
 ≤ 2,000 176 97.44 ± 9.63 0.040* 98.07 ± 13.82 0.030*
 > 2,000 447 95.49 ± 12.75 95.17 ± 15.46
Paternal educational achievement
 ≤ High school 188 97.34 ± 11.09 0.046* 97.28 ± 14.00 0.102
 ≥ College 452 95.26 ± 12.34 95.12 ± 15.70
Gestational age, wk
 37-38 204 93.93 ± 11.05 0.004 93.14 ± 14.95 0.002
 39-40 367 97.38 ± 12.24 97.17 ± 15.40
 41-42 45 96.24 ± 10.58 99.98 ± 12.24
Neonate's sex
 Male 321 95.63 ± 11.96 0.68 94.36 ± 14.97 0.028
 Female 320 96.03 ± 12.14 97.02 ± 15.53
Birth weight, g
 2,300-3,000 143 94.12 ± 12.35 < 0.001 92.73 ± 16.78 0.001
 3,001-4,000 451 96.35 ± 11.57 96.67 ± 14.56
 4,001-4,300 23 104.91 ± 9.25 103.74 ± 12.35
Growth retardation
 Small for gestational age 43 94.72 ± 11.72 0.411 91.95 ± 16.29 0.093
 Normal weight for gestational age 573 96.26 ± 11.85 96.35 ± 15.06
Feeding method
 Breastfeeding 336 96.45 ± 11.51 0.75 95.80 ± 15.14 0.427
 Formula feeding 192 96.11 ± 11.63 96.90 ± 15.53
BSID, Bayley Scale of Infant Development; MDI, mental developmental index; PDI, psychomotor developmental index.
* P < 0.05; P < 0.005; P < 0.001.
Table 3

Distribution of maternal urinary MDA, and lead and cadmium in maternal and cord blood and correlation with Bayley scales and K-ASQ score

jkms-31-843-i003
Biomarkers No. GM ± GSD Percentile B coefficients
10th 25th Median 75th 90th MDI total PDI total K-ASQ total
Lead, µg/dL
 Early pregnancy 623 1.38 ± 1.53 0.80 1.05 1.41 1.84 2.23 -0.21 -0.61 -2.96
 Delivery 538 1.28 ± 1.57 0.76 1.00 1.30 1.72 2.14 -3.82 -3.71* -9.32
 Cord blood 504 0.89 ± 1.62 0.51 0.69 0.92 1.21 1.54 1.19 1.67 -2.09
Cadmium, µg/L
 Early pregnancy 526 1.45 ± 1.74 1.04 1.26 1.51 1.86 2.22 -1.21 -2.06 -0.66
 Delivery 536 1.54 ± 1.38 1.07 1.28 1.55 1.82 2.34 1.03 -0.58 -9.75
 Cord blood 500 0.67 ± 1.38 0.46 0.56 0.65 0.76 1.00 -0.95 1.04 7.06
Urinary MDA, µmol/g cr
 Early pregnancy 557 16.32 ± 2.04 10.90 16.45 22.60 32.03 49.19 1.4 1.64 2.25
 Delivery 417 22.84 ± 2.16 8.51 11.44 16.39 23.95 36.01 0.96 0.37 3.15
MDA, malondialdehyde; K-ASQ, Korean Ages and Stages Questionnaires; GM, geometric mean; GSD, geometric standard deviation; MDI, mental development index; PDI, psychomotor developmental index.
* P < 0.05; P < 0.01.

Prenatal stress and depressive symptoms and infant development

MDI score measured by the BSID-II at 6 months of age was related to maternal stress level and depressive symptoms in early pregnancy, assessed by PWI and CES-D, in multiple linear regression analysis, adjusting for maternal age, residential area, alcohol consumption, indirect smoking, income, parental education level, SGA, sex, and type of feeding from birth to 6 months (Table 4). The PWI ≤ 18 group and the PWI ≥ 29 group significantly differed with respect to MDI. Maternal PWI ≥ 29 during early pregnancy was associated with a decrease in MDI scores of 5.37 points (P = 0.02). At the same time, the CES-D ≤ 10 group and CES-D ≥ 26 group differed significantly with respect to MDI. Maternal CES-D ≥ 26 during early pregnancy was associated with a decrease in MDI scores of 8.18 points (P = 0.005). However, infants' PDI score and K-ASQ at 6 months were not associated with PWI or CES-D. The results show that infants of mothers with high stress levels and depressive symptoms had decreased MDI scores at 6 months of age compared with those whose mothers had low stress levels.
Table 4

Beta coefficients and 95% CI of PWI and CESD score* in multiple linear regression analysis for BSID-II and K-ASQ

jkms-31-843-i004
Outcome variables B coefficients (95% CI) P value B coefficients (95% CI) P value
BSID (MDI) PWI ≤ 18 1 (ref) CESD ≤ 10 1 (ref)
PWI ≥ 19 to 28 0.50 (-2.37–2.47) 0.97 CESD ≥ 11 to 25 0.05 (-2.47–2.37) 0.97
PWI ≥ 29 -5.37 (-9.96–-0.79) 0.02 CESD ≥ 26 -8.18 (-13.93–-2.43) 0.005
BSID (PDI) PWI ≤ 18 1 (ref) CESD ≤ 10 1 (ref)
PWI ≥ 19 to 28 0.76 (-2.35–3.98) 0.64 CESD ≥ 11 to 25 -0.31 (-3.50~2.89) 0.85
PWI ≥ 29 -4.36 (-10.45–1.73) 0.16 CESD ≥ 26 -15.14 (-15.14–0.05) 0.052
K-ASQ (Communication) PWI ≤ 18 1 (ref) CESD ≤ 10 1 (ref)
PWI ≥ 19 to 28 0.55 (-1.60–2.70) 0.61 CESD ≥ 11 to 25 0.26 (-1.86–2.37) 0.81
PWI ≥ 29 -0.16 (-3.89–3.57) 0.93 CESD ≥ 26 -0.09 (-4.90–4.72) 0.97
K-ASQ (Gross motor) PWI ≤ 18 1 (ref) CESD ≤ 10 1 (ref)
PWI ≥ 19 to 28 -0.61 (-2.82–1.59) 0.59 CESD ≥ 11 to 25 0.07 (-2.08–2.23) 0.95
PWI ≥ 29 -0.73 (-4.56–3.01) 0.71 CESD ≥ 26 -0.68 (-5.59–4.23) 0.79
K-ASQ (Fine motor) PWI ≤ 18 1 (ref) CESD ≤ 10 1 (ref)
PWI ≥ 19 to 28 -2.85 (-5.56–-0.14) 0.04 CESD ≥ 11 to 25 -1.07 (-3.67–1.57) 0.43
PWI ≥ 29 -1.75 (-6.46–2.96) 0.47 CESD ≥ 26 0.36 (-5.64–6.35) 0.91
K-ASQ (Problem solving) PWI ≤ 18 1 (ref) CESD ≤ 10 1 (ref)
PWI ≥ 19 to 28 -0.55 (-2.96–1.85) 0.65 CESD ≥ 11 to 25 -0.52 (-2.85–1.82) 0.66
PWI ≥ 29 0.57 (-3.61–4.75) 0.79 CESD ≥ 26 1.40 (-3.92–6.72) 0.61
K-ASQ (Social) PWI ≤ 18 1 (ref) CESD ≤ 10 1 (ref)
PWI ≥ 19 to 28 0.001 (-2.77–2.77) 1.00 CESD ≥ 11 to 25 -1.21 (-3.83–1.42) 0.37
PWI ≥ 29 -1.07 (-5.87–3.74) 0.66 CESD ≥ 26 4.57 (-1.41–10.55) 0.13
K-ASQ (Total score) PWI ≤ 18 1 (ref) CESD ≤ 10 1 (ref)
PWI ≥ 19 to 28 -3.46 (-12.23–5.31) 0.44 CESD ≥ 11 to 25 -2.47 (-10.97–6.05) 0.57
PWI ≥ 29 -3.14 (-18.37–12.09) 0.69 CESD ≥ 26 5.55 (-13.83–24.92) 0.58
BSID, Bayley Scale of Infant Development; K-ASQ, Korean Ages and Stages Questionnaires; PWI, Psychological Well-Being Index; CES-D, Center for Epidemiologic Studies Depression Scale; MDI, mental developmental index; PDI, psychomotor developmental index.
*Adjusted for maternal age, residential area, alcohol drinking, indirect smoking, parental education level, income, presence of small for gestational age, sex, and type of feeding from birth to 6 months.

Potential confounders and mediators: lead, cadmium, MDA

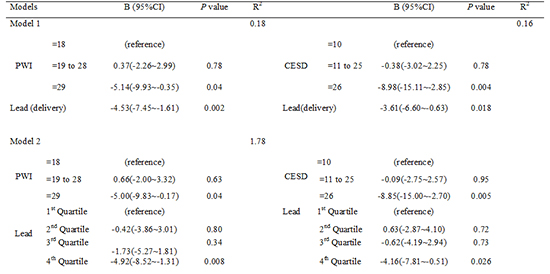
As shown in Table 5, a high PWI and CES-D group was associated with a decreased MDI score when adjusted for additional covariates. When adjusted for all covariates in Model 1 and natural log-transformed lead level, decreased MDI scores were observed in the subjects with maternal PWI ≥ 29 (B = -5.14, P = 0.04) (Model 2). Blood lead level was also inversely associated with MDI score after adjustment for PWI level in Model 2 (B = -4.53, P = 0.002). When adjusted for all covariates in Model 1 and categorical blood lead level (quartile), decreased MDI scores were observed in the subjects with maternal PWI ≥ 29 (B = -5.00, P = 0.04). Highest blood lead quartile was also associated with decreased MDI score after adjustment for PWI level in Model 3 (B = -4.92, P = 0.008). When adjusted for all covariates and natural log-transformed cadmium levels, decreased MDI scores were observed in the subjects with maternal PWI ≥ 29 (B = -6.01, P = 0.01) (Model 4). When adjusted for all covariates and natural log-transformed MDA level in Model 5, decreased MDI scores were observed in the subjects with maternal PWI ≥ 29 (B= -8.09, P = 0.005). For CES-D scores, after adjustment for lead (continuous and categorical variables), cadmium, and MDA levels, the CES-D ≥ 26 group showed decreased MDI scores at 6 months of age (B = -8.98, P = 0.004, for Model 2; B = -8.85, P = 0.005, for Model 3; B= -9.39, P = 0.003, for Model 4; B= -13.46, P = 0.001, Model 5). Blood lead levels as continuous and categorical variables were also inversely associated with MDI score after adjustment for CES-D level in Models 2 and 3. No interaction was observed between stress and lead exposure. SGA was not associated with MDI.
Table 5

Beta coefficients and 95% confidence interval (CI) of PWI and CES-D scores in multiple linear regression analysis for MDI scores (BSID-II) after adjustment for covariates*

jkms-31-843-i005
Models B (95% CI) P value R2 B (95% CI) P value R2
Model 1 0.12 0.12
 Indirect smoking -2.79 (-5.11–-0.47) 0.02  Indirect smoking -2.34 (-4.78–0.03) 0.05
 SGA (vs. normal growth) 0.93 (-0.51–2.37) 0.20  SGA (vs. normal growth) 0.84 (-0.66–2.34) 0.27
 PWI ≤ 18 (reference)  CESD ≤ 10 (reference)
≥ 19 to 28 0.05 (-2.37–2.47) 0.97 ≥ 11 to 25 -0.05 (-2.47–2.37) 0.97
≥ 29 -5.37 (-9.97–-0.79) 0.02 ≥ 26 -8.18 (-13.93–-2.43) 0.005
Model 2 0.18 0.16
 Indirect smoking -1.83 (-4.39–0.73) 0.16  Indirect smoking -1.46 (-4.10–1.18) 0.28
 SGA (vs. normal growth) 0.66 (-0.84–2.16) 0.39  SGA (vs. normal growth) 0.66 (-0.88–2.20) 0.40
 PWI ≤ 18 (reference)  CESD ≤ 10 (reference)
≥ 19 to 28 0.37 (-2.26–2.99) 0.78 ≥ 11 to 25 -0.38 (-3.02–2.25) 0.78
≥ 29 -5.14 (-9.93–-0.35) 0.04 ≥ 26 -8.98 (-15.11–-2.85) 0.004
 Lead (delivery) -4.53 (-7.45–-1.61) 0.002  Lead (delivery) -3.61 (-6.60–-0.63) 0.018
Model 3 1.78
 Indirect smoking -1.70 (-4.31–0.90) 0.20  Indirect smoking -1.23 (-3.59–1.39) 0.35
 SGA (vs. normal growth) 0.97 (-0.59–2.53) 0.22  SGA (vs. normal growth) 0.97 (-0.63–2.57) 0.24
 PWI ≤ 18 (reference)  CESD ≤ 10 (reference)
≥ 19 to 28 0.66 (-2.00–3.32) 0.63 ≥ 11 to 25 -0.09(-2.75–2.57) 0.95
≥ 29 -5.00 (-9.83–-0.17) 0.04 ≥ 26 -8.85(-15.00–-2.70) 0.005
 Lead 1st Quartile (reference)  Lead 1st Quartile (reference)
2nd Quartile -0.42 (-3.86–3.01) 0.80 2nd Quartile 0.63 (-2.87–4.10) 0.72
3rd Quartile -1.73 (-5.27–1.81) 0.34 3rd Quartile -0.62 (-4.19–2.94) 0.73
4th Quartile -4.92 (-8.52–-1.31) 0.008 4th Quartile -4.16 (-7.81–-0.51) 0.026
Model 4 0.156 0.148
 Indirect smoking -2.27 (-4.86–0.32) 0.09  Indirect smoking -1.82 (-4.49–0.86) 0.18
 SGA (vs. normal growth) 1.07 (-0.45–2.58) 0.17  SGA (vs. normal growth) 0.94 (-0.62–2.50) 0.23
 PWI ≤ 18 (reference)  CESD ≤ 10 (reference)
≥ 19 to 28 0.11 (-2.55–2.77) 0.94 ≥ 11 to 25 -0.81 (-3.49–1.88) 0.56
≥ 29 -6.01 (-10.92–-1.21) 0.01 ≥ 26 -9.39 (-15.60–-3.19) 0.003
 Cadmium (delivery) 2.52 (-1.65–6.68) 0.24  Cadmium (delivery) 1.62 (-2.71–5.96) 0.46
Model 5 0.099 0.109
 Indirect smoking -2.59 (-5.66–0.48) 0.10  Indirect smoking -2.16 (-5.40–1.09) 0.19
 SGA (vs. normal growth) 1.44 (-0.44–3.32) 0.13  SGA (vs. normal growth) 1.09 (-0.89–3.06) 0.28
 PWI ≤ 18 (reference)  CESD ≤ 10 (reference)
≥ 19 to 28 -0.59 (-3.95–2.80) 0.74 ≥ 11 to 25 -1.20 (-4.51–2.11) 0.48
≥ 29 -8.09 (-13.77–-2.41) 0.005 ≥ 26 -13.46 (-21.70–-5.23) 0.001
 MDA 1.12 (-0.67–2.91) 0.22  MDA 1.12 (-0.73–2.97) 0.23
MDI, mental development index; BSID, Bayley Scale of Infant Development; PWI, Psychological Well-Being Index; CES-D, Center for Epidemiologic Studies Depression Scale; MDA, malondialdehyde.
In Model 2, blood lead (delivery) was added as a covariate in addition to those of Model 1.
In Model 3, categorical groups of blood lead (delivery) were added as a covariate in addition to those of Model 1.
In Model 4, blood cadmium (delivery) was added as a covariate in addition to those of Model 1.
In Model 5, urinary MDA level (delivery) was added as a covariate to those of Model 1.
*Adjusted for maternal age, residential area, alcohol drinking, indirect smoking, parental education level, income, presence of small for gestational age, and type of feeding from birth to 6 months.

DISCUSSION

In this study, we found an inverse association of prenatal maternal stress and depressive symptoms, with cognitive development in 6-month-old infants after adjustment for blood lead exposure, which was inversely associated with MDI (Table 5, Models 2 and 3). These findings provide more evidence for the adverse effects on children's neurodevelopment of maternal stress exposure during pregnancy.
Antenatal stress can be related to childhood and adolescent emotional and behavioral problems (252627). Children whose mothers experienced high levels of anxiety in late pregnancy exhibit higher rates of behavioral and emotional problems at 33 and 81 months of age (25). Externalizing problems/anxiety (26), atypical handedness (27), and ADHD symptoms (26) in children may correlate with maternal state anxiety. Neurodevelopmental consequences of prenatal stress are reported in motor and cognitive development. Life events in early pregnancy are negatively associated with children's cognition at 6 years (28). High pregnancy-specific anxiety in the mid-pregnancy period predicts low cognition and motor scores at 8 months (3). In addition, prospective studies have found that both mother and fetus are influenced by exposure to psychosocial and biological stresses (4). Among studies that have characterized these dyadic relationships prospectively with low-risk samples, one of the largest studies involving frequent prenatal evaluation included 125 mother-child dyads (29). The authors reported that exposure to elevated maternal anxiety early in pregnancy was independently associated with lower 12-month MDI scores, measured by the Bayley Scales of Infant Development. A study conducted by Huizink (3) in the Netherlands reported that high anxiety in mid-pregnancy predicted low mental and motor developmental scores at 8 months after adjusting for a large number of covariates in 170 mother-infant dyads. Another prospective study by Bergman (2) demonstrated that a greater number of antenatal negative life events were associated with lower MDI scores in 125 infants and toddlers. Keim et al. (30) reported results from the prospective Pregnancy, Infection, and Nutrition Study (2001-2006) showing that maternal trait anxiety and depressive symptoms had little negative influence on 12-month-old infants' cognitive development using the Mullen Scales of Early Learning (n = 358). However, DiPietro et al. (5) reported that levels of anxiety and depression were positively related to MDI and PDI scores from the Bayley scales at 24 months of age. The present finding is consistent with previous studies (232930) in which infants have been assessed between 8 and 12 months of age. In one report, high pregnancy anxiety during gestation was associated with decreased gray matter density in 6 to 9-year-old children (31). However, a previous study (5) reported that higher levels of anxiety and depression were positively related to the MDI and PDI scores on the Bayley scales at 24 months of age. More research is needed to clarify whether the effect of antenatal stress persists as the child develops.
In the present study, we also found an inverse association between lead exposure and cognitive development in 6-month-old infants (Table 5, Models 2 and 3). Prenatal heavy metal exposure can negatively affect fetal development which may interfere with neurocognitive functioning in children. In addition, Fortin et al. (32) reported that the higher level of lead leads to dysfunctions of the hypothalamic-pituitary-adrenal axis function beyond the classical neurotoxic effects (1314). The present study reconfirmed that prenatal lead exposure, expressed as both continuous and categorical variables, is inversely associated with neurocognitive functioning in infants after adjustment for maternal stress. We tested the hypothesis that variables such as stress might have an effect on outcomes in the context of toxicants.
Maternal stress can release cortisol and other stress-related hormones into the blood stream. Children of mothers in the Netherlands who had higher morning concentrations of cortisol during pregnancy had higher concentrations of cortisol themselves (6). In addition to stress-induced release of cortisol and other molecules, psychological stress has also been linked to oxidative damage (7). However, in the present work the oxidation process was found not to be associated with cognitive development (Table 5, Model 5).
In the present study, SGA was not associated with MDI. This finding is not consistent with previous results indicating that fetal growth restriction in utero affects infant neurodevelopment (3334).
The findings of this study have public health implications. They emphasize the importance of assessing prenatal maternal stress and depressive symptoms as well as well-known neurotoxins such as lead when considering neurocognitive effects in infants. In addition, the risks of neurocognitive deficit associated with these factors make their prevention an important public health concern.
The present study had several important strengths. First, the birth cohort study involved a large and experienced research team, enabling good quality control of neurodevelopmental measurements. Second, because the birth cohort study was prospective, we were able to assess the association between prenatal maternal stress and prenatal lead exposure, and neurocognitive development. In addition, we sought to minimize misclassification and selection bias that may have arisen because parents more concerned about their infants may have been more likely to volunteer for this study.
The present study also has several limitations. First, we measured general life stress, but not pregnancy-specific stress. However, the PWI and CES-D are widely used for assessing psychiatric well-being in community samples (19) in Korea. Second, we did not measure postnatal maternal stress and depressive symptoms. However, several reports indicate that prenatal stress affects the child's development independent of the mother's postpartum depression or stress (29). Third, selection bias form evaluating 50% of the enrolled study population could affect the results. However, there was no significant difference between infants with and without data on neurodevelopment with respect to maternal age, paternal age, income status, PWI score and CES-D score. Fourth, our cohort was limited to singletons so the observed results cannot be generalized to multiples. Fifth, 6 months of age may be too early to estimate infant neurodevelopment; hence, to confirm our observation of an independent association between prenatal stress and cognitive development, further studies with longer follow up durations are needed.
In conclusion, we report an inverse association between prenatal maternal stress and depressive symptoms during pregnancy and cognitive development in 6-month-old infants after adjustment for prenatal lead exposure, which is known to negatively affect cognitive development. Childhood developmental problems might be reduced by specific stress reduction interventions in high-stress or depressive pregnant women, although much more research on pathophysiology and interventions is needed (1).

Notes

DISCLOSURE The authors have no potential conflicts of interest to disclosure.

AUTHOR CONTRIBUTION Drafting manuscript of the study and data analysis: Bhang S. Design and concept of the study: Ha E, Hong YC, Ha M, Park H, Kim BN, Jeong KS. Acquisition of data: Lee B, Lee SJ, Lee KY, Kim JH, Ha E, Ha M, Park H, Jeong J. Design and revising manuscript: Kim Y. Manuscript approval: all authors.

References

1. Beydoun H, Saftlas AF. Physical and mental health outcomes of prenatal maternal stress in human and animal studies: a review of recent evidence. Paediatr Perinat Epidemiol. 2008; 22:438–466.
2. Talge NM, Neal C, Glover V. Early Stress, Translational Research and Prevention Science Network: Fetal and Neonatal Experience on Child and Adolescent Mental Health. Antenatal maternal stress and long-term effects on child neurodevelopment: how and why? J Child Psychol Psychiatry. 2007; 48:245–261.
3. Huizink AC, Robles de Medina PG, Mulder EJ, Visser GH, Buitelaar JK. Stress during pregnancy is associated with developmental outcome in infancy. J Child Psychol Psychiatry. 2003; 44:810–818.
4. Sandman CA, Davis EP, Buss C, Glynn LM. Exposure to prenatal psychobiological stress exerts programming influences on the mother and her fetus. Neuroendocrinology. 2012; 95:8–21.
5. DiPietro JA, Novak MF, Costigan KA, Atella LD, Reusing SP. Maternal psychological distress during pregnancy in relation to child development at age two. Child Dev. 2006; 77:573–587.
6. Gutteling BM, de Weerth C, Buitelaar JK. Maternal prenatal stress and 4-6 year old children's salivary cortisol concentrations pre- and post-vaccination. Stress. 2004; 7:257–260.
7. Li Q, Zhang M, Chen YJ, Wang YJ, Huang F, Liu J. Oxidative damage and HSP70 expression in masseter muscle induced by psychological stress in rats. Physiol Behav. 2011; 104:365–372.
8. Kim YJ, Hong YC, Lee KH, Park HJ, Park EA, Moon HS, Ha EH. Oxidative stress in pregnant women and birth weight reduction. Reprod Toxicol. 2005; 19:487–492.
9. Luo ZC, Fraser WD, Julien P, Deal CL, Audibert F, Smith GN, Xiong X, Walker M. Tracing the origins of “fetal origins” of adult diseases: programming by oxidative stress? Med Hypotheses. 2006; 66:38–44.
10. Suh YJ, Kim YJ, Park H, Park EA, Ha EH. Oxidative stress-related gene interactions with preterm delivery in Korean women. Am J Obstet Gynecol. 2008; 198:541.e1–541.e7.
11. Jordan W, Cohrs S, Degner D, Meier A, Rodenbeck A, Mayer G, Pilz J, Rüther E, Kornhuber J, Bleich S. Evaluation of oxidative stress measurements in obstructive sleep apnea syndrome. J Neural Transm (Vienna). 2006; 113:239–254.
12. Ceylan M, Sener S, Bayraktar AC, Kavutcu M. Oxidative imbalance in child and adolescent patients with attention-deficit/hyperactivity disorder. Prog Neuropsychopharmacol Biol Psychiatry. 2010; 34:1491–1494.
13. Lidsky TI, Schneider JS. Lead neurotoxicity in children: basic mechanisms and clinical correlates. Brain. 2003; 126:5–19.
14. Cao Y, Chen A, Radcliffe J, Dietrich KN, Jones RL, Caldwell K, Rogan WJ. Postnatal cadmium exposure, neurodevelopment, and blood pressure in children at 2, 5, and 7 years of age. Environ Health Perspect. 2009; 117:1580–1586.
15. Stewart PW, Reihman J, Lonky EI, Darvill TJ, Pagano J. Cognitive development in preschool children prenatally exposed to PCBs and MeHg. Neurotoxicol Teratol. 2003; 25:11–22.
16. Kim BM, Ha M, Park HS, Lee BE, Kim YJ, Hong YC, Kim Y, Chang N, Roh YM, Kim BN, et al. The mothers and children's environmental health (MOCEH) study. Eur J Epidemiol. 2009; 24:573–583.
17. Bayley N. Psychological Corporation. Bayley Scales of Infant Development. 2nd ed. New York, NY: Psychological Corp.;1993.
18. Squires JK, Potter L, Bricker DD. The ASQ User's Guide. Baltimore, MD: Paul H. Brookes;1995.
19. Hong JW, Kim DH, Park WS, Seo I, Chang SJ, Kim JY, Kim DI, Ahn YO, Kim JS, Moon OR, et al. Standardization of Collection and Measurement of Health Statistics Data. Seoul: The Korean Society for Preventive Medicine;2000.
20. Kohout FJ, Berkman LF, Evans DA, Cornoni-Huntley J. Two shorter forms of the CES-D (Center for Epidemiological Studies Depression) depression symptoms index. J Aging Health. 1993; 5:179–193.
21. Cho MJ, Kim KH. Diagnostic validity of the CES-D (Korean version) in the assessment of DSM-III-R major depression. J Korean Neuropsychiatr Assoc. 1993; 32:381–391.
22. Orr ST, James SA, Blackmore Prince C. Maternal prenatal depressive symptoms and spontaneous preterm births among African-American women in Baltimore, Maryland. Am J Epidemiol. 2002; 156:797–802.
23. Glass DC, Gray CN. Estimating mean exposures from censored data: exposure to benzene in the Australian petroleum industry. Ann Occup Hyg. 2001; 45:275–282.
24. Kim Y, Ha EH, Kim EJ, Park H, Ha M, Kim JH, Hong YC, Chang N, Kim BN. Prenatal exposure to phthalates and infant development at 6 months: prospective Mothers and Children's Environmental Health (MOCEH) study. Environ Health Perspect. 2011; 119:1495–1500.
25. O'Connor TG, Heron J, Golding J, Glover V; ALSPAC Study Team. Maternal antenatal anxiety and behavioural/emotional problems in children: a test of a programming hypothesis. J Child Psychol Psychiatry. 2003; 44:1025–1036.
26. Van den Bergh BR, Marcoen A. High antenatal maternal anxiety is related to ADHD symptoms, externalizing problems, and anxiety in 8- and 9-year-olds. Child Dev. 2004; 75:1085–1097.
27. Glover V, O'Connor TG, Heron J, Golding J. ALSPAC Study team. Antenatal maternal anxiety is linked with atypical handedness in the child. Early Hum Dev. 2004; 79:107–118.
28. Gutteling BM, de Weerth C, Zandbelt N, Mulder EJ, Visser GH, Buitelaar JK. Does maternal prenatal stress adversely affect the child's learning and memory at age six? J Abnorm Child Psychol. 2006; 34:789–798.
29. Davis EP, Sandman CA. The timing of prenatal exposure to maternal cortisol and psychosocial stress is associated with human infant cognitive development. Child Dev. 2010; 81:131–148.
30. Keim SA, Daniels JL, Dole N, Herring AH, Siega-Riz AM, Scheidt PC. A prospective study of maternal anxiety, perceived stress, and depressive symptoms in relation to infant cognitive development. Early Hum Dev. 2011; 87:373–380.
31. Buss C, Davis EP, Muftuler LT, Head K, Sandman CA. High pregnancy anxiety during mid-gestation is associated with decreased gray matter density in 6-9-year-old children. Psychoneuroendocrinology. 2010; 35:141–153.
32. Fortin MC, Cory-Slechta DA, Ohman-Strickland P, Nwankwo C, Yanger TS, Todd AC, Moynihan J, Walton J, Brooks A, Fiedler N. Increased lead biomarker levels are associated with changes in hormonal response to stress in occupationally exposed male participants. Environ Health Perspect. 2012; 120:278–283.
33. Streimish IG, Ehrenkranz RA, Allred EN, O'Shea TM, Kuban KC, Paneth N, Leviton A; ELGAN Study Investigators. Birth weight- and fetal weight-growth restriction: impact on neurodevelopment. Early Hum Dev. 2012; 88:765–771.
34. Levine TA, Grunau RE, McAuliffe FM, Pinnamaneni R, Foran A, Alderdice FA. Early childhood neurodevelopment after intrauterine growth restriction: a systematic review. Pediatrics. 2015; 135:126–141.
TOOLS
ORCID iDs

Soo-young Bhang
https://orcid.org/http://orcid.org/0000-0001-5254-0314

Eunhee Ha
https://orcid.org/http://orcid.org/0000-0002-4224-3858

Hyesook Park
https://orcid.org/http://orcid.org/0000-0002-9359-6522

Mina Ha
https://orcid.org/http://orcid.org/0000-0003-1011-9446

Yun-Chul Hong
https://orcid.org/http://orcid.org/0000-0001-9010-7271

Boong-Nyun Kim
https://orcid.org/http://orcid.org/0000-0002-2403-3291

Soo-Jeong Lee
https://orcid.org/http://orcid.org/0000-0001-9272-6770

Kyung Yeon Lee
https://orcid.org/http://orcid.org/0000-0001-6821-1056

Ja Hyeong Kim
https://orcid.org/http://orcid.org/0000-0003-0691-1924

Joseph Jeong
https://orcid.org/http://orcid.org/0000-0002-1407-9376

Kyoung Sook Jeong
https://orcid.org/http://orcid.org/0000-0002-6897-8289

Boeun Lee
https://orcid.org/http://orcid.org/0000-0002-9032-9656

Yangho Kim
https://orcid.org/http://orcid.org/0000-0002-6462-0829

Similar articles