

 PDF
PDF ePub
ePub Citation
 Print
Print


INTRODUCTION
Death from cardiac disease, including coronary heart disease (CHD), is one of the leading causes of death in Korea (1). As obesity is an independent risk factor for CHD, reducing the obese population can reduce death from cardiac disease. Unfortunately, the proportion of obese people is increasing due to westernized food intake and a sedentary life style. The Korean National Health and Nutrition Examination Survey (KNHANES) reported that the proportion of obese individuals was 26.7% in 1998, while it was 30.9% in 2007 to 2009 (2). Furthermore, the socio-economic burden related to obesity is substantial in Korea. Total medical cost of obesity-related disease was estimated to be about 1,871 billion KRW, and the direct medical cost of obesity was estimated to be about 612 billion KRW in 2003 (3). The health and economic impacts of obesity have made it critical to correctly diagnose and manage obesity. The World Health Organization (WHO) developed a classification system for obesity in 1997 based on body mass index (BMI) (4). Because this classification does not consider racial differences, there are limitations when applying it to Asian individuals. In 2000, the WHO Western Pacific Regional Office therefore suggested a revised obesity classification that considers racial differences. In Korea, the revised classification is currently used to classify obesity according to BMI (5). The International Diabetes Federation (IDF) suggested a classification for waist circumference to deal with central obesity. The Korean Society for the Study of Obesity suggested an upper waist circumference of 90 cm for men and 85 cm for women in Korea (67).
The increasing proportion of obese people and the improvement in nutritional status worldwide has made it important to re-classify anthropometric indices. Several studies have investigated optimal cutoff points of anthropometric indices (89). In Korea, some previous studies also investigated anthropometric cutoff points. These cutoff points were estimated based on various disease risk predictions analyses that included components of metabolic syndrome, risk of hypertension, and so on (710). However, because the population in each study and the methodologies were different, the estimated cutoff points were not consistent between those studies.
To the best of our knowledge, no published study has estimated anthropometric optimal cutoff points using the Framingham coronary heart disease risk score in Korea. In this study, we therefore estimated optimal cutoff points for anthropometric indices to predict high CHD risk groups as categorized by the Framingham coronary heart disease risk score.
MATERIALS AND METHODS
Data source and study population
KNHANES is a nationwide annual survey of the representatively sampled non-institutionalized population of Korea. It is composed of two main surveys: a health inspection survey and a nutritional inspection survey. We used the 2007 to 2010 KNHANES data.
A total of 33,829 people were included during the study period. To estimate the optimal cutoff points for BMI, waist circumference, and waist-to-height ratio in adults, we excluded 8,954 people under the age of 20 yr. Because estimates of optimal anthropometric indices in elderly require a different treatment due to the 'obesity paradox', we excluded 720 people aged 80 yr or older (11). To discriminate high CHD risk groups, we used the Framingham coronary heart disease risk score. We excluded individuals if at least one of the following factors was missing: total cholesterol, HDL, systolic BP, or responses to questions about whether they were taking medication for hypertension or not or if they were current smokers. We also excluded individuals if height, weight, or waist circumference was missing. In addition, we excluded pregnant women. Finally, 21,399 people were included in this study.
Definitions
Framingham coronary heart disease risk score calculator was constructed based on data from a cohort study of American middle-class white people. This risk score predicts 10-yr coronary heart disease risk using certain risk factors. To calculate the Framingham coronary heart disease risk score, we used age, sex, total cholesterol, HDL cholesterol, systolic BP, and responses to questions about antihypertensive medication use and current smoking. We calculated the risk score using the equation from the Adult Treatment Panel III (ATP III). We assigned an individual to the high CHD risk group if they had a calculated Framingham coronary heart disease risk score of 20% of more. Because we used the ATP III, we included individuals with coronary heart disease equivalent to the high-risk group. Subjects who were previously diagnosed with diabetes or who had a fasting blood sugar (FBS) level of 126 mg/dL or more were considered to have diabetes and were included in the high-risk group. Furthermore, those individuals previously diagnosed with myocardial infarction or ischemic heart disease were included in the high-risk group (1213). Those taking hypertension medication, a systolic BP of 140 mmHg or more, or a diastolic BP of 90 mmHg or more were considered to have hypertension.
Statistical analysis
We calculated receiver operating characteristic (ROC) curves for BMI, waist circumference, and waist-to-height ratio according to the Framingham coronary heart disease risk score. Initially, we obtained ROC curves to predict a risk score of 20% or more. Then, we stratified age by 10 yr to estimate age group-specific optimal anthropometric cutoff points. We used the Youden index to estimate optimal cutoff points for BMI, waist circumference, and waist-to-height ratio (14). We also performed sensitivity analysis using ROC curves to predict risk scores of 10% or more.
All statistical analyses were conducted using STATA software version 12.0 (StataCorp., Texas, USA). P values less than 0.05 were considered statistically significant.
RESULTS
Baseline characteristics of the study population
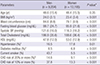
Among the 21,399 individuals comprising the study population, 9,204 were men and 12,195 were women. Mean age was 48.6 yr for men and 48.4 yr for women. Anthropometric indices, systolic BP, FBS, total cholesterol, proportion of hypertension, diabetes, and current smokers differed significantly between men and women. The proportion of men with a CHD risk of 20% or more was significantly higher than the proportion of women (14.6% vs. 9.1%, P<0.001) (Table 1). Detailed distributions of the anthropometric indices and CHD risk are presented as supplementary tables (Supplementary Tables 1 and 2).
Optimal cutoff points for each anthropometric index
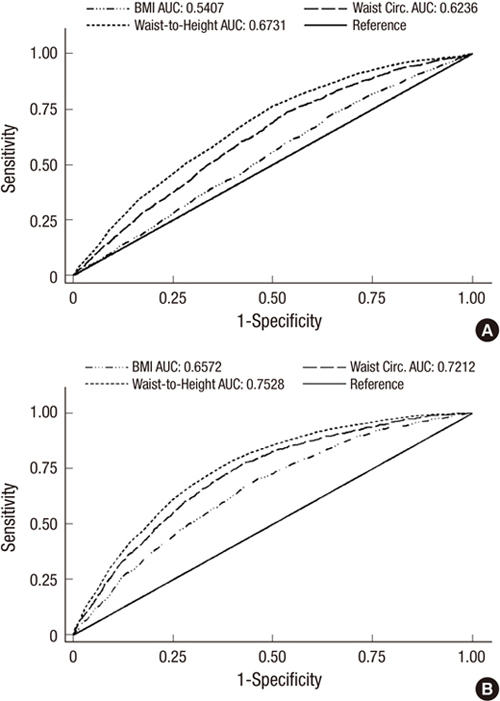
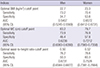
The estimated optimal cutoff points to predict men in the CHD high-risk group (estimated 10 yr CHD risk of 20% or more) were a BMI of 22.7 kg/m2 (sensitivity 73.2%, specificity 34.7%), waist circumference of 83.2 cm (sensitivity 73.9%, specificity 46.4%), and waist-to-height ratio of 0.50 (sensitivity 76.2%, specificity 50.3%). In women, estimated optimal cutoff points were a BMI of 23.3 kg/m2 (sensitivity 70.4%, specificity 53.8%), waist circumference of 79.7 cm (sensitivity 76.9%, specificity 57.8%), and waist-to-height ratio of 0.52 (sensitivity 78.6%, specificity 60.3%) (Table 2).
When we compared the predictability of each anthropometric index using the area under the curve (AUC), each anthropometric index was more predictable for CHD high risk in women than in men. Furthermore, waist-to-height ratio was the most predictable index and BMI was the least predictable index (AUC for BMI, 0.5407 for men; 0.6572 for women; AUC for waist circumference, 0.6236 for men; 0.7212 for women; AUC for waist-to-height ratio, 0.6731 for men; 0.7528 for women) (Fig. 1).
In sensitivity analysis, the estimated optimal cutoff points to predict a CHD risk of 10% or more were exactly the same as those reported for a CHD risk of 20% except for BMI in women (Supplementary Table 3).
Age group-specific cutoff points
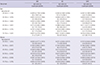
In men, the optimal cutoff point for BMI was lowest for men in their 20s (20.4 kg/m2) and highest for those in their 40s (24.4 kg/m2). The AUC was lowest for men in their 20s (0.3978) and highest for those in their 30s (0.6972). In women, the optimal cutoff point for BMI was lowest for those in their 20s (19.9 kg/m2) and highest for those in their 50s (26.2 kg/m2). AUC was lowest for those in their 60s (0.5501) and highest for those in their 30s (0.7633) (Table 3).
The optimal cutoff point for waist circumference was lowest for men in their 30s (82.2 cm) and highest for men in their 20s (101.9 cm). AUC was lowest for men in their 20s (0.4304) and highest for those in their 30s (0.6506). The optimal cutoff point for waist circumference was lowest in women in their 20s (71.0 cm) and highest for those in their 60s (85.6 cm). The AUC was lowest for women in their 60s (0.5934) and highest for those in their 30s (0.7404) (Table 3).
In men, the optimal cutoff point for waist-to-height ratio was lowest for those in their 30s (0.47) and highest for those in their 20s (0.63). The AUC was lowest for men in their 20s (0.4447) and highest for men in their 30s (0.6839). In women, the optimal cutoff waist-to-height ratio was lowest for those in their 20s (0.45) and highest for those in their 70s (0.56). The AUC was lowest for women in their 60s (0.5908) and highest for those in their 30s (0.7460) (Table 3).
DISCUSSION
In this study, we estimated the optimal cutoff points for BMI, waist circumference, and waist-to-height ratio in Korean men and women that predicted a high risk of CHD. To our knowledge, this is the first study to estimate anthropometric optimal cutoff points using the Framingham coronary heart disease risk score in Korea. Because we used CHD risk, not CHD events, the results from this study indicate the healthy upper limits of anthropometric indices to keep the risk for CHD low. In addition, few previous studies have estimated age-group specific cutoff points for several anthropometric indices. Further strengths of this study include the large sample size and representative samples from KNHANES. Additionally, the consistent results obtained from the sensitivity analyses emphasize the reliability and validity of this study.
After a classification system that considered racial differences in obesity was first suggested in 2000, several studies have redefined optimal cutoff points of anthropometric indices. These studies have continuously recommended that a lower cutoff point be applied to the Asian population (1516). In this study, our estimated optimal cutoff points for BMI were around the current lower limit for overweight (23 kg/m2). Similar to other studies that estimated optimal cutoff points of various anthropometric indices, the AUC for BMI to predict individuals at high risk of CHD was the lowest among the anthropometric indices; BMI appears to reflect central obesity less exactly than other anthropometric indices (78910).
The estimated optimal cutoff point for waist circumference was much lower than the current limit (men under 90 cm, women under 85 cm). The current criterion for central obesity in Korea may therefore be inappropriate for CHD risk prediction and the lower limits for waist circumference reported in this study should be considered (101718).
Estimated cutoff points for BMI and waist circumference were relatively lower than the current cutoff values in both men and women, but this was more pronounced in men. Because baseline BMI and waist circumference were different among men and women, we expected that the changes in optimal cutoff points for BMI and waist circumference might be different between men and women. Furthermore, there were significant differences in baseline characteristics between men and women. Those factors could account for the gender differences in the changes in these cutoff points.
The optimal cutoff point for the waist-to-height ratio was 0.50 in men and 0.52 in women. These results are consistent with those reported in previous studies conducted in Korea. Considering the higher predictability of waist-to-height ratio for CHD risk than other anthropometric indices reported in this study and previous studies, we argue that clinical application of waist-to-height ratio as an index for central obesity is warranted (101719).
Large sample size enabled us to estimate age-group specific cutoff points. However, the AUCs for three anthropometric indices were under 0.5 in men aged 20-29 yr. The prevalence of CHD high risk in this age group of men was relatively lower than in the other age groups (n=7, 0.6%). This could account for the unexpected negative correlation with CHD high-risk prediction in this age group. Moreover, because this young age group is generally considered to have an extremely low CHD risk, the design of our study, using CHD risk, may be inappropriate for this age group. Estimated predictability using AUC was highest for men and women in their 30s and the estimated optimal cutoff points were different among age groups. Further efforts to determine age group-specific optimal anthropometric cutoff points are needed. Furthermore, age, frailty, comorbidities, and other CHD risk factors should be taken into account when suggesting optimal cutoff points to individual patients (1120212223).
Our study had several limitations. First, the Framingham coronary heart disease risk score was obtained from a cohort study of western white people. Application of this score in Asians could therefore be inappropriate (24). However, other studies in Korea that studied CHD also used the Framingham coronary heart disease risk score (2526). Furthermore, the applicability of the Framingham coronary heart disease risk score to various races has already been proven (2728). A recent study further supports the validity of use of the Framingham coronary heart disease risk score in the Korean population. Park et al. analyzed 6,311 individuals drawn from the general population in Korea. They compared CHD risk groups based on coronary computed tomographic angiography to risk groups based on calculated Framingham coronary heart disease risk score. Participants with moderate to high CHD risk based on the Framingham coronary heart disease risk score had a significantly higher risk of CHD estimated from coronary computed tomographic angiography (29). Because we used the Framingham coronary heart disease risk score as a tool for CHD risk stratification, not for absolute risk calculation, we believe that it is unlikely that use of the Framingham coronary heart disease risk score significantly biased our results. Furthermore, we performed sensitivity analysis to confirm the validity of CHD risk group stratification using the Framingham coronary heart disease risk score. The results from the sensitivity analysis were the same as our main results, except for BMI in women. These results demonstrate the reliability of the CHD risk group stratification method used in our study.
Second, some variables in the KNHANES data may be incorrect. Questions about smoking, diabetes and hypertension medications, and previous history of cardiac disease are dependent on the respondents' memories. There could be recall bias, and this bias is likely to be more pronounced in the elderly. Because we excluded elderly people (80 yr or more), we expect that the effect of recall bias was relatively low.
Finally, to estimate optimal cutoff points for anthropometric indices, not only CHD risk but also various disease morbidities and mortalities should be considered. Although our results were in agreement with those of previous studies and consistent results were obtained from sensitivity analyses, numerous factors related to obesity should be considered when determining optimal cutoff points. Recently, a large population-based prospective cohort study in Korea estimated the optimal cutoff points of anthropometric indices to predict hypertension. The estimated cutoff points for waist circumference (83.3 cm in men and 80.4 cm in women) and waist-hip-ratio (0.49 in men and 0.51 in women) are consistent with our findings (10). Because hypertension is also an important risk factor for CHD, the similarity in results indicates that possible bias due to not considering multiple risk factors was minimal.
In conclusion, we estimated optimal cutoff points for BMI, waist circumference, and waist-to-height ratio to predict Korean adults at high risk for CHD. Our results provide healthy upper limits of anthropometric indices to keep the risk for CHD low and support the re-classification of anthropometric indices and clinical use of waist-to-height ratio as a measure of obesity.
 XML Download