

 PDF
PDF ePub
ePub Citation
 Print
Print


INTRODUCTION
Angiotensin II (Ang II) directly constricts vascular smooth muscle cells, stimulates aldosterone production, activates the sympathetic nervous system, and increases sodium reabsorption, therefore, contributes to the development of hypertension (12). Aside from its hypertensinogenic effect, locally produced Ang II in the kidney activates multiple intracellular signaling pathways and induces cell proliferation and tissue remodeling by enhancing the synthesis of profibrotic cytokines and chemokines (34). These effects of Ang II are mediated through Ang II type 1 receptor (AT1R) activation and play an important role in the development of renal injury.
Experimental and clinical evidences suggest that a combination of glomerular capillary hypertension, profibrotic effects, and proteinuria contribute to kidney injury associated with the overexpression of the renin-angiotensin-aldosterone system (RAS). The RAS developed hypertension and proteinuria in diabetic and nondiabetic nephropathies through a narrowing of the slit diaphragm (SD) and the suppression of nephrin and podocin expression (5678). Therefore, Ang II may induce dysfunction of glomerular podocytes, which play a crucial role in establishing glomerular filtration barrier permselectivity, thereafter, proteinuria.
The AMP-activated protein kinase (AMPK) is a sensor of cellular energy status and plays a key role in the regulation of energy homeostasis (91011). AMPK is expressed in essentially all eukaryotic cells from yeast to plants and animals. In mammals, AMPK is activated by an elevated AMP/ATP or ADP/ATP ratios due to cellular and environmental stress, such as heat shock, hypoxia, and ischemia (91011). In podocytes, the increased activity of AMPK by adiponectin treatment in cultured podocytes reduced podocyte permeability to albumin and podocyte dysfunction (12). The activity of AMPK has been closely related to oxidative stress in podocyte injury models, such as, diabetic and adriamycin-induced oxidative podocyte injury (121314). Recently, we have found that Ang II suppressed podocyte AMPK via AT1R and MAPK signaling pathway (15).
p130Cas was initially discovered as a 130 kDa protein which is highly tyrosine phosphorylated in cells expressing p47 v-Crk (C10 regulator of kinase) and p60 v-Src (for sarcoma) oncoproteins (161718). p130Cas lacks a kinase domain, but contains various protein–protein interaction domains which mediate associations with a number of binding partners (161718). In podocytes, p130Cas localizes diffusely to the cytoplasm with accumulation at ends of F-actin stress fibers in foot processes, where focal adhesion proteins and kinases (FAKs) connect docking proteins, including integrin and p130Cas to the glomerular basement membrane (GBM) at basal aspect, and CD2AP and p130Cas to the slit diaphragm (SD) insertion site between foot processes (1920). Therefore, p130Cas protein plays an important role in maintaining the glomerular permeability by connecting podocyte actin cytoskeleton to GBM and SD, however, in pathologic conditions, the disturbed interaction of p130Cas with other adjacent proteins could induce podocyte hyperpermeability. In the present study, we investigated the roles of AMPK on the changes of podocyte p130Cas by Ang II.
MATERIALS AND METHODS
Cell culture of mouse podocytes
Conditionally immortalized mouse podocytes were kindly provided by Dr. Peter Mundel (Harvard University, Boston, MA, USA) and were cultured and differentiated as described previously (21). Briefly, to stimulate podocyte proliferation, cells were cultivated at 33°C (permissive conditions) in a culture medium supplemented with 10 U/mL mouse recombinant γ-interferon (Roche, Mannheim, Germany) to induce expression of temperature-sensitive large T antigen. To induce differentiation, podocytes were maintained at 37°C without γ-interferon (non-permissive conditions) for at least 2 weeks.
Treatment conditions
For Ang II treatment, cells were incubated with various concentrations of Ang II (Sigma-Aldrich Inc., ST. Louis, MO, USA) for the indicated time periods (6 to 48 hours). For Ang II inhibition, losartan (Merck, MSD LTD., Seoul, Korea) was used in a concentration of 10-6 M for 24 hours. For AMPK activation, 5-aminoimidazole-4-carboxamide-1β-riboside (AICAR; Merck KGaA, Darmstadt, Germany) and metformin (Daewoong Pharmaceutical Co., Seoul, Korea) were treated in concentrations of 0.5 mM and 2 mM for 24 hours, respectively. For AMPK inhibition, compound C (Merck KGaA) was added to media in a concentration of 5 μM.
Immunofluorescence staining
Podocytes that were grown on type I collagen-coated glass cover slips incubated for 24 hours were fixed in 4% paraformaldehyde, permeabilized in phosphate buffer solution, blocked with 10% normal goat serum, and labeled with polyclonal rabbit anti-rat p130Cas antibody (Santa Cruz Biotechnology, Santa Cruz, CA, USA) or polyclonal anti-rat FAK antibody (Santa Cruz Biotechnology). Primary antibody-bound specimens were incubated with 1:500 (v/v) Alexa 488 for green and Alexa 594 for red (Invitrogen, Eugene, OR, USA)-conjugated respective secondary antibodies at room temperature for 1 hour. F-actin was visualized with TRITC-phalloidin (Sigma Chemical Co., Saint Louis, MO, USA) and nuclei were stained with 2 mM 4, 6-diamidino-2-phenylindole dihydrochloride (DAPI, Sigma Chemical). Coverslips were mounted in aqueous mountant and viewed with a Fluorescence microscope (BX51, OLYMPUS, Tokyo, Japan).
Immunoblotting analysis for p130Cas
The confluently grown cell layers were incubated with additives for various durations and extracted in protein extraction solution (PRO-PREP, Intron, Seongnam, Korea) containing phenylmethylsulfonyl fluoride (PMSF), ethylendiamine tetraacetic acid (EDTA), pepstatin A, leupeptin, and aprotinin, then, protein concentrations were determined as previously described (15). For immunoblotting assay, 25 μg of boiled extracts was applied on 10% SDS-PAGE gels and transferred to polyvinylidene fluoride membranes (Bio-Rad Laboratories, Hercules, CA, USA). Thereafter, the membranes were air-dried and blocked in 3% fat-free milk before incubation with anti- p130Cas antibody. As a loading control, anti-β-tubulin antibody (Santa Cruz Biotechnology) was also used. After incubation with horseradish peroxidase–conjugated secondary antibodies (Santa Cruz Biotechnology), bands were detected by using the ECL chemiluminescence system (Amersham Biotech Ltd., Bucks, UK). Density values were expressed as % of control (without Ang II).
RESULTS
Ang II relocates p130Cas in podocytes
p130Cas stainings were localized in the cytoplasm of cultured podocytes diffusely, whereas, F-actin fibers were distributed in peripheral cytoplasm and run over nucleus, apart from p130Cas. High doses (10-7 M and 10-6 M) of Ang II decreased and relocalized the immunofluorescent intensities of p130Cas in internal cytoplasm and peri- and intra-nuclear areas of podocytes with concentrations. Such changes by Ang II were associated with disrupted F-actin fibers in a dose-dependent manner (Fig. 1A).
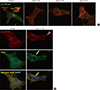 | Fig. 1Effects of Ang II on the localization of p130Cas in podocytes. p130Cas stainings are located in the cytoplasm of cultured podocytes diffusely, whereas, F-actin fibers are distributed in peripheral cytoplasm and run over nucleus, apart from p130Cas. (A) Ang II reduces and re-localizes the immunofluorescent intensities of p130Cas in internal cytoplasm and peri- and intra-nuclear areas of podocytes with concentrations. Such changes by Ang II are associated with disrupted F-actin fibers. (B) Ang II (10-6 M) also decreases and concentrates the immunofluorescent intensities of FAK (arrow) in internal cytoplasm and peri-nuclear areas of podocytes, which become to be separated partially from p130Cas (arrow head). Magnification, × 1,000.
|
Previously, we found that p130Cas protein was co-localized with FAK (20), which also demonstrated in left column of Fig. 1B. Ang II (10-6 M) also decreased and concentrated the immunofluorescent intensities of FAK in internal cytoplasm and peri-nuclear areas of podocytes, which became to be separated partially from p130Cas (Fig. 1B, right column).
Ang II reduces the amount of p130Cas protein
In immunoblotting study, the bands for p130Cas protein at 130 kDa were compared to those of β-tubulin. Ang II reduced p130Cas protein in time and dose-sensitive manners. 10-7 M Ang II tended to reduce p130Cas from 12 hours through 24 hours (Fig. 2A). A potent AMPK inhibitor, compound C decreased p130Cas protein additively and even at earlier incubation times. Next, we focused our experiments at 24 hours incubation thereafter. Concerning the incubation period for 24 hours, the density values for p130Cas protein in podocytes were decreased by 11.1% (P = 0.039) and 22.9% (P = 0.007) significantly at doses of 10-7 M and 10-6 M Ang II, respectively, compared to control (without Ang II) after correcting for β-tubulin levels (n = 3, Fig. 2B).
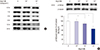 | Fig. 2Effects of Ang II on the p130Cas protein assayed by Western blotting. (A) The bands for p130Cas protein at 130 kDa are reduced by 10-7 M Ang II in a time-dependent manner. Such changes are further aggravated by compound C, a potent AMPK inhibitor. (B) At 24 hours, the density values for p130Cas decreased significantly at doses of 10-7 M and 10-6 M Ang II, respectively, compared to control (without Ang II) after correcting for β-tubulin levels. Data on the densitometric analysis of p130Cas/β-tubulin ratio are expressed as mean ± SD (n = 3). Control (100%); the value of no Ang II conditions. *P < 0.05 and †
P < 0.01 vs. control.
|
AICAR and metformin recover the changes of p130Cas induced by Ang II
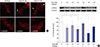
To further assess the involvement of AMPK modulating agents in the regulation of p130Cas protein, we incubated cells with applied AMPK activators, AICAR and metformin, at concentrations of 0.5 mM and 2 mM, respectively, and various concentrations of Ang II. AMPK activators, metformin and AICAR, restored the mal-localized p130Cas significantly, whereas, compound C, an AMPK inhibitor, further aggravated the distributional changes of p130Cas (Fig. 3A). AICAR also recovered the mal-localized both p130Cas and FAK induced by Ang II as shown in Fig. 3B.
 | Fig. 3Effects of AMPK activators on the distributional changes of p130Cas induced by Ang II. (A) AMPK activators, metformin and AICAR, restore the mal-localized p130Cas, whereas, AMPK inhibitor, compound C further aggravates the distributional changes of p130Cas (arrowheads). (B) AICAR also restores the mal-localized p130Cas (arrowheads) and FAK (arrows) induced by Ang II. Magnification, × 1,000.
|
At 24 hours, 10-7 M and 10-6 M Ang II suppressed p130Cas protein significantly compared to control (without Ang II) similar to the results shown in Fig. 2B, which was completely recovered by AICAR and metformin (n = 3, Fig. 4A). Compound C further aggravated the changes of p130Cas as Fig. 2A. Concerning the concentration of 10-7 M Ang II at 24 hours, Ang II suppressed p130Cas protein significantly by 27.1% (P = 0.011), which was reversed by AICAR and metformin (P = 0.044 and P = 0.042, respectively, n = 3, Fig. 4B). Compound C further aggravated the changes of p130Cas by 64.5% (P < 0.001) as Fig. 2A.
 | Fig. 4Effects of AMPK activators on the changes of p130Cas protein induced by Ang II. Ang II suppresses p130Cas protein significantly in a time-dependent manner. (A) Compound C further exaggerates the reduced p130Cas protein significantly (all P < 0.01, not denoted) at all experiment times. (B) Concerning the concentration of 10-7 M Ang II at 24 hours, Ang II suppresses p130Cas protein significantly, which is also reversed by AICAR and metformin. Compound C further aggravates the changes of p130Cas. Data on the densitometric analysis of p130Cas/β-tubulin ratio are expressed as mean ± SD (n = 3). Control (100%); the value of no Ang II conditions.
*P < 0.05 and †
P < 0.01 vs. control. ‡
P < 0.05 and §
P < 0.01 vs. Ang II-treated groups.
|
The changes of p130Cas induced by Ang II are mediated via AT1R
Losartan, an AT1R antagonist, ameliorated the mal-localized p130Cas induced by 10-7 M and 10-6 M Ang II (Fig. 5A). Losartan also recovered the amounts of p130Cas suppressed by 10-7 M and 10-6 M Ang II significantly (P = 0.043 and P = 0.039, respectively, n = 3, Fig. 5B). Therefore, the suppression of p130Cas induced by Ang II might be mainly mediated via AT1R.
 | Fig. 5Suppression of p130Cas by Ang II via AT1R. AT1R antagonist, losartan, ameliorates the mal-localized p130Cas (arrowheads, A) and reverses the suppression of p130Cas induced by high doses (10-7 M and 10-6 M) of Ang II (B). Data on the densitometric analysis of p130Cas/β-tubulin ratio are expressed as mean ± SD (n = 3). Control (100%); the value of no Ang II conditions.
*P < 0.05 and †
P < 0.01 vs. control. ‡
P < 0.05 vs. Ang II-treated groups.
|
DISCUSSION
p130Cas serves as a ubiquitous docking adapter protein because it contains proline-rich domains, an SH3 domain, and binding motifs for the SH2 domains of v-Crk and v-Src and seems to be involved in integrin-mediated signaling and cell adhesion to extracellular matrix by tyrosine phosphorylation. On the other cytoplasmic side, p130Cas is connected to FAK and c-Crk, mediating signaling pathways from cell adhesion sites to the inner cytoskeleton (16171822). Activation or overexpression of Cas proteins activates multiple downstream effectors to promote formation of filopodia, lamellipodia, pseudopodia, and induce additional changes in the cytoskeleton that support migration (16171823). Therefore, p130Cas protein plays a pivotal role in cell adhesion/migration/invasion/transformation, pro-survival, and cellular signaling by connecting extracellular structure and cytoskeleton. Recent studies show that p130Cas has been reported to be involved in the development and progression of several human cancers, and increased expression of p130Cas has been found to correlate to more advanced stages of disease in breast, prostate, ovarian, and hepatocellular cancers (16).
In podocytes, p130Cas is located in the foot processes of podocytes in glomeruli, along with CD2AP and F-actin, where FAKs connect docking proteins including integrin and p130Cas to the GBM, and CD2AP and p130Cas to the SD insertion site (1920). Therefore, these findings indicate a critical role for p130Cas in podocyte physiology and the normal functioning, such as, cell adhesion and motility, pro-survival, and cellular signaling.
The glomerular proteinuria is usually related to structural and functional alterations in the glomerular filtration barrier and often associated with retraction and effacement of the highly specialized interdigitating foot processes of podocytes, which are accompanied by the alterations of the SD and docking adaptor molecules (24). However, there are very limited reports on the change of p130Cas in pathologic conditions till now. In human pathologic diseases, the immunofluorescent stainings of p130Cas increased around the glomerular capillary loop of human membranous nephropathy, however, not of minimal change disease (25). Although both diseases are podocyte diseases, the pathophysiologic mechanisms leading to membranous nephropathy and minimal change disease are different. Membranous nephropathy is caused by an accumulation of immune deposits on the outer aspect of the GBM, however, minimal change disease is characterized by podocyte phenotypical changes caused by plasma permeability factors (26). Therefore, the expression of podocyte p130Cas could be different according to the pathophysiologic mechanisms leading to podocytopathy.
Recently, we reported that the exposure of podocytes to puromycin aminonucleoside (PAN) in vitro relocated p130Cas internally and granularly and reduced p130Cas protein level, which were induced through oxidative effect of PAN (27). As a common podocytopathy, we found the changes of p130Cas protein in in vitro diabetic model, which showed the similar distributional and quantitative changes p130Cas protein as PAN-induced podocyte injury model with the activation of FAKs and tyrosine phosphorylation of focal adhesion proteins (20). And, such changes were ameliorated by ginseng total saponin (28). This study also showed that Ang II induced the distributional and quantitative changes of podocyte p130Cas, leading to disrupt podocyte adhesions to neighbor structures, similar to the results of PAN-induced and diabetic nephropathies. Together, we could suggest that podocyte injury mechanisms induce the distributional and quantitative changes of podocyte p130Cas, then, subsequently disrupt podocyte adhesion to neighbor structures, such as, adaptor proteins, GBM, etc., then, would develop podocyte effacement and proteinuria.
The role of AMPK in podocyte injury has been studied by a few researchers as followings. Sharma et al. (12) have also found that a low serum level of adiponectin in obesity animal model is associated with albuminuria. They also found that adiponectin treatment in cultured podocytes increased activity of AMPK and reduced podocyte permeability to albumin and podocyte dysfunction. Furthermore, adiponectin knockout mice exhibit increased albuminuria and fusion of podocyte foot processes. They assumed that such effects seemed to be caused by reduction of oxidative stress, as both adiponectin and AMPK activation reduced protein levels of the NAD(P)H oxidase 4 (Nox4) in podocytes (12). Similarly, Piwkowska et al. (13) have also shown that metformin decreased oxidative stress through a reduction of NAD(P)H oxidase activity and increased AMPK activity, therefore, AMPK activator could prevent glucose-induced oxidative stress in cultured podocytes. In diabetic models, Eid et al. (29) have also found that high glucose diabetic conditions in vitro and in vivo inactivated AMPK, up-regulated Nox4, enhanced NAD(P)H oxidase activity, and subsequently induced podocyte apoptosis, which were inhibited by AMPK activation. We also found that diabetic conditions suppressed AMPK of podocytes in vitro and in vivo (30). In adriamycin-induced podocyte injury model, AMPK activators also protected podocytes with the suppression of oxidative injury (14). Taken together, the activation of podocyte AMPK might play an important role in the control of oxidative stress and permeability function of podocyte in podocyte injury models.
Recently, we have also found that Ang II suppressed podocyte AMPKα (Thr172) phosphorylation via AT1R and MAPK signaling pathway (15). We found that the distributional and quantitative changes of podocyte p130Cas induced by Ang II were closely related to the suppressed AMPK in this study. In conclusion, we suggest that Ang II induces the distributional and suppressed changes of podocyte adaptor proteins, including p130Cas, leading to disrupt podocyte adhesions between cytoskeleton, other adjacent adaptor proteins, and neighboring GBM, then, may develop proteinuria in Ang II-induced podocyte injury. Therefore, the activation of AMPK signaling might serve as a novel therapeutic target of Ang II-induced podocyte dysfunction.
 XML Download