

 PDF
PDF ePub
ePub Citation
 Print
Print


INTRODUCTION
The prevalence of type 2 diabetes mellitus (T2DM), which often leads to cardiovascular diseases such as cardiac insufficiency, myocardial infarction, and diabetic cardiomyopathy, has been increasing worldwide, especially in Western countries. A recent meta-analysis study found a significant association between T2DM and atrial fibrillation (AF) (1), indicating that T2DM is associated with irregularities in atrial electrophysiology.
Diabetes often causes various electrocardiogram abnormalities, including P-wave prolongation and increased P-wave dispersion (2), which suggests irregularities in atrial depolarization, leading to abnormalities in impulse generation or conduction. The P-wave duration is generally accepted as a noninvasive electrocardiographic indicator of atrial conduction. Previous studies have provided good evidence that prolonged P-wave duration is associated with left atrial enlargement (3,4) and dysfunction (5), as well as subsequent atrial tachyarrhythmias including AF (6,7). Watanabe et al. (8) used optical mapping of diabetic rat hearts to show that atrial conduction velocity was decreased. Yazici et al. (2) found that prolonged P-wave dispersion was independent of ischemia, hypertension and left ventricular hypertrophy in diabetic patients. However, the underlying ionic and molecular mechanisms of prolonged P-wave duration in T2DM remain elusive.
Although the electrophysiological properties of the ventricular myocytes in an earlier diabetic rat model have been investigated (9), information on the electrophysiological alterations of the diabetic atrium remains limited (10). Therefore, the purpose of this study was to investigate the electrophysiological characteristics of the diabetic atrium and the underlying mechanisms of conduction abnormalities in a rat model of DM. In this model, which is a better model of T2DM, DM was induced in male Wistar rats by a high-fat and high-sucrose diet, and intraperitoneal injection of low-dose streptozotocin (11). To our knowledge, this is the first time it has been reported that prolonged P-wave duration in T2DM is a result of abnormal interatrial conduction and not dependent on left atrial size.
MATERIALS AND METHODS
Induction of type 2 diabetes in rats
Eight-week-old male Wistar rats were randomized into 2 groups. The control group (n = 15) was fed the standard diet, and the other group (n = 28) was received a high-fat and high-sucrose diet (10% lard, 20% sucrose, 2.5% cholesterol, 1% bile acid and 66.5% standard diet). Four weeks later, diabetes was induced by a single intraperitoneal injection of streptozotocin (STZ; 35 mg/kg; Sigma, St, Louis, MO, USA) dissolved in citrate buffer (PH = 4.5). The control rats received an equivalent volume of the citrate buffer solution alone. Eight weeks after injection, blood insulin and glucose levels were measured after overnight fasting. Homeostasis model assessment for insulin resistance (calculated as fasting blood glucose [FBG] × fasting blood insulin [FINS]/22.5) was performed to identify rats with insulin resistance. Only rats with both insulin resistance and a high blood glucose level (FBG ≥ 16.7 mmol/L) were considered to be a rat model of T2DM (11). Finally, 20 rats were identified to be T2DM models and thus included in this study.
Electrocardiography and echocardiography
At the eighth week of diabetes, electrocardiography was performed using a BL-420F biological and functional experimental system (Chengdu TME Technology Co. Ltd, Chengdu, China), as previously described (12). A three-lead surface electrocardiogram (ECG) was performed, with the electrodes positioned under the skin to approximate lead II, which always yields wider P-wave durations than any other lead (13). ECG readings were sampled using a 1-KHz sampling rate. In this study, the P-wave duration was the mean of 3 P-wave durations determined from consecutive beats, which were manually measured by an experienced observer. Each measurement was performed according to the protocol described by Maeno et al. (14).
With the rats under anesthesia, two-dimensional echocardiograms were obtained as previously described (15). A 15MHz linear probe (Sequoia C512, Acuson-Siemens, CA, USA) was used to perform transthoracic echocardiography. The left atrial anteroposterior diameter at end-diastole (LADd) was the mean value of measurements from 3 cardiac cycles. The observers were blinded to which rat they were assessing.
Isolation of rat atrial myocytes
After follow-up Electrocardiography and echocardiography, the rats were killed under anesthesia. The isolation of rat atrial myocytes was performed as previously described, with some modifications (16). Briefly, the heart was rapidly excised and underwent retrograde perfusion in a Langendorff perfusion system with calcium-containing Tyrode’s solution (NaCl 136 mM, KCl 5.4 mM, CaCl2 1.5 mM, K2HPO4·2H2O 0.33 mM, MgSO4·7H2O 1.0 mM, glucose 10 mM, HEPES 10 mM [pH adjusted to 7.3-7.4 with NaOH 1M]) at a rate of 4.5 mL/minute. After 4-minute of perfusion with the Ca2+-containing Tyrode’s solution, the perfusate was then switched to Ca2+-free Tyrode’s solution for 5 minutes. Then the heart was perfused with the Ca2+-free Tyrode’s solution containing type II collagenase (0.5 mg/mL, Gibco BRL Co. Ltd, MD, USA) for 24 minutes. Left atrial tissue was then removed from the softened hearts, finely chopped, and gently agitated in a fresh enzyme solution for 5 minutes, at 37ºC. The suspension was then centrifuged and the cardiomyocyte pellet was re-suspended in KB medium (KOH 80 mM, KCl 30 mM, L-glutamic acid 50 mM, MgCl2 1 mM, HEPES 10 mM, glucose 10 mM, KH2PO4 20 mM, taurine 20 mM, EGTA 0.5 mM [pH adjusted to 7.3-7.4 with KOH 1M]). The suspension of cardiomyocytes was then stored at 4ºC for subsequent experiments. Only single, quiescent and Ca2+-tolerant cardiomyocytes were used.
Patch clamp experiments
A whole-cell patch clamp technique was used to record the sodium current (INa) and the inward rectifier K+ current (Ik1) using an Axopatch 200B amplifier (Molecular Devices Corporation, CA, USA) in the voltage-clamp mode. Action potentials (APs) were recorded using the Multiclamp 700B amplifier in the current-clamp mode. All experiments were performed at room temperature (22-23ºC)
To record the INa, the electrolyte solution contained the following: CsCl 120 mM, MgCl2 1 mM, HEPES 10 mM, Mg-ATP 4 mM, EGTA 10 mM, Na2-GTP 0.3 mM; and the pH was adjusted to 7.2 with CsOH 1M. The extracellular solution contained the following: NaCl 140 mM, KCl 3.5 mM, CaCl2 2 mM, MgCl2 1 mM, HEPES 10 mM, glucose 10 mM, NaH2PO4 1.25 mM, CdCl 0.1 mM; and the PH was adjusted to 7.4 with NaOH 1M. To elicit the INa current, the membrane potential was held at -90 mV, and then depolarized from -90 mV to +80 mV using 50-ms depolarizing steps in 5-mV increments.
Ik1 and action potential (AP) recordings were performed using an electrolyte solution containing the following: K-gluconate 140 mM, NaCl 5 mM, HEPES 10 mM, MgCl2 1 mM, EGTA 1 mM, Mg-ATP 2 mM, CaCl2 0.1 mM; and the pH was adjusted to 7.2. The external electrolyte solution contained the following: NaCl 140 mM, KCl 3.5 mM, CaCl2 2 mM, MgCl2 1 mM, HEPES 10 mM, glucose 10 mM, NaH2PO4 1.25 mM, pH 7.4. Ik1 currents were recorded under holding potential of -80 mv, and then a 400-ms depolarized voltage pulse from jumped -150 mV to +60 mV stepped by 10 mv. APs were elicited by current injecting with increasing amounts of current from 100 pA to 3000 pA using a 5-ms stimulus. The action potential parameters, which included the resting membrane potential (RMP), action potential duration (APD), and action potential amplitude (APA) were analyzed using the pCLAMP software (Version 9.02; Axon Instruments Inc, CA, USA).
Western blot analysis
Cardiac protein lysates were made from rapidly harvested tissue by homogenizing left atrial tissues in Radio Immunoprecipitation Assay Buffer (RIPA buffer, Beyotime, Shanghai, China). Equal quantities of total protein were fractionated by SDS-PAGE (10% polyacrylamide gels) and transferred to PVDF membranes (Millipore, Billerica, MA, USA). After blocked with 5% skimmed milk, the membranes were then incubated in Tris-buffered saline containing anti-Cx40 (1:500, Millipore, MA, USA), anti-Cx43 (1:2,000, Millipore, MA, USA), or anti-GAPDH (1:1,000, ZSGB-BIO, Beijing, China) overnight at 4ºC. Purified polyclonal primary antibodies against Cx40 and Cx43 were both raised in rabbit. Monoclonal antibody against GAPDH was raised in mouse. On the next day, the membranes were washed and then incubated with the horseradish peroxidase-conjugated anti-rabbit or anti-mouse IgG (1:2,000, ZSGB-BIO, Beijing, China) in the blocking buffer. The blots were visualized using an enhanced chemiluminsecence (Pierce Biotechnology, Inc., Rockford, IL, USA) and ChemiDoc MP Imaging System (Bio-Rad laboratories, Inc., CA, USA). Protein quantification was determined by densitometric analysis using Image J software (NIH, Bethesda, MD, USA) and normalized by GAPDH.
Immunofluorescent staining and analysis
The atrial tissues were embedded in opti-mum cutting temperature compound (OCT compound). The embedded specimens were then cut into 8-um sections and fixed in 4% paraformaldehyde buffer, followed by immunostaining. After blocked with 5% goat serum, the sections were incubated overnight at 4ºC with the following primary antibodies: rabbit anti-Cx40 (1:50, Millipore, MA, USA), rabbit anti-Cx43 (1:100, Millipore, MA, USA) and mouse anti-αactinin antibody (1:50, BosterBio, Wuhan, China). On the next day, the samples were washed, and then incubated for 4 hours at room temperature with the following corresponding secondary antibodies: goat anti-rabbit IgG conjugated to FITC (1:100, Proteintech, Chicago, USA) and goat anti-mouse IgG conjugated to TRITC (1:100, BosterBio, Wuhan, China). Nuclei were counter stained using 4’6-diamidino-2-phenylindole (DAPI, Beyotime, Shanghai, China). Photographic images were obtained using a wide-field fluorescence microscope (Carl Zeiss microscopy, Jena, Germany).
Staining for fibrosis
Samples of left atrium were fixed in 4% paraformaldehyde buffer, embedded in paraffin and cut into 5-um sections. Masson trichrome staining was performed according to previously published methods (11). Photographic images were obtained using a digital CCD camera (Qicam, Qimaging, Canada) installed on a Zeiss Axio imager A1 microscope (Carl Zeiss microscopy, Jena, Germany). Areas of perivascular and epicardial fibrosis were excluded by setting the region of interest. The fraction of atrial tissue made up of fibrotic tissue was determined using Image J software (NIH, Bethesda, MD, USA)
RESULTS
Rat characteristics
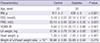
Table 1 shows the characteristics of the control (n = 15) and T2DM (n = 20) rats 8 weeks after injection of citrate buffer or STZ, respectively. FBG and FINS were significantly higher in T2DM rats. Homeostasis model assessment for insulin resistance (HOMA-IR) was significantly increased in T2DM rats. Body weight, LA weight and heart weight were significantly higher in T2DM rats than in control rats. However, the left atrial weight/total heart weight ratios were similar for the T2DM and control rats.
Table 1
The characteristics of control and type 2 diabetic rats
T2DM-induced prolonged P-wave duration and unchanged LADd
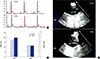
Remarkably, the mean P-wave duration was longer in T2DM (n = 20) than in control (n = 15) rats (19.95 ± 0.41 vs. 17.40 ± 0.47 ms, respectively; P < 0.001; Fig. 1A and C), which is a 13% prolongation of the P-wave duration for the T2DM rats compared with the control rats. To determine if the size of left atrium was affected by the diabetic condition, transthoracic echocardiography was performed. As shown in Fig. 1B and C, the LADds of the control and T2DM rats were similar (4.51 ± 0.04 mm vs. 4.41 ± 0.05 mm, respectively; P = 0.145). Other ECG data from control and type 2 diabetic rats are shown in Table 2.
Fig. 1
Electrocardiographic and echocardiographic images from control and type 2 diabetic rats. (A) Abnormal prolongation of P-wave duration in diabetic rats (Lead II). (B) Left atrial anteroposterior diameter at end-diastole (LADd) in the parasternal long axis view. (C) Summary data of P-wave duration and LADd in control (N = 15) and T2DM (N = 20) rats. *P < 0.001 vs. control.
Depolarization characteristics of atrial myocytes from the T2DM and control rats
To investigate the ionic mechanisms involved in the prolonged P-wave duration of T2DM rats, single-cell Ik1, INa, and AP parameters were recorded from left atrial myocytes. As illustrated in Fig. 2, there was no significant difference in the density of Ik1 in control and T2DM rat myocytes (-7.57 ± 0.42 vs. -7.71 ± 0.39 pA/pF, respectively, n = 11 cells from 3 rats per group; P = 0.820). Correspondingly, there was no significant difference in the RMP of the control and T2DM rat myocytes (-78.81 ± 0.69 vs. -79.25 ± 1.07 mV, respectively, n = 11 cells from 3 rats per group; P = 0.732; Fig. 4C). Fig. 3 shows the density of INa, which determines the APA. There was no significant difference in the density of INa of the control and T2DM rat myocytes (-50.37 ± 1.53 vs. -52.08 ± 4.04 pA/pF, respectively, n = 11 cells from 3 rats per group; P = 0.697; Fig. 3D). Fig. 4B shows the APD at 50% repolarization (APD50) and 90% repolarization (APD90). The APD50 and APD90 were approximately 78% and 49% longer, respectively, in the T2DM than in the control rat myocytes (in control: mean APD50 = 15.91 ± 0.88 and APD90 = 46.87 ± 0.80 ms; in T2DM: mean APD50 = 28.26 ± 2.74 and APD90 = 69.84 ± 5.34 ms, n = 11 cells from 3 rats per group; P < 0.001). Fig. 4D shows that there was no significant difference in the APAs of the control and T2DM rat myocytes (128.43 ± 1.17 mV vs.131.23 ± 2.00 mV, respectively, n = 11 cells from 3 rats per group; P = 0.242).
Fig. 2
Comparison of inward rectifier K+ current (Ik1) densities from atrial myocytes of normal and type 2 diabetic rats. (A) Ik1 traces from a normal atrial myocyte. (B) Ik1 traces from a diabetic atrial myocyte. (C) Ik1 density-voltage relationships in normal and diabetic rats. (D) Summary data of Ik1 densities (at -150 mv) in control (n = 11 cells from 3 rats) and diabetic (n = 11 cells from 3 rats) rats.
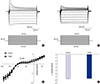
Fig. 3
Comparison of Na+ current (INa) densities from atrial myocytes of normal and type 2 diabetic rats. (A) INa traces from a normal atrial myocyte. (B) INa traces from a diabetic atrial myocyte. (C) INa density-voltage relationships in normal rats and type 2 diabetic rats. (D) Summary data of INa densities (at -30 mv) in control (n = 11 cells from 3 rats) and diabetic (n = 11 cells from 3 rats) rats.
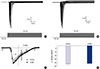
Fig. 4
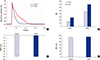
Recordings of action potentials in left atrial myocytes from control and type 2 diabetic rats. (A) Representative recordings of action potentials in left atrial myocytes from control (blue) and diabetic (red) rats. (B) Pooled data for APD at 50% (APD50) and 90% (APD90) repolarization in control (n = 11 cells from 3 rats) and diabetic rats (n = 11 cells from 3 rats) rats. (C) Summary data of resting membrane potential (RMP) in control (n = 11 cells from 3 rats) and diabetic (n = 11 cells from 3 rats) rats. (D) Summary data of action potential amplitude (APA) in control (n = 11 cells from 3 rats) and diabetic (n = 11 cells from 3 rats) rats. *P < 0.001 vs. control.
Expression and distribution of connexin proteins
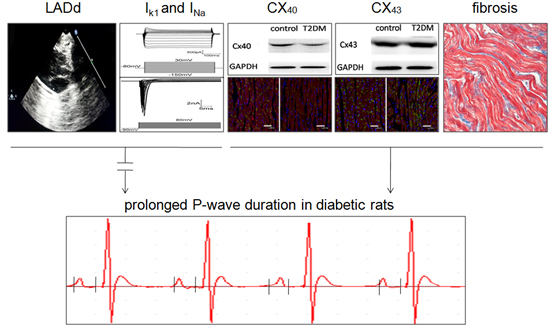
To gain insights into molecular mechanisms involved in the prolonged P-wave duration in T2DM rats, we examined the gap junction proteins Cx40 and Cx43, which are important determinants for impulse propagation in the heart (17). As shown in Fig. 5A and C, the expression of Cx40 was significantly reduced in the left atrial tissue of T2DM rats compared to control rats. There was no significant difference in the expression levels of Cx43 (Fig. 5B and C). Immunofluorescent staining showed that expression of CX40 in atrial myocytes was mainly distributed at the end-end junctions of myocardial cells in a linear form, and was rarely expressed at the side-side junctions of these cells (Fig. 6A). Whilst expression of CX40 in atrial myocytes of T2DM rats was mainly distributed at the end-end junctions of myocardial cells in a punctiform manner, and the distribution was significantly sparser than that of control rats, which was consistent with the western-blotting data on Cx40 protein expression.
Fig. 5
Protein expression levels connexin-40 (Cx40) and connexin-43 (Cx43) in control and type 2 diabetic rats. (A) Representative Western blots for Cx40 protein in control and diabetic rats. (B) Representative Western blots for Cx43 protein in control and diabetic rats. (C) Relative ratios of Cx40/GAPDH and Cx43/GAPDH in control (n = 5) and diabetic (n = 5) rats. *P < 0.001 vs. control.
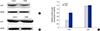
Fig. 6
Connexin-40 and connexin-43 protein immunostaining of left atrial tissue from a control and a type 2 diabetic rat. (A, B) Representative distribution of Cx40 (green) from control and diabetic rats, respectively; (C, D) Representative distribution of Cx43 (green) from control and diabetic rat, respectively. (A-D) α-actinin is stained red and nuclei are stained blue (Scale bars = 50 um).
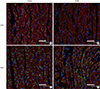
In addition, some of the CX40 was distributed in the cytoplasm (Fig. 6B). While most of the CX43 in atrial myocytes of control rats was distributed at the end-end junctions of myocardial cells in a linear form, some of the CX43 in atrial muscle cells was distributed in a clustered form (Fig. 6C). In atrial muscle cells in T2DM rats, CX43 was mainly distributed at the side-side junctions of myocardial cells in a linear and intensive form, which demonstrated the enhanced lateralization (Fig. 6D).
Staining for fibrosis
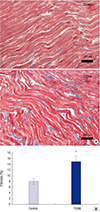
In addition to ionic currents and gap junction proteins, the degree of interstitial fibrosis is another major determinant of conduction velocity (18). Masson trichrome staining of sections of left atrium revealed that the proportion of interstitial fibrosis was higher in the left atrium of T2DM rats than in control rats (Fig. 7).
DISCUSSION
The major findings of this study were the following: 1) the mean P-wave duration was longer in T2DM rats than in normal control rats, but the mean sizes of the left atrium of both groups rats were similar; 2) the densities of INa and Ik1 were unchanged in T2DM rats compared to controls; 3) the APD was longer in T2DM rats, but the APA and RMP were unchanged compared to controls; 4) the protein expression level of Cx40 was lower but the Cx43 level was unaltered in T2DM rats. In contrast, enhanced Cx43 lateralization was observed in T2DM rats, with normal location of the Cx40 distribution; 5) staining showed interstitial fibrosis was greater in T2DM rats. To our knowledge, this is the first study that demonstrates changes in P-wave duration, AP, Cx40 and Cx43 protein expression in the atrium of T2DM rats. These findings indicate that prolonged P-wave duration is a result of abnormal interatrial conduction and does not depend on the size of left atrium in T2DM. The effect of T2DM on P-wave duration may be mediated at least in part by dysregulation of Cx40 and Cx43 protein expression, as well as fibrosis.
In this study, P-wave duration was significantly longer in T2DM rats (Fig. 1A). It has been well documented that prolonged P-wave duration is highly specific for enlargement of the left atrium (19). We further performed transthoracic echocardiography on rats and found that the LADd of both the T2DM and control rats were similar (Fig. 1B and C), suggesting that the size of left atrium was not affected by the pathological state of diabetes. Prolonged P-wave duration without left atrial enlargement was not surprising. P-wave duration determined by electrocardiography corresponds to the time required for complete depolarization of the right and left atrium, and it is affected by various factors, including age, adiposity, systolic and diastolic blood pressure, deceleration time and isovolumic relaxation time. In any case, prolonged P-wave duration without left atrial enlargement indicates a conduction disorder of the diabetic atrium, along with the possible involvement of other mechanisms.
As described in previous studies, in addition to the size of left atrium, the conduction time of the myocardium has 3 other major determinants that affect P-wave duration: INa, gap junction proteins, and fibrosis (18). In fact, Ik1 is another factor that cannot be ignored, since it plays a major role in the maintenance of RMP (20), which might affect INa availability, thereby reducing the conduction velocity. Our results showed no changes in Ik1 or INa density in the diabetic rat atrium (Fig. 2 and 3). Correspondingly, the RMP and APA remained unchanged between diabetic and nondiabetic hearts (Fig. 4C and D). These results suggest that the generation of depolarization was not impaired in the atrium of T2DM rats. We note that our observation of unaltered density of INa is inconsistent with the previous study of Stables et al. (21), showing that the INa density was reduced by ~32% in diabetic rabbit myocytes. One reason for this discrepancy might be the differences in diabetic model types (type 1 in their study vs. type 2 in ours) and the duration of diabetes (21weeks in their study vs. 8 weeks in our study). Another reason might be that different tissues were studied in the 2 studies (rabbit ventricle in their study vs. rat atrium in ours). Although the APD in the ventricular myocytes from an earlier diabetic model had been investigated (9), data on APD in T2DM atrium remains limited (10). We further demonstrated that APD was prolonged in T2DM atrial myocytes (Fig. 4A and B). As described previously (9), the prolongation of APD was associated with the attenuation of the transient outward K+ current (Ito) in diabetic ventricular myocytes. Whether a similar mechanism might be involved in T2DM atrial APD prolongation needs further investigation. We also note that our observation of increased cell capacitance (Cm, data not shown), which represents increased cell size, may contribute to increased conduction velocity in the myocardium (22). However, that could be offset by gap junction lateralization, and the net result may lead to reduced conduction velocity (23,24).
Since the generation of action potential was not impaired, delayed propagation of action potentials may be involved in the P-wave prolongation of T2DM. As previously described, intercellular coupling via gap junction proteins is a significant determinant of electrical conduction in the heart (18). Immunohistochemical studies have indicated that the gap junction proteins Cx40 and Cx43 are expressed in mammalian atrium (25,26,27). Altered expression and distribution of connexin proteins is a recurring theme in the remodeling associated with many cardiovascular diseases. In this study, we demonstrated that the protein expression level of Cx40 was decreased, but Cx43 was unaltered in T2DM rat atrium (Fig. 5). On the contrary, enhanced Cx43 lateralization was observed in T2DM atrial tissue, with normal distribution of Cx40 (Fig. 6). A previous study has demonstrated that P-wave duration was significantly prolonged in Cx40 knockout (Cx40−/−) mice (28). Moreover, changes in Cx43 localization indeed contribute to the slowing of cardiac conduction (24). In addition, the extent of fibrosis is strongly associated with P-wave duration in the atrial myocardium (29). Taking these findings into account, there is no doubt of the crucial roles of Cx40 and Cx43 proteins, as well as fibrosis, in cardiac conduction. It is therefore conceivable to assume that the effect of T2DM on P-wave duration may be mediated at least in part by dysregulation of Cx40 and Cx43 protein expression, as well as fibrosis.
In conclusion, prolonged P-wave duration is a result of abnormal interatrial conduction and not dependent on the left atrial size in rats with T2DM. Dysregulation of Cx40 and Cx43 protein expression, as well as fibrosis, might partly account for the prolongation of P-wave duration in T2DM. However, there are several limitations that should be considered when interpreting the results. First, for technical reasons, we did not directly examine atrial conduction velocity. Prolonged P-wave duration obtained from the electrocardiogram can indicate slowing conduction velocity in the atrium, but the conduction velocity may be affected by various factors. In addition, the exact time of the propagation of electrical impulse cannot be determined. Second, although we found that Cx40 was down-regulated in T2DM atrium, we did not investigate the mechanisms. Third, we did not investigate the affect of the specialized conduction system on electrical conduction. Therefore, additional studies are needed to fully elucidate the mechanism of prolonged P-wave duration in T2DM. Despite these limitations, our study provides new insights into the mechanisms by which T2DM can affect the P-wave duration.
 XML Download