

 PDF
PDF ePub
ePub Citation
 Print
Print


INTRODUCTION
Mass casualty incidents (MCIs) are defined as accidents that result in a number of victims that exceed the local medical or health care system’s ability to meet the victims’ healthcare needs. These MCIs typically involve several patients who are managed using everyday resources (without a major disaster response) (1), and may temporarily overwhelm the local emergency medical services (EMS) and emergency healthcare resources. Therefore, it is difficult to adequately prepare for and respond to MCIs, because EMS and hospital resources are typically fully utilized for routine medical services. Moreover, the EMS or hospital emergency response personnel often cannot estimate or decide on the amounts and types of resources that are needed, due to the unclear epidemiological characteristics of MCIs. Only a few detailed analyses have examined consecutive MCIs (123), and many researchers only understand MCIs as individual incidents or events in a specific geographical region.
Given the lack of clarity regarding MCIs’ characteristics, epidemiological data should be collected for each MCI. However, it is difficult to collect information from MCI victims via interview or observation, due to the related environmental and medical conditions. It is possible to obtain epidemiological information by tracking the patient from the field to the hospital (electronically or manually), although the cost of that technique is high and it can only collect incomplete data. Researchers have recently been able to retrospectively retrieve data from electronic EMS databases, although these data are limited regarding hospital care or outcome information.
For MCI research, the most important issue is the nature of the MCI. In this context, an MCI is not defined using an absolute number of victims, but rather as a number of victims that exceeds a medical system’s ability to meet their healthcare needs using the locally available medical resources (24). However, this definition is conceptual (not practical), and the declaration of an MCI typically depends on the decision of an EMS provider, and not the victims’ desired or required medical attention. Therefore, a new working definition of MCIs is needed, and a recent scientific framework has been developed using expert opinions (5). This framework defines an MCI as any event that results in ≥ 6 casualties (up to and including death).
In this study, we used this definition to search an EMS database, and surveyed the resulting medical records to establish an EMS-assessed MCI database that included prehospital and hospital variables. Using these data, we aimed to describe the epidemiological characteristics and outcomes of EMS-assessed MCIs, in order to better understand their incidences, mechanisms, mortality rates, and morbidity rates.
MATERIALS AND METHODS
Study design
This cross-sectional observational study evaluated an EMS database for six South Korean provinces during 2012. We defined an EMS-assessed MCI as any event that involved ≥ 6 victims who were transported via EMS, according to the experts’ consensus definition (5).
Study setting
The six study provinces use the same EMS system, which is provided by the national EMS agency (119 Rescue and EMS Bureau of Ministry of Public Safety and Security Central Fire Service). In all study provinces, the local EMS must respond to MCIs, regardless of their cause or location of the incident. There was no special mass casualty triage protocol for EMS providers at the time of this study, and patients who wanted or needed medical care were transported to the destination hospital at the EMS provider’s discretion. These patients were typically received at the destination hospital’s Emergency Department (ED), where they underwent medical evaluation or treatment according to the specific ED’s protocols. The patient’s disposition was recorded after they had received ED care.
Database and subjects
The 119 Rescue and EMS Bureau has created an electronic database for EMS dispatch and prehospital patient care records, which has been in use since 2006. Each event that results in an emergency call is coded using a unique number (the incident code), regardless of the type of call (e.g., EMS, fire, or rescue), and the code of the ambulance that is dispatched is linked to this incident code. In addition, EMS personnel in that ambulance are required to complete a patient care sheet for each patient, and this record is automatically saved with the incident code. In this system, the same incident code is attached to each prehospital patient care record for all victims who are involved in a single MCI.
To identify EMS-assessed MCIs, we extracted incident codes that were linked to ≥ 6 patient prehospital care records from the EMS database. All patients who were involved in EMS-assessed MCIs in the six study areas were eligible for this study. Using the name of the receiving hospital (from the prehospital care record), trained independent surveyors from the Korea Center for Disease Control and Prevention visited the receiving hospitals and performed a medical record review using a structured case report form. After the medical record review, we excluded patients who were not registered at the hospital, had missing medical records, or had an unknown outcome at the ED or hospital. All data were saved digitally using EpiData Data Entry (Odense, Denmark) (6) and were checked for errors using SAS software (version 9.4; SAS Institute Inc., Cary, NC, USA).
Variables and analysis
We collected the following data from the EMS database: incident number, prehospital care record number, incident call time, ambulance departure time, scene arrival time, scene departure time, hospital arrival time, sex, age, location, mechanism of injury, and name of the receiving hospital. The medical record review collected data regarding the patient’s sex, age, whether the injury was intentional, mechanism of injury, place of injury, ED arrival time, disposition time, discharge time, surgery, ED disposition and outcome, admission result, Glasgow Outcome Scale (GOS) score at discharge, Injury Severity Score (ISS; based on the updated 2008 Abbreviated Injury), and final diagnosis. The intentional nature of the events, mechanism of injury, and place of injury were categorized according to version 1.2 of the International Classification of External Causes of Injuries (ICECI version 1.2; http://www.iceci.org). If the same variables for a given patient were different between the prehospital and hospital records, we selected the information from the hospital database.
To analyze the patient and event characteristics, we categorized EMS-treat MCIs according to the cause of the event. No MCIs in the database were caused by a natural disaster and all MCIs were caused by man-made hazards, which included fire accidents (FAs), road traffic accidents (RTAs), chemical and biological agents (CBs), and other mechanical causes (MECHs). The numbers of events and patients were calculated according to cause, and the number and rate were calculated for each variable. Prehospital time-related variables were categorized using 10-min intervals, ED length of stay was categorized using 3-h intervals, and hospital length of stay was calculated in days. We performed descriptive analyses of the numbers of patients, incidence rates, and outcomes using Stata software (version 13.1; StataCorp, College Station, TX, USA).
RESULTS
A total of 362 EMS-assessed MCIs were identified using the EMS database, with 66–90 events occurring in each area. The highest crude incidence rate for EMS-assessed MCIs was 5.0 per 100,000 population, which occurred in Jeonnam (a predominantly rural area). The lowest crude incidence rate was 0.6 per 100,000 population, which occurred in Daegu (a predominantly urban area) (Table 1).
Table 1
Area-specific crude incidence rates for emergency medical system-assessed mass casualty incidents

![]()
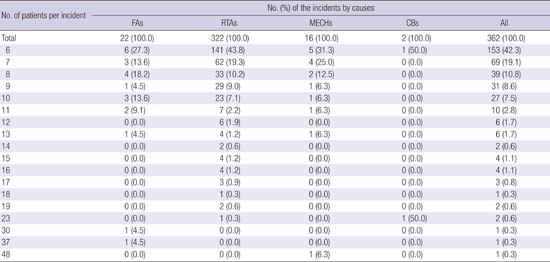
Among the 362 EMS-assessed MCIs, 322 were caused by RTAs and only 2 MCIs were caused by CBs. Each MCI involved 6–48 patients, and there were 6 patients in 153 of the MCIs. Most of the EMS-assessed MCIs (319 events, 88.1%) involved ≤ 10 patients (Table 2).
Table 2
Number of mass casualty incidents according to the number of involved patients

FAs, fire accidents; RTAs, road traffic accidents; CBs, chemical and biological agents; MECHs, other mechanical causes.
![]()
A total of 2,578 patients (54.3% women) were involved in EMS-assessed MCIs in the six study areas. The age groups with the highest level of involvement were patients who were in their 40s and 50s (15.3% and 16.3%, respectively), and women were more common than men in most age groups (except in the 0–9 years old group) and MCI causes (except for MECHs). The most common cause of the MCIs was RTAs, and the number of patients who were involved in RTAs was 2,201 (85.3%). The vast majority (99.7%) of these patients were involved in an unintentional event. In FAs, “threat to breathing” was the most common mechanism of injury, and transportation and fall were the common mechanisms of injury for MECHs. The FAs occurred most frequently at home, in a “transport area: other,” or in a commercial location. The CBs occurred most frequently in transport and commercial areas, and the MECHs occurred most frequently in “transport area: other,” the countryside, and industrial and construction areas (Table 3).
Table 3
Patients’ demographic characteristics according to the incident’s cause

FAs, fire accidents; RTAs, road traffic accidents; CBs, chemical and biological agents; MECHs, other mechanical causes. Transport area includes public highway, street, or road.
![]()
The response time was ≤ 10 minutes in 36.3% of the MCIs and > 30 minutes in 14.6% of the MCIs. An EMS response time of ≤ 10 minutes was achieved in 38.4% of the FAs, 37.1% of the RTAs, 20.9% of the MECHs, and 27.6% of the CBs. Over half of the patients were transferred to a hospital within < 20 minutes, regardless of the injury mechanism, and 79.2% of the patients stayed in the ED for < 6 hours (Table 4). In all categories, a higher number of patients per incident was associated with a longer prehospital time. However, the relationship between prehospital time and the number of patients per incident varied for each cause (Fig. 1).
Table 4
Cause-specific prehospital and hospital times for patients who were involved in mass casualty incidents

FAs, fire accidents; RTAs, road traffic accidents; CBs, chemical and biological agents; MECHs, other mechanical causes; ED, emergency department; Response time, interval from call to scene arrival; On-scene time, interval from scene arrival to scene departure; Transport time, interval from scene departure to hospital arrival; Length of ED stay, interval from ED arrival to disposition; Length of hospital stay, interval from disposition to discharge for hospitalized patients.
![]()
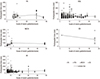 | Fig. 1Prehospital time according to cause and scale of the event.FAs, fire accidents; RTAs, road traffic accidents; CBs, chemical and biological agents; MECHs, other mechanical causes.
|
Among the 2,578 patients, 1,640 (63.6%) patients were discharged from the ED and 617 (23.9%) were admitted. The highest admission rate was observed for CBs (16 patients, 55.2%), and surgery was performed for 52 (2.0%) patients, who were typically involved in an RTA. The admitted patients were typically discharged without complication (84.8%) or transferred (10.9%). The total number of deaths in the study cohort was 32 (1.2%). The ISS could not be calculated for patients whose injuries were related to FAs and CBs, because their diagnoses were generally related to poisoning. In the RTA and MECH groups, most patients exhibited a low level of injury severity, with an ISS of < 9 (86.6% and 65.9%, respectively; Table 5).
Table 5
Cause-specific outcomes of patients who were involved in mass casualty incidents

FAs, fire accidents; RTAs, road traffic accidents; CBs, chemical and biological agents; MECHs, other mechanical causes. *The admission result is calculated as the % of admitted patients in each category.
![]()
DISCUSSION
Previous studies of MCIs have been limited to single incidents or single hospitals (7), or have only focused on prehospital care (128). Moreover, many researchers have demonstrated that the understanding of MCIs is often limited to individual incidents or local geographic regions (2). To our knowledge, this study is the first MCI study to use a hospital survey that was based on multi-region EMS data with an MCI definition of ≥ 6 patients being involved in the event. This definition was developed and chosen based on expert consensus (5).
The absolute number of victims has not been considered as a definition for MCIs, which have typically been defined as events that exceed the medical system’s ability to meet the health care needs of the MCI victims using locally available medical resources (4). However, the availability of local medical resources varies according to the time, place, and type of event. In Helsinki (Finland), the EMS systems define MCIs as incidents that involve 3–20 patients (1). In contrast, the American National Emergency Medical Services Information System defines MCIs as an event that generates more patients than the locally available resources can manage (using routine procedures), or an event that results in a large number of victims who disrupt the normal course of emergency and health care services and require additional non-routine assistance (2). It might be possible to determine the number of patients that would exceed the available resources at a given time if we could measure the available resources at the time of the MCI. However, the amounts and types of resources vary according to time. Therefore, it is reasonable to define MCIs using an absolute number of patients, provided that number is based on a consensus expert opinion that considers the local or national amount and distribution of EMS and hospital resources. In the present study, we defined MCIs as an event with ≥ 6 victims, and this definition was based on expert consensus (5), because 6 victims is appropriate to the scale of an MCI. For example, Schenk et al. reviewed the 2010 National EMS Database and found that the median number of patients per incident was 1, which was much lower than the expected number (2).
In the present study, the incidence rates for MCIs per population in rural areas (Gangwon, Jeonnam, Chungnam) were higher than those in urban areas. Similar to our findings, Kuisma et al. (1) have reported that the MCI incidence rate was 1.8/100,000 population per year in Helsinki (an urban area). In contrast, an estimated 36,529 MCIs occurred during 2010 in the US, with an incidence rate of 13.0 MCIs per 100,000 population and the majority of these incidents occurring in an urban setting (2). These differences are likely due to different operational definitions of MCIs that were used in each study. In addition, the higher American incidence rate is due to the inclusion of incidents that included only 1 patient. The level of urban development in the present study was based on Korean administrative districts, with metropolitan cities (population of > 1,000,000 people) being designated as urban areas and all other areas being designated as rural areas.
Most of the MCIs (89.0%) in the present study were caused by RTAs, and this finding is similar to the findings of Kuisma et al. (1). This similarity is likely because both studies used an EMS database, and other events (e.g., FAs or CBs) may occur simultaneously and involve the same EMS responder. Although only a few FA- or CB-related MCIs were recorded in the EMS database, these events are important, as EMS personnel are typically not familiar with the appropriate protocol. Therefore, EMS personnel should be prepared for these events.
The injury mechanism varied according to the cause of the MCI, with RTAs typically resulting in blunt trauma and FAs typically resulting in respiratory difficulty. Therefore, EMS personnel should be trained to approach the scene and understand the patients’ specific needs based on these differences. Although most of the RTA MCIs were small-scale accidents with appropriate EMS responses, FA or CB MCIs can result in large-scale events and prevention of these events is very important.
Most of the patients in the present study exhibited mild injuries (an ISS score of < 15), and the admission rate was not high. This suggests that most of the MCI-related burden was borne by prehospital EMS and ED resources, rather than hospital resources. However, more than half of the patients from CB MCIs were admitted, which indicates that these patients create a burden on hospital resources, due to their acute symptoms that require observation for several days.
Thirty-three patients (1.2%) from 22 events ultimately died. Among those patients, 11 patients (5.0%) died due to 3 FAs, 19 patients (0.9%) died due to 16 RTAs, and 2 patients (1.6%) died due to 2 MECHs. Thus, it appears that FAs were the most frequent cause of death, and FAs in Busan were associated with 30 victims including 8 deaths. The main mechanism of deaths due to this FAs was “threat to breathing,” and 6 patients died after receiving cardiopulmonary resuscitation in the ED. In contrast, 13 of the 19 deaths due to RTAs occurred during the prehospital phase.
This study included several limitations. Although we attempted to establish a complete database, it is possible that the number of patients who were involved in MCIs was underestimated. For example, it is possible that some patients who were involved in MCIs were not transported by EMS (due to minor injury or on-site mortality), and would have been omitted from our results. Similarly, it is possible that some patients who were transported from the MCI scene did not receive hospital treatment, due to prehospital treatment of minor injuries. To overcome this potential inconsistency, we suggest that a system should be developed and implemented to track patients from the scene of the MCI to the hospital.
In conclusion, we established an EMS-assessed MCI database using an EMS database and the patients’ hospital records in this study. Our findings indicate that the MCI incidence rates are higher in rural areas, and that RTAs are the most common cause of MCIs. Although most MCIs were small-scale incidents, the prehospital time increased with an increasing number of patients. Furthermore, MCIs from RTAs may create a burden on prehospital EMS and ED resources, and MCIs from CBs may create a burden on hospital resources. Moreover, the main injury mechanism varies according to the cause of the MCI.
 XML Download