

 PDF
PDF ePub
ePub Citation
 Print
Print


INTRODUCTION
Obesity is a significant medical issue threatening public health not only in Western countries but also in Asian countries. As of 2008, more than 10% of the world population, about 500 million adults, was obese (1), which was expected to explosively increase in the future (2). Especially, abdominal obesity has more serious clinical implication. It has been reported that abdominal obesity was more significant risk factors for various diseases such as diabetes, cardiovascular disease and metabolic syndrome than general obesity (345). In addition, medical problems related to abdominal obesity are rapidly raising medical cost, which is burdening social financial stability (6). Accordingly, these situations are increasing the necessity for academic activity or business to prevent abdominal obesity.
Non-alcoholic fatty liver disease (NAFLD) is the most prevalent chronic liver disease characterized as the fatty liver infiltration and damaged hepatocyte (78). Since a lot of researches have been actually performed to investigate the association between NAFLD and abdominal obesity, deep clinical and mechanical relationships were revealed between 2 factors. However, most of studies have mainly focused on the effect of abdominal obesity for NAFLD, and studies for the reverse relationship were very rare. Nonetheless, considering the significant function of liver in processing biochemical reaction of major metabolic factors such as fat, glucose, and insulin, it is worthy to research into the effect of NAFLD on the development of abdominal obesity. Thus, we conducted this study to investigate the risk of abdominal obesity according to the degree of NAFLD.
MATERIALS AND METHODS
Study design
A prospective cohort study was conducted in order to investigate the association between NAFLD and the development of abdominal obesity. Study population consisted of Korean men undergoing a medical health check-up program annually or biennially at Total Healthcare Center of Kangbuk Samsung Hospital, Sungkyunkwan University, Seoul, Korea. The background and the purpose of medical health check-up program was described in our previous journal in detail (9).
Study population
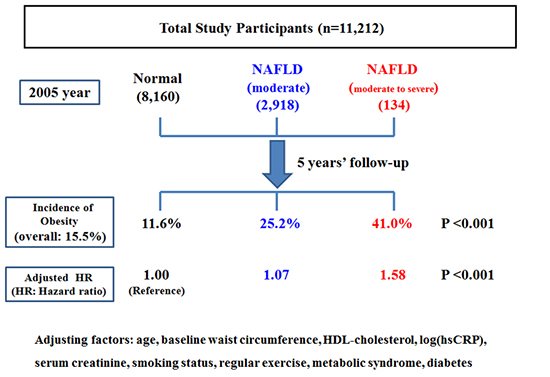
The study participants were the total of 28,425 men who had examined the waist circumference (WC) for medical check-up in 2005 participated in this study. Among the 28,425 participants, 12,498 were excluded for various reasons: 1,340 had a positive serologic marker for hepatitis B surface antigen (HBsAg); 53 had a positive serologic marker for hepatitis C virus antibody (HCVAb); 308 had abnormal ultrasonographical findings of chronic liver disease, liver cirrhosis, and/or current or past history of clonorchiasis; 149 had a past history of a malignancy; 226 had a past history of cardiovascular disease; 2,107 were receiving medication for lipid-lowering agents; 4,479 had an alcohol intake of ≥ 20 g/day; 2,002 had elevated γ-glutamyltransferase (GGT) levels (> 100 U/L); 375 had elevated alanine aminotransferase (ALT) levels (> 100 U/L) and 6,245 were diagnosed as baseline abdominal obesity (WC > 90 cm) at initial examinations. The total number of eligible participants was 15,927. We further excluded 4,715 participants who did not attend any follow-up visit between 2006 and 2010. Without the follow-up visit, we could not identify the development of abdominal obesity and also calculate the individual person year. Eventually, 11,212 participants were enrolled in the final analysis and observed for the development of obesity (Fig. 1). The total follow-up period was 39,399.1 person year and average follow-up period was 3.51 (standard deviation [SD], 1.53) person year.
Clinical and laboratory measurements
Study data included a medical history, a physical examination, information provided by a questionnaire, anthropometric measurements and laboratory measurements. The medical and drug prescription history were assessed by the examining physicians. All the participants were asked to respond to a health-related behavior questionnaire, which included the topics of alcohol consumption, smoking and exercise. The questions about alcohol intake included the frequency of alcohol consumption on a weekly basis and the typical amount that was consumed on a daily basis (≥ 20 g/day). In addition, the participants were asked about their weekly frequency, amount and duration of exercise to evaluate status of their physical activity. Participants taking exercise such as jogging, bicycling, and swimming that lasted long enough to produce perspiration (≥ 1 time/week) were regarded as people with regular exercise.
Anthropometric measurements and procedures for blood tests including biochemical analysis, lipid profiles, and immunoradiometric assay were described in detail elsewhere (9).
The diagnosis of chronic liver disease, fatty liver and its degree were based on the results of abdominal US with a 3.5-MHz transducer (Logic Q700 MR, GE, Milwaukee, USA). Abdominal US were carried out by eleven experienced radiologists who were unaware of the aims of the study and blind to the laboratory values.
Findings meet one of following criteria.
1) Coarse or highly non-homogenous liver parenchymal echotexture
2) Irregular or nodular liver surface (inferior margin of right lobe)
3) Blunted or rounded liver edge
4) Enlarged liver size (> 15 cm in mid-clavicular line) or Shrinken liver size (< 10 cm in mid-clavicular line)
5) Enlarged spleen size (> 13 cm)
The degree of hepatic fatty infiltration was evaluated by quantitative grading system conventionally used in radiologic field (121314) as follows:
Normal (grade 0): Hepatic parenchymal echogenicity is usually equal to that of the renal cortex.
Mild fatty liver (grade 1): diffuse slight increase in fine echoes in the hepatic parenchyma with normal visualization of the diaphragm and intrahepatic vessel borders.
Moderate fatty liver (grade 2): moderate diffuse increase in fine echoes with slightly impaired visualization of the intrahepatic vessels and diaphragm.
Severe fatty liver (grade 3): marked increase in fine echoes with poor or no visualization of the intrahepatic vessel borders, diaphragm and posterior portion of the right lobe of the liver.
The WC was measured in the standing position, at the level of umbilicus by a single examiner, and WC > 90 cm was defined as abdominal obesity according to the recommendation suggested by joint interim statement of the International Diabetes Federation Task Force on Epidemiology and Prevention (15).
Statistical analyses
Data were expressed as means ± (standard deviation) or medians (interquartile range) for continuous variables and percentages of the number for categorical variables.
The one-way ANOVA and χ2-test were used to analyze the statistical differences among the characteristics of the study participants at the time of enrollment in relation to the NAFLD categories. Categories of the NAFLD comprised the following: normal, mild, moderate and severe. Moderate (n = 133, 1.19%) and severe NAFLD (n = 1, 0.01%) was combined into moderate to severe NAFLD category for analyses, owing to the small number of severe NAFLD. The distributions of continuous variables were evaluated, and log transformations were used in the analysis as required.
For incident abdominal obesity cases, the time of abdominal obesity occurrence was assumed to be the midpoint between the visit at which abdominal obesity was first diagnosed and the baseline visit (2005). The person years were calculated as the sum of follow-up times from the baseline until an assumed time of abdominal obesity development or until the final examination of each individual. We used Cox proportional hazards models to estimate adjusted hazard ratios (HRs) and 95% confidence intervals (CI) for incident abdominal obesity comparing the mild and moderate to severe NAFLD categories vs. the normal group. The data were adjusted, first for age alone, then for the multiple covariates. In the multivariate models, we included variables that might confound the relationship between the NAFLD and abdominal obesity, which include: age, baseline WC, total cholesterol, log(hsCRP), HOMA-IR, eGFR, current smoking status, regular exercise, hypertension and diabetes mellitus. The change level of WC was calculated by following formula: WC on censoring time – baseline WC. The average change of WC was compared among 3 groups (normal, mild and moderate to severe NAFLD groups) by one-way ANOVA and χ2-test. P values < 0.05 were considered to be statistically significant. Statistical analyses were performed PASW Statistics 18 (SPSS Inc., Chicago, IL, USA).
Ethics statement
Ethics approvals for the study protocol and analysis of the data were obtained from the institutional review board of Kangbuk Samsung Hospital (KBC12060). The informed consent requirement was exempted from the institutional review board because the researchers only retrospectively accessed a de-identified database for analytical purposes.
RESULTS
During 39,399.1 person-years of follow-up, 1,740 (15.5%) incident cases of abdominal obesity developed between 2006 and 2010. While 11,212 enrolled study participants were comprised of 8,160 normal group (72.7%), 2,918 mild fatty liver group (26.0%) and 134 moderate to severe fatty liver group (1.1%), 4,715 excluded people for follow-up loss were comprised of 3,473 normal group (73.7%), 1,194 mild fatty liver group (25.3%) and 48 moderate to severe group (1.01%).
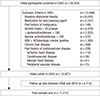
The baseline characteristics of the study participants in relation to the NAFLD categories are presented in Table 1. At baseline, the mean (SD) age and WC of study participants were 44.3 (7.7) years and 81.1 (5.7) cm, respectively. There were clear dose response relationships between all of the listed variables and NAFLD categories except for age.
Table 1
Baseline characteristics of participants according to the categories of non-alcoholic fatty liver disease (n = 11,212)
Data are means (standard deviation), medians (interquartile range), or percentages. BMI, body mass index; WC, waist circumference; BP, blood pressure; HDL, high-density lipoprotein; LDL, low-density lipoprotein; HOMA-IR, homeostasis model assessment of insulin resistance; SCr, serum creatinine; eGFR, estimated glomerular filtration rate; hsCRP, high-sensitivity C-reactive protein; AST, aspartate aminotransferase; ALT, alanine aminotransferase; GGT, γ-glutamyltransferase.
![]()
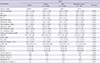
In contrast to participants without incident abdominal obesity, those with incident abdominal obesity were slightly older (45.3 vs. 44.1) and generally had less favorable metabolic profiles at baseline (Table 2).
Table 2
Comparison of baseline characteristics between participants with and without incident abdominal obesity
Data are expressed as means (standard deviation) or percentages. *P value by t-test for continuous variables and χ2 test for categorical variables. BMI, body mass index; WC, waist circumference; BP, blood pressure; HDL, high-density lipoprotein; LDL, low-density lipoprotein; HOMA-IR, homeostasis model assessment of insulin resistance; SCr, serum creatinine; eGFR, estimated glomerular filtration rate; hsCRP, high-sensitivity C-reactive protein; AST, aspartate aminotransferase; ALT, alanine aminotransferase; GGT, γ-glutamyltransferase.
![]()
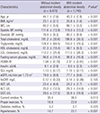
Table 3 shows the hazard ratios and 95% confidence interval for incident abdominal obesity according to the NAFLD categories. In the unadjusted model, the hazard ratios and 95% confidence interval for incident abdominal obesity comparing mild to moderate and severe NAFLD to normal NAFLD were 2.34 (2.12-2.57) and 4.19 (3.19-5.50), respectively (P for trend < 0.001). After adjustments for covariates in model 1 and 2, this association was attenuated in mild NAFLD group, but still maintained statistically significant (P for trend < 0.001). In Cox proportional hazards models adjusting for age, baseline WC, total cholesterol, log(hsCRP), HOMA-IR, eGFR, current smoking status, regular exercise, hypertension and diabetes mellitus (model 2), the adjusted hazard ratios and 95% confidence interval for incident obesity were 1.07 (0.94-1.23) and 1.58 (1.11-2.26), respectively (P for trend < 0.001). Subgroup analysis by age (< 45 and ≥ 45 years) also showed the similar trend of association between the degree of NAFLD and the incidence of obesity (Supplementary Tables 1 and 2). The average and overall change level of WC during follow-up was evaluated for all study participants and people with incident obesity (Table 4). The average change level of WC increased in proportion to the degree of NAFLD in all study participants and people with incident obesity.
Table 3
Hazard ratios and 95% confidence intervals for the incidence of abdominal obesity according to categories of non-alcoholic fatty liver diseases

Model 1 was adjusted for age, baseline WC, total cholesterol, log(hsCRP), HOMA-IR and eGFR. Model 2 was adjusted for model 1 plus recent smoking status, regular exercise, hypertension and diabetes mellitus. NAFLD, non-alcoholic fatty liver disease; WC, waist circumference; hsCRP, high-sensitivity C-reactive protein; HOMA-IR, homeostasis model assessment of insulin resistance; eGFR, estimated glomerular filtration rate.
![]()
Table 4-1
Average change level of waist circumference (WC) in all study participants

WC (waist circumference) change was calculated by as follows: WC on censoring time – baseline WC. NAFLD, non-alcoholic fatty liver disease.
![]()
Table 4-2
Average change level of waist circumference (WC) in people with incident obesity

WC (waist circumference) change was calculated by as follows: WC on censoring time – baseline WC. NAFLD, non-alcoholic fatty liver disease.
![]()
DISCUSSION
Up to the present, there have been a lot of studies regarding causative factors for NAFLD. Out of them, abdominal obesity was known to be one of the most significant factors. Nonetheless, there was scarce information about the effect of NAFLD on the development of abdominal obesity. In this study, incidence and risk of abdominal obesity increased proportionally to the degree of NAFLD, even after adjusting for multiple covariates. Therefore, these findings could be the significant clinical background for the previous studies demonstrating the higher prevalence of adult disease under NAFLD. In short, as NAFLD patients are vulnerable to abdominal obesity, risk for diseases related to abdominal obesity may also increase in NAFLD patients.
Comparing our study findings with those of previous studies, we could see an interesting fact. Mean baseline WC of every group, even if less than 90 cm, cut-off value of central obesity, was in proportion to the degree of NAFLD. Baseline mean value of HOMA-IR, indicator of insulin resistance, also increased with the same tendency of WC. These findings agree well with the previous reports showing metabolic factors associated with the development and progression of NAFLD (161718). In addition, mean baseline metabolic factors associated with NAFLD were more unfavorable in more progressed NAFLD group. Therefore, it was undoubted that various deleterious metabolic conditions interactively contributed to the development of NAFLD. Nonetheless, to the best of our knowledge, there was no study showing that NAFLD induced by these factors increased the risk for abdominal obesity in proportion to the degree of NAFLD. Accordingly, our study findings imply that NAFLD developed by some deleterious conditions can induce abdominal obesity through its independent action.
The mechanism of our study finding is not necessarily matched up with that of previous studies, because there is no report corresponding to ours. However, several theories could be suggested. One of the most probable theories is elevated insulin level associated with insulin resistance. As well known, insulin resistance plays a core role in the development and progression of NAFLD, and hyperinsulinemia is a definite clinical manifestation of insulin resistance. Previous studies showed that elevated insulin level could cause obesity. Johnson et al reported that hyperinsulinemia drove a diet-induced obesity independently of brain insulin production (19), and clinical studies showed that long term insulin therapy could induce weight gain (2021). Our study also showed that baseline insulin levels were elevated in proportion to the severity of NAFLD. Accordingly, hyperinsulinemia associated with insulin resistance might play a significant role in the development of obesity.
When interpreting our results, some limitations should be considered. First, bias from follow-up loss may have affected our results. Participants not included in analysis (n = 4,715) were older and had less favorable metabolic profiles at baseline than those in analytic cohort. Thus, this follow-up loss of high-risk people would probably lead to a conservative bias and subsequent underestimation of risk.
Second is the methodological limitation for the diagnosing NAFLD. In this study, the presence of NAFLD was assessed by US instead of pathologic method. Although US is regarded reasonable and accurate in detecting NAFLD, it cannot identify fatty infiltration of the liver below the threshold of 30% (22). Therefore, there might have been possibility of discrepancy between ultrasonographic finding and real NAFLD. Nonetheless, it was inappropriate to perform invasive test in a population based epidemiological study (23). Additionally, US is a widely used and acceptable modality for diagnosis of NAFLD with high sensitivity (82%-94%) and specificity (66%-95%) (242526). Particularly, all examinations were carried out by experienced radiologists using widely established methods and criteria. Thus, despite this limitation, US might be clinically reasonable and proper modality to diagnose NAFLD in this study.
In conclusion, our study indicated that the risk of abdominal obesity independently increased according to the degree of NAFLD. These findings suggest the clinical significance of NAFLD as an early predictor for abdominal obesity. Therefore, further studies should be conducted to clarify the more correct relationship between NAFLD and abdominal obesity.
 XML Download