

 PDF
PDF ePub
ePub Citation
 Print
Print


INTRODUCTION
Cancer stem cells (CSCs) are a subset of cells within a tumor that have the ability to initiate tumor formation and induce metastasis. Recently, CSCs have emerged as a pivotal therapeutic target to slow the progress of cancer (1) because CSC associated drug resistance is thought to be main reason for relapse (23).
Colorectal cancer (CRC) is one of the leading cause of cancer-related deaths (4) and also contains CSCs (5), which are identified by the cell surface marker CD133 and have tumorigenic ability in immunodeficiency mice. Tumorigenic colon cancer cells included the rare undifferentiated population that expresses CD133 (67). Various results of studies indicate that CD133 positivity correlates to tumor aggressiveness, metastasis, and resistance to chemotherapy and radiotherapy (3).
In addition, although there are many therapeutic methods targeted for CSCs, the possible way is to induce differentiation of CSCs. Because non-CSCs are targeted very effectively by chemotherapeutic agents, it is believed that differentiated cells have limited proliferative potential and lose the capacity for self-renewal and tumorigenicity (8).
The phosphatidylinositol 3-kinase (PI3K) and mammalian target of rapamycin (mTOR) pathway regulates multiple cellular processes to promote cancer cell growth, survival, and metastasis (91011). Lots of inhibitors for PI3K and/or mTOR pathway was developed and several inhibitors among them has anti-cancer effect in preclinical and clinical studies (12). Several studies have suggested the association of the PI3K and mTOR pathway with colon tumorigenesis (1314).
We hypothesized that PI3K and mTOR pathway may play a role of tumor progression and relapse related to colorectal CSCs. We used SW620 cell line possessing CD133 expressing colorectal CSCs. After isolating CD133+ and CD133– colorectal cancer cells, PI3K and/or mTOR signal of sorted cells were blocked by using inhibitors. We investigated differential status, drug sensitivity, and tumorigenecity of inhibited colorectal CSCs in vitro and in vivo. Here, we show dual-blocking of PI3K and mTOR pathway more effectively enhances drug sensitivity by inducing differentiation and suppresses tumor growth.
MATERIALS AND METHODS
Cell culture
The SW620 human colorectal cancer cell line was purchased from the Korean cell line bank (Seoul, Korea). SW620 cells were cultured in RPMI 1640 (GIBCO-Life Technologies, Carlsbad, CA, USA) with 2.05 mM glucose, 25 mM HEPES, 10% fetal bovine serum (FBS), penicillin (100 U/mL), and streptomycin (100 µg/mL) in a humidified 5% CO2 incubator at 37℃. When cell confluence reached 80%, cells were detached using 0.05% trypsin and 0.53 mM EDTA.
Fluorescence activated cell sorting (FACS)
Cells were labeled with primary CD133/1-PE antibody (Miltenyi Biotec, San Diego, CA, USA). All procedures were performed according to the manufacturer’s instructions. Cells were sorted using a BD FACS system (BD Biosciences, Franklin Lakes, NJ, USA). Data were analyzed by BD FACSAria™ software (BD Biosciences), which was provided with the system.
Drug treatment
SW620 cells were treated with 100 nM rapamycin (Merck, Kenilworth, NJ, USA) for 48 hours, 50 µM LY294002 (Merck) for 48 hours, and 100 nM NVP-BEZ235 (Axon Medchem, Reston, VA, USA) for 24 hours to block both mTOR and PI3K, respectively. Paclitaxel (anti-cancer drug, Sigma, St Louis, MO, USA) treated with 100 nM for 24 hours to SW620 after inhibitors treatment.
RNA isolation and semi-quantitative RT-PCR
RT-PCR was performed according to methods established as described in Choi et al. (15). Total RNA was isolated using 1 mL of TRIzol (Invitrogen, Carlsbad, CA). Subsequently, 200 μL of chloroform was added and the solution was mixed and incubated for 10 minutes. After centrifugation at 12,000 rpm and 4℃ for 15 minutes, the upper phase was transferred to a new tube and 500 μL of isopropanol was added. After an incubation period of 10 min and another centrifugation step of 15 minutes at 12,000 rpm and 4℃, the supernatant was discarded. The pellet was washed with 1 mL of 75% ethanol/DEPC-water and centrifuged at 4℃ for 5 minutes. The supernatant was discarded, and the pellet was dried. After addition of 10 μL of DEPC-water, the pellet was dissolved on ice for 10 min. The amount and purity of the total RNA were determined at the absorbance wavelengths of 260 nm and 280 nm using a spectrophotometer. cDNAs were synthesized by the Superscript III First Strand Synthesis system (Invitrogen) in accordance with the manufacturer’s protocols. cDNA synthesis is performed in the first step using total RNA primed with oligo (dT). Primers for PCR were purchased from Cosmogenetech (Seoul, Korea). The target regions were amplified in 15 mL volume using following schedule. All PCR techniques were conducted in 28-39 cycles. The PCR products were separated via electrophoresis in 2% agarose gel, and then the product bands were imaged and detected using an EtBr system with BioRad Molecular Imager® GelDoc™ XR. For all RT-PCR analysis, β-Actin was used as a loading control. The primers used in this study are listed in Table 1. The data of RT-PCR was quantified by ImageJ software (1.48v, National Institue of Health, Bethesda, MA, USA).
Table 1
RT-PCR Primers used in this study
![]()
Cell viability assay
To check cell viability, we used Cell Counting Kit-8 (CCK-8; Dojindo Molecular Technologies, Inc., Kumamoto, Japan). The cells were seeded at 1 × 10⁴ cells/well in 96-well microplates and allowed to attach for 24 hours. After inhibitors and anti-cancer drug treatment, cell viability was assessed by CCK-8. Three replicate wells were used for each experimental condition.
Immunofluorescence analysis (IF)
Cells were grown on glass cover slips and fixed with 4% paraformaldehyde (Fluka Chemie AG, Buchs, Switzerland) in PBS for 10 minutes. The cells were permeabilized by immersion in 0.25% Triton X-100 in PBS for 10 minutes. The cells were incubated with 1% BSA at room temperature for 1 hour to block nonspecific binding of the antibodies. Staining was performed by 1:200 dilution of mouse anti-CD133 antibody (Miltenyi Biotec, San Diego, CA, USA) and 1:200 dilution of mouse anti-CEA antibody (Abcam, Cambridge, MA, USA) in 1% BSA/PBS for 1 hour, followed by 1:200 dilution of Alexa Flour 594-conjugated goat anti-mouse antibody (red) and FITC-conjugated rabbit anti-mouse antibody (green) with three washes in cold PBS. Subsequently, the cells were stained with 4',6-diamidino-2-phenylindole (DAPI, Sigma, St. Louis, MO, USA). After an additional three washes in cold PBS, the cells were mounted and viewed using confocal laser scanning microscope, LSM 700 (Carl-Zeiss, Jena, Germany). Each experimental condition was conducted in triplicate. CTCF (Corrected Total Cell Fluorescence) was measured by ImageJ software (1.48v, National Institue of Health).
Sphere formation assay
Cells were plated at 1 × 10³ cells/well in 6-well ultra-low attachment plates (Corning Inc. Corning, NY, USA). Cell were cultured with serum-free RPMI 1640 (Gibco-Invitrogen, Carlsbad, CA, USA) supplemented with 10 ng/mL fibroblast growth factor (R&D Systems, Minneapolis, MN, USA), 10 ng/mL epidermal growth factor (R&D Systems), and 2.75 ng/mL selenium (insulin-transferrin-selenium solution; Invitrogen). At day 5, spheres larger than 100 µm were counted.
In vivo xenograft tumorigenecity assay
Four-week-old male Balb/c nude mice were obtained from OrientBio (Seongnam, Korea). The mice were maintained under standard conditions and cared for according to the institutional guidelines for animal care. The animal studies were performed after receiving approval of the Institutional Animal Care and Use Committee (IACUC) in Korea University (KUIACUC approval No. KUIACUC-2014-99). The number of used mice per every group was eight. For xenograft tumorigenecity assay, 1 × 10⁶ SW620 cells were sorted for CD133+ cells and treated with inhibitors. The cells were suspended in 100 µL PBS/Matrigel (BD Biosciences) (1:1). The left flank of Balb/c nude mice was injected with untreated CD133+ cells, while the right flank was injected with CD133+ cells treated with each inhibitor. Tumor formation was monitored once a week (before paclitaxel treatment) and every 4 days (after paclitaxel treatment). The mice were intraperitoneally injected with 10 mg/kg paclitaxel. After 44 days, all mice were sacrificed, and the tumor volume was measured by using digital caliper measurements. Tumor volume was calculated using the formula: v (mm3) = (a2 ×b)/2, with a being the smallest diameter and b the largest.
RESULTS
Stemness properties of SW620 CD133+ cells
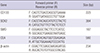
The SW620 human colorectal cancer cell line was sorted into CD133+ cells and CD133– cells using an anti-CD133–PE antibody and FACS. CD133+ and CD133– cells have different properties with respect to stemness and differentiation (Fig. 1). Fig. 1A shows mRNA expression of stemness (CD133, SOX2, and SMO) and differentiation markers (CEA). For comparisons, relative values for CD133– cells were considered to be “1”. CD133, SOX2, and SMO expression levels (fold) in CD133+ cells were “16 ± 0.07”, “4 ± 0.02”, and “7 ± 0.12” (P < 0.001) which showed CD133+ cells have higher mRNA expression levels of stemness markers than CD133– cells. On the other hands, CEA, differentiation marker, was significantly reduced in CD133+ cells by one third (its value was “0.32 ± 0.01”) (P < 0.001). A sphere formation assay was carried out to determine the self-renewal ability (16) of SW620 CD133+ cells (Fig. 1B). The number of spheres of SW620 CD133+ cells was “40 ± 3.6” which is at least 7-fold higher than that of CD133– cells (5 ± 2.5) (P < 0.001). Taken together, these results indicated that SW620 CD133+ cells were successfully isolated and had stemness properties including self-renewal ability.
 | Fig. 1Stemness properties of sorted SW620 CD133+ cells. (A) The mRNA expression of stemness and differentiation marker in SW620 CD133+ and CD133–cells were measured by RT-PCR. β-Actin was used as a loading control. For comparisons, the relative value for markers of CD133–cells was considered to be “1”. (B) Self-renewal ability of sorted cells was analyzed by sphere formation assay. Pictures were taken at ×40 magnification. Scale bar = 100 µm. Data are expressed as the mean ± standard error of the mean (SEM) of three independent experiments performed (*P < 0.001).
|
Differentiation induction of SW620 CD133+ cells by dual-inhibition of PI3K and mTOR
To investigate differentiation of SW620 cells by blocking PI3K and/or mTOR pathway, expression of stemness and differentiation markers were assessed by using RT-PCR and immunofluorescence assay (IF). LY294002 (PI3K inhibitor), rapamycin (mTOR inhibitor), and NVP-BEZ235 (dual-inhibior of PI3K and mTOR) were used as inhibitors. To determine treating concentration of inhibitors cell viability was assessed (Supplementary Fig. 1). We choose the concentration which showed 50% cell viability. Rapamycin (Supplementary Fig. 1A) was treated at concentrations of 10, 50, 100 and 200 nM for 24 or 48 hours, respectively. At 100 nM for 48 hours, cell number was decreased from 10,000 to 6,500. LY294002 (Supplementary Fig. 1B) was treated concentration of 5, 10, 20, and 50 μM for 24 or 48 hours. Cell number after treatment with LY294002 at 50 μM for 48 hours decreased from 10,000 to 5,000. NVP-BEZ235 (Supplementary Fig. 1C) was treated at concentrations of 10, 100, 500 nM and 1 μM for 24 or 48 hours. It was more effective when treated for 24 hours, which was shorter than rapamycin and LY294002. Cell number was decreased from 4,000 to 2,000 at 100 nM for 24 hours. To summarize, SW620 cells were treated with 100 nM rapamycin for 48 hours, 50 μM LY294002 for 48 hours, and 100 nM NVP-BEZ235 for 24 hours to block mTOR, and/or PI3K pathway, respectively.
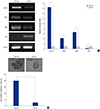
Fig. 2A shows the mRNA expression levels of stemness and differentiation markers in CD133+ and CD133– SW620 cells after inhibition of PI3K and/or mTOR. CD133, SOX2, and SMO are stemness markers, while CEA is a differentiation marker of colorectal cancer cells. For comparisons in the present study, relative intensity for stemness and differentiation markers of DMSO-treated CD133+ cells were defined as “1”. CD133 expression levels in both single-blocker and dual-blocker treated groups were decreased. The value of rapamycin and LY294002-treated CD133+ cells were “0.79 ± 0.057” and “0.72 ± 0.01”, respectively (P < 0.001). In particular the relative intensity of CD133 in NVP-BEZ235 treated CD133+ cells was “0.29 ± 0.01” (P < 0.001) which is the lowest value. SOX2 and SMO expression level were also significantly decreased in dual-blocked cells. SOX2 value of rapamycin, LY294002 and NVP-BEZ235 was “0.44 ± 0.006”, “0.48 ± 0.009”, and “0.30 ± 0.075”, respectively (P < 0.001). SMO expression level was almost not changed in single-blockage groups (rapamycin: “1.02 ± 0.003” and LY294002: “0.99 ± 0.003”). However, in dual-inhibited cells, SMO expression level was significantly decreased (0.85 ± 0.082) (P < 0.001). CEA, differentiation marker, was up-regulated at least 4-fold by three inhibitors. Interestingly, dual-blocked CD133+ cells had the highest expression level of CEA, “4.77 ± 0.075” (P < 0.001). The CEA value of rapamycin and LY294002 was “4.1 ± 0.004” and “4.47 ± 0.007”, respectively (P < 0.001). Taken together, in dual-blocked CD133+ cells using NVP-BEZ235, differentiation marker was most significantly up-regulated and stemness markers were down-regulated.
| Fig. 2Stemness and differentation properties of PI3K and/or mTOR inhibitors treated SW620 CD133+ cells. (A) The mRNA expression of stemness and differentiation markers after inhibition of PI3K and/or mTOR was measured by RT-PCR. β-Actin was used as a loading control. For comparisons, relative intensity for markers of DMSO-treated CD133+ cells was defined as “1”. *P < 0.001. (B) The protein expression of CD133 was measured by Immunofluorescence assay (IF). CD133 was stained in red. (C) The protein expression of CEA was measured by IF. CEA were stained in green, respectively. In each experiment (B and C), the nuclei were counterstained with DAPI (blue). For comparisons, relative intensity of Corrected Total Cell Fluorescence (CTCF) for CD133 and CEA of DMSO-treated CD133+ cells was defined as “1”. Data are expressed as the mean ± standard error of the mean (SEM) of three independent experiments performed (*P < 0.001, “N/S” means “statistically not significant”). Pictures were taken at ×400 magnification. Scale bar = 10 μm.
|
Fig. 2B and 2C showed CD133 and CEA protein expression patterns in SW620 CD133+ cells after PI3K and/or mTOR inhibition, respectively. As shown in Fig. 2B, CD133 (red) was highly expressed in CD133+ cells, whereas there was little or no expression in CD133– cells. After inhibitor treatment, CD133 signal was decreased in CD133+ cells, while inhibitors did not affect CD133 expression in CD133– cells. The blue staining for nuclei (DAPI) remained unchanged. For comparisons, relative intensity of CTCF (Corrected Total Cell Fluorescence) for CD133 of DMSO-treated CD133+ cells was defined as “1”. The value for CD133 in rapamycin- and LY294002-treated CD133+ cells were “0.16 ± 0.023” and “0.26 ± 0.026”, respectively (P < 0.001). Especially, the value for CD133 of NVP-BEZ235 was “0.11 ± 0.015” which was the lowest one (P < 0.001). Thus, stemness protein (CD133) was most significantly down-regulated by dual-blocker (NVP-BEZ235) compared to single-blockage groups.
As shown in Fig. 2C, CEA (green) was highly expressed in CD133– cells but was rarely expressed in CD133+ cells. After inhibition, CEA was up-regulated in CD133+ cells and was not changed in CD133– cells. For the purpose of comparison, relative intensity of CTCF for CEA of DMSO-treated CD133+ cells was defined as “1”. The relative intensity of CEA in rapamycin, LY294002, and NVP-BEZ235 treated CD133+ cells was “15.98 ± 2.431”, “9.74 ± 1.058”, and “19.02 ± 1.532”, respectively (P < 0.001). Thus, these results indicated that dual-blocking most significantly up-regulated expression of differentiation marker (CEA) by 19-fold.
Therefore we concluded that dual-inhibition of PI3K and mTOR most effectively induced differentiation of colorectal CSCs and suppressed their stemness properties.
Drug sensitivity change in differentiated SW620 CD133+ cells by dual-inhibition
Fig. 3 shows drug sensitivity properties of differentiated CSCs by inhibition of PI3K and mTOR. Paclitaxel was used as an anti-cancer drug and treated at 100 nM for 24 hours. To determine the point in which SW620 CD133+ cells showed less drug sensitivity, cells were treated with paclitaxel for 24, 48 and 72 hours with concentrations of 0, 5, 10, 20, 50, 100, 200, 400 and 800 nM (Supplementary Fig. 2A). Since the resistant cells would show high viability even in high concentrations of the drugs we tried to find the point in which cells lost sensitivity. For paclitaxel the point of decreased cell sensitivity was 100 nM for 24 hours. At 100 nM for 24 hours paclitaxel cell number was decreased from 4,500 to 3,200 while at 50 nM cell number was decreased from 4,500 to 2,000 (Supplementary Fig. 2B).
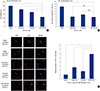 | Fig. 3The drug sensitivity of inhibited SW620 CD133+ cells. (A) Inhibited SW620 CD133+ cells were treated with paclitaxel (100 nM) for 24 hours and cell viability was assessed by CCK-8 assay. For comparisons cell viability of DMSO treated CD133+ cells was 100%. (B) Self-renewal ability of inhibited SW620 CD133+ cells treated with paclitaxel and self-renewal ability was assessed by sphere formation assay. (C) Differentiation marker (CEA) expression of inhibited CSCs treated with paclitaxel. The protein expression of CEA was assessed by IF. For the comparison, relative intensity of CTCF for CEA of DMSO treated CD133+ cells was defined as “1”. All data are expressed as the mean ± standard error of the mean (SEM) of three independent experiments performed (*P < 0.05, †P < 0.01, ‡P < 0.001, “N/S” means “statistically not significant”). Pictures were taken at ×400 magnification. Scale bar = 10 μm.
|
Cell viability assay was carried out to measure the effect of chemotherapy in SW620 CD133+ cells. As shown in Fig. 3A, CSCs treated with DMSO were used as a control group and on standard of 100% cell viability to compare with each other. When paclitaxel was treated, cell viability of inhibitor-treated groups was lower than that of DMSO-treated group. Rapamycin-treated CD133+ cells (CSCs) had 83% ± 5.7% viability (P < 0.01) while LY294002-treated cells had 70% ± 3.7% viability (P < 0.01). In particular, NVP-BEZ235-treated cells had 46 ± 9% viability (P < 0.001 and P < 0.01) which is the lowest viability compared to single-blockage groups. In other words dual-blocking most effectively induced cell death by anti-cancer drug in CD133+ cells.
The sphere formation assay was carried out to assess self-renewal ability of differentiated CSCs treated with paclitaxel (Fig. 3B). The sphere number of control group (DMSO) was “16 ± 2”. The value of single blockage groups was “8 ± 1” (rapamycin) and “9.67 ± 0.7” (LY294002). Interestingly, dual-blockage group (NVP-BEZ235) had the lowest number of spheres “7.67 ± 0.3”. Thus, self-renewal capacity of dual-inhibited CSCs after anti-cancer drug treatment was most decreased.
The strongest expression of CEA, differentiation marker, was also observed in CD133+ cells treated with paclitaxel after the dual-blocker NVP-BEZ235 treatment by IF (Fig. 3C). For the comparison, relative intensity of CTCF for DMSO-treated CD133+ cells was defined as “1”. The value for CEA in rapamycin-, LY294002-, and NVP-BEZ235-treated CD133+ cells were “2.74 ± 0.39” (P < 0.05), “1.81 ± 0.2” (P < 0.01), and “5.91 ± 0.98” (P < 0.01 and P < 0.05), respectively. Thus, the combination of dual-inhibition and paclitaxel most significantly promotes differentiation in CD133+ cells.
Taken together, differentiated CD133+ SW620 cells by dual-inhibitor had most effectively enhanced sensitivity for anti-cancer drug in aspects of cell viability, self-renewal ability, and differentiation properties.
Tumor growth and the sensitivity to the anti-cancer drug by dual-blocking of PI3K and mTOR
Sorted SW620 CD133+ cells were untreated or treated with DMSO, rapamycin, LY294002, or NVP-BEZ235. CD133+ cells treated with each inhibitor were injected to the right flank of Balb/c nude mice while untreated CD133+ cells was injected to the left flank. As shown in Fig. 4A, tumor volumes in the NVP-BEZ235 group were the smallest among other groups. PBS means PBS injection without CD133+ cells and was used as a negative control.
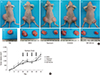 | Fig. 4Xenograft tumorigenecity assay of inhibitors treated SW620 CD133+ cells before and after injection of anti-cancer drug. (A) Comparison of tumorigenecity of inhibitor treated SW620 CD133+ cells in BALB/c nude mice. Balb/c nude mice were subcutaneously injected with sorted SW620 CD133+ cells. The left flank was injected with untreated CD133+ cells, while the right flank was injected with CD133+ cells treated with each inhibitor. Anti-cancer drug (paclitaxel) was injected since 28 days. (B) Tumor volume (mm3) of xenografts from Balb/c mice. The change in tumor volume was checked for each group. DMSO treated group was used as a control. Data are expressed as the mean ± standard error of the mean (SEM) of mice for each group.
|
Fig. 4B shows the change in tumor volume (mm3) of mice monitored after injection of inhibitor-treated CD133+ cells. Before anti-cancer drug (paclitaxel) treatment the tumor volume was measured every 7 days. As shown in Fig. 3B, NVP-BEZ235-treated group had the smallest tumor compared to DMSO-, rapamycin-, and LY294002-treated groups both before and after anti-cancer drug paclitaxel treatment. Before paclitaxel injection, the tumor volume of NVP-BEZ235 group was the smallest of all groups. In particular, on 28 days, the tumor volume (mm3) of dual-blockage group was “699 ± 153” which was the smallest tumor compared to DMSO-, rapamycin-, and LY294002-treated groups (1048 ± 89, 717 ± 124 and 822 ± 71). On other days (7 days, 14 days, and 21 days) NVP-BEZ235 group had the smallest tumor, too.
From 28 days to 44 days anti-cancer drug (paclitaxel) was injected every 4 days (28, 32, 36 and 40 days). After paclitaxel treatment the tumor of dual-blockage group was still the smallest. In particular, on 44 days, the tumor volume (mm3) of NVP-BEZ235-treated group was “1,229 ± 253”. This value was the lowest one compared to other groups (each tumor volume of DMSO-, rapamycin-, and LY294002-treated group was “1,686 ± 260”, “1,751 ± 203”, and “1,516 ± 93”, respectably). On 32 days and 40 days the tumor of NVP-BEZ235 group was the smallest. These data showed that dual-blocking most effectively suppressed tumor growth and enhanced the sensitivity to chemotherapy in colorectal CSCs in vivo which coincide with in vitro data (Fig. 3).
DISCUSSION
CSCs have stem-like property that self-renewal, metastasis and resistance to chemotherapy and radiation. CSCs are also relevant to colorectal cancer and they have a key role in cancer metastasis and recurrence (717). PI3K and mTOR pathways are relative to tumorigenesis in various tumors including colorectal cancer (181920).
In this study the SW620 human colorectal cancer cell line was sorted into CD133+ and CD133– cells using an anti-CD133–PE antibody and FACS. Sorted SW620 CD133+ cells possessed stemness properties compared to CD133– cells. As shown in Fig. 1A stemness markers (CD133, SOX2, and SMO) was up-regulated and differentiation maker (CEA) was down-regulated in CD133+ cells. In addition, CD133+ cells had higher self-renewal ability, one of stemness properties.
PI3K and mTOR pathways may be related to the tumorigenic characteristics of colorectal cancer (18). Accordingly these pathways became a target for cancer therapy. Inhibitors of PI3K signaling have been suggested as potential therapeutic agents in CRC (2122). LY294002 is a well-known, first generation PI3K inhibitor capable of reversibly targeting PI3K family members (12). Rapamycin, the prototypic mTOR inhibitor, has immunosuppressive properties (23) and anti-neoplastic abilities (24252627). Recent reports suggested that inhibition of mTOR pathway by rapamycin in CRC suppresses tumor formation in mice (28). Recently, several studies reported that dual-inhibition of the PI3K and mTOR pathway is an effective anti-cancer therapy. NVP-BEZ235, a dual-PI3K and mTOR inhibitor, is an imidazoquinazoline derivative that inhibits multiple class I PI3K isoforms and mTOR kinase activity by binding to the ATP-binding pocket (29). Preclinical data indicate that NVP-BEZ235 exerts strong anti-proliferative activity against tumor xenografts featuring abnormal PI3K signaling, including loss-of-function PTEN or gain-of-function PI3K mutations (30). This report coincides with our xenograft tumorigenecity assay (Fig. 4) which shows dual-blocking had the superiority of suppressing tumor growth. Recently another dual-PI3K/mTOR inhibitor (PF-04691502) was introduced. PF-04691502 has an anti-cancer capacity in colorectal CSCs harboring a PIK3CA mutation (31) which also support our present study. Recent study reported that suppression of mTOR pathway reduced tumor size by inducing autophagy dependent cell death (32). In this aspect we could speculate that dual-blocking mTOR and PI3K pathway would affect cell death when reducing tumor volume. For cell death analysis of tumor specimen, immunohistochemistry including TUNEL assay would be useful. If the tumor shrinkage mechanism including cell death would be assessed, tumor reduction effect by dual-blocking will be more clarified.
In several tumors, promoting CSC’s differentiation was suggested as a differentiation therapy to cure cancer. For a quarter of a century, differentiation therapy has been used to treat acute promyelocytic leukemia using all-trans retinoic acid (ATRA), and more recently, the combination of ATRA and arsenic trioxide (ATO) has turned this once fatal disease into a highly curable one. Whether this synergistic therapy preferentially targets leukemia-initiating cells (CSCs) is unclear, but tumor growth would be unsustainable if CSCs were forced to differentiate (8). In breast cancer the possibility of differentiation therapy was introduced. The miR-100 sensitizes breast CSCs to hormonal therapy by inducing cell differentiation (33).
Our results also suggest that targeting of PI3K and mTOR pathway could be a candidate of differentiation therapy approaches. Fig. 2 shows that PI3K and mTOR pathways affected colorectal CSC’s differentiation. For targeting these pathways we blocked them by using three kinds of inhibitors (LY294002, rapamycin, and NVP-BEZ235). We assessed expression of differentiation marker (CEA) and stemness markers (CD133, SOX2, and SMO) in both mRNA (Fig. 2A) and protein level (Fig. 2B and 2C) after inhibition of these pathways. Fig. 2 shows dual-blocked CSCs had most significantly increased differentiation marker and decreased stemness markers. Thus dual-inhibition of PI3K and mTOR effectively promotes differentiation of colorectal CSCs. These data imply that dual-blocking of the PI3K and mTOR pathways can be a crucial target for differentiation therapy.
The chemo- and radio-resistance of cancer stem cells render their clinical management difficulty (343536). Chemotherapy kills most cells in a cancer but it is believed to leave CSCs behind, which might be strongly related to resistance (34). So we speculated altering characters of colorectal CSCs by inducing differentiation would affect their drug sensitivity. Fig. 3 shows differentiated CSCs have increased drug sensitivity properties to anti-cancer drug unlike undifferentiated CSCs which had high resistance to chemotherapy. Differentiated CSCs by dual-inhibiting PI3K and mTOR signals markedly increased drug sensitivity (Fig. 3). After treated with anti-cancer drug (paclitaxel) cell mortality was increased, self-renewal capacity was decreased, and differentiation property was enhanced most significantly in dual-blocked CSCs. Furthermore, dual-blocking most sensitized immunodeficiency mice’s tumor to chemotherapy (Fig. 4). Similar findings were reported in prostate cancer, too. NVP-BEZ235 induced differentiation and decreased the population of CD133+/CD44+ prostate cancer stem cells in vivo (37).
Taken together this study suggests that dual-inhibition of the PI3K and mTOR signaling pathway induces differentiation and improves chemotherapeutic effects on SW620 human colorectal CSCs. Furthermore it could be a potential therapeutic strategy for colorectal cancer. Since this research was only performed in vitro and in vivo, there needs to be proof of its effects in humans.
 XML Download