

 PDF
PDF ePub
ePub Citation
 Print
Print


Middle East respiratory syndrome coronavirus (MERS-CoV) is a betacoronavirus causing a severe acute respiratory infection (1,2). It was first isolated from the sputum of a patient with severe pneumonia in Saudi Arabia in 2012 (3). Since then, 26 countries have reported 1,618 laboratory-confirmed cases of infection with MERS-CoV to the World Health Organization (WHO), including 579 fatalities (4).
The Korean outbreak of MERS-CoV was initiated in May 2015 by a business man returning from the Middle East (5). The transmission of MERS-CoV continued until early July, resulting in 186 cases with 38 deaths. One of the most important characteristics of the Korean outbreak was 4 large clusters of cases due to superspreading event at hospitals, accounting for > 80% of the total cases. Another characteristic was that many cases of second- and third-generation of transmission occurred (5,6). This finding is quite contrast to the previous studies suggesting limited person-to-person transmissibility of MERS-CoV (7,8). To better understand transmissibility and assess epidemic risk, characterization of MERS-CoV of the Korean outbreak would be of paramount importance (9). Here, we report the MERS-CoV isolated from a patient of the Korean outbreak.
A 39-year-old healthcare worker was admitted to the hospital because of fever and cough. On May 27, 2015, he was unknowingly exposed to the index case (designated as patient number 14 by Korea Ministry of Health and Welfare) of the hospital outbreak of Middle East respiratory syndrome coronavirus (MERS-CoV) at emergency department of a hospital (10). Two days later, he developed fever and dry cough. On June 2, he was diagnosed with MERS-CoV infection as sputum sample was positive on real-time reverse transcriptase polymerase chain reaction (RT-PCR) assay, and admitted to the isolation unit of the MERS-designated hospital by the government.
He had a history of cough variant asthma, but did not take any regular medication, and otherwise healthy. On admission (June 2, 2015), the physical examination revealed a body temperature of 38.8°C, a respiratory rate of 22 breaths per minute, a pulse of 78 per minute, and a blood pressure of 118/71 mmHg. Chest radiography showed patchy consolidation in the upper zone of the left lung. His pneumonia progressed, and on June 8, he developed shortness of breath, his arterial oxygen saturation decreased below 90%, requiring oxygen supplementation, and chest radiography showed multiple consolidations in the both lungs. On June 10, he was intubated and mechanical ventilation was started. His hypoxemia worsened rapidly, and veno-venous extracorporeal membrane oxygenation support was started since June 11. On July 2 (day 35 of his illness), real-time RT-PCR for MERS-CoV turned negative, and was removed from the isolation unit. He recovered gradually.
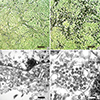
The patient’s oropharyngeal samples were obtained by using UTMTM kit containing 3 mL of viral transport media (Copan Diagnostics Inc., Murrieta, CA). The samples were stored at -70°C until assays. We inoculated monolayers of Vero cells with the samples and cultured the cells at 37°C in a 5% carbon dioxide atmosphere. Cytopathic effects consisting of rounding and detachment of cells were observed 3 days after the inoculation of the sample taken on day 11 of his illness (Fig. 1A and B). The RNA titer in the sample was 5.80 × 10⁷ copies/mL for upE gene and 4.97 × 10⁷ copies/mL for ORF1a gene.
In order to observe virus particles, Vero cell monolayer showing the cytopathic effects was fixed as previously described (11). It was cut on ultramicrotome (RMC MT-XL) at 65 nm. Ultrathin sections were stained with saturated 4% uranyl acetate and 4% lead citrate before examination with a transmission electron microscope (JEM-1400; JEOL USA Inc., Peabody, MA, USA) at 60 kV. Spherical particles ranging 77 to 131 nm in diameter were observed within the cytoplasm of infected cells (Fig. 1C and D).
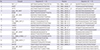
For full-length genome sequencing of the virus isolate (MERS-CoV Hu/KOR/SNU1_035/2015), Vero cell monolayer showing cytopathic effects was harvested and used for RNA extraction. RNA was extracted by using QIAamp viral RNA mini kit (QIAGEN, Valencia, CA), according to the manufacturer’s instructions. The RNA was used for cDNA synthesis using SuperScript III Reverse Transcriptase (Invitrogen, MA, USA) by each specific RT primer as described previously (12). Finally, about 2.5 kb PCR products were amplified by each primer pair (Table 1), and the amplicons were sheared by Covaris S2 according to the 200 bp target BP condition (Covaris, MA, USA). To generate the Next Generation Sequencing (NGS) library, the fragments were ligated with adapter and index (barcode) using TruSeq Nano DNA HT Library Prep kit (Illumina, CA, USA), and the library was sequenced by MiSeq (Illumina, CA, USA). The NGS data were aligned to MERS-CoV, NC_019843, used for Binary Sequence Alignment/Map (BAM) file generation, and genome assembly. In order to evaluate genetic relationship between this isolate and Homo sapiens and Camelus dromedaries MERS-CoV sequences reported from other countries, phylogenetic analyses were conducted using the whole genome, the S gene and the OFR1a gene.
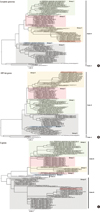
The full-length genome sequence (30,119 bp) of the virus isolate was obtained and deposited in the GenBank (accession no. KU308549). The genome sequence of the virus had high level of nucleotide identity (97.80%–99.95%) to those of MERS-CoV reported previously (Fig. 2A). Of note, the closest ones were KOREA/Seoul/035-1-2015 and 035-2-2015 (GenBank accession no. KT374054–5), that were directly sequenced from sputum of the same patient as ours (13). A previous study about S gene of MERS-CoV reported from Korea showed that a culture isolate from patient number 002 contained two nonsynonymous variants (S137R and V530L) (14). These variants were not found in our isolate and there was no difference in amino acids of S protein between our isolate and directly sequenced ones (KT374054-5). This difference can be explained by cell culture-adaptation in that our culture isolate was obtained before passage whereas one with nonsysnonymous variant was from the third passage in Vero cells.
Phylogenetic analyses of the whole genome showed that this virus closely clustered with those reported from Korea (GenBank accession nos. KT029139, KT374050– KT374057), China (GenBank accession no. KT006149.2) and Saudi Arabia in 2015 (GenBank accession no. KT026453–6). Phylogenetic analyses based on ORF1ab genes revealed that this virus fell into the group 3, but those based on S genes showed that this virus belongs to the group 5 along with other viruses reported from Korea (Fig. 2B and C). These findings are compatible to a previous study (15).
In summary, we isolated MERS-CoV from a patient with severe pneumonia who had been infected during the Korean outbreak in 2015. We also obtained full-length sequence of the virus isolate. Phylogenetic analyses showed that the isolate belongs to clade B of MERS-CoV.
 XML Download