

 PDF
PDF ePub
ePub Citation
 Print
Print


INTRODUCTION
Sleep is an important factor contributing to mental and physical health (1); and sleep disorders are associated with increased mortality and morbidity (23). Epidemiologic studies have reported that short sleep duration and poor sleep quality increase the risk of high body weight, obesity, and central obesity (45). Experimental studies demonstrate that sleep deprivation results in metabolic and endocrine alterations that may lead to increased body weight and fat mass (678). Sleep restriction affects cortisol levels, which leads to increased abdominal adiposity and decreased insulin sensitivity (7). Furthermore, activation of the sympathetic nervous system in response to sleep deprivation has been shown to inhibit the secretion of leptin and insulin (7). Sleep deprivation may alter insulin sensitivity independently of changes in body weight. Participants subjected to sleep restriction generally have increased glucose levels after a standardized breakfast without an adequate, subsequent rise in insulin, thus leading to a decrease in the effectiveness of insulin-mediated glucose uptake (910). Additionally, a study by Broussard et al. observed an approximate 30% reduction in cellular insulin sensitivity in adipocytes after 4 nights of sleep restriction (4.5 hours of sleep per night), which suggests that sleep may also play an important role in peripheral energy metabolism and cellular insulin signaling (11).
Epidemiologic studies have reported associations between sleep disturbance and diabetes. In a prospective study of Swedish middle-aged men, Mallon et al. reported an increased incidence of diabetes in subjects reporting difficulties maintaining sleep or short sleep duration (≤5 hours per night) (12). Another prospective cohort study, which observed Japanese men over 8 years, documented that subjects who had difficulty initiating sleep or maintaining sleep showed two to three fold higher risk of developing late-onset type 2 diabetes (13).
Although previous epidemiologic studies have reported that sleep problems could be related to a higher incidence of type 2 diabetes mellitus (T2DM), most of these earlier reports were from Western countries and only one cohort study to date has documented the relationship between poor sleep and diabetes in Japanese men. In the Korean population, little research has been conducted on the associations between poor sleep quality or duration and T2DM, especially using a longitudinal design. Therefore, the aim of our current study was to prospectively determine the effect of sleep quality and sleep duration on T2DM development in Korean primary care patients.
MATERIALS AND METHODS
Study subjects
The FACTS (FAmily CohorT Study in primary care) was established to investigate the relationship between familial environment and health in Koreans. The primary objective of this study was to investigate the role of family function in the development of cardiovascular diseases. The data of this cohort were collected based on couples which covered married, cohabitating, separated, and divorced individuals. Subjects (both couples) were recruited among people aged between 40 and 75 years, who visited the department of family medicine at university hospitals nationwide for the treatment of chronic disease such as hypertension, T2DM, dyslipidemia, or periodic health checkup from April 2009 to June 2011 in 22 hospitals. We used individual data on subjects in a couple cohort and included all those who visited a clinic at least once until August 2013. A total of 1,040 subjects were enrolled, of which 202 subjects were lost to follow-up. We excluded 175 subjects who were diagnosed with diabetes (either type 1 or type 2 diabetes) or who had previously undergone medical treatment for diabetes. Also, 33 subjects whose fasting plasma glucose was 126 mg/dL or more at the beginning of the study were excluded. We also excluded 67 subjects who had missing data on the Pittsburgh Sleep Quality Index (PSQI).
Variables of study characteristics
Demographic characteristics and health behaviors were prospectively collected using a standardized questionnaire, which included questions regarding marital status, monthly income, smoking status, alcohol intake, physical activity, and dietary pattern. Monthly income was evaluated by total household income using a single question. Smoking status was used to classify patients into current smokers, ex-smokers, or never-smokers. The Alcohol Use Disorders Identification Test-Korean version (AUDIT-K) was used to assess alcohol consumption (14). Risky alcohol drinking was defined as a total AUDIT-K score of 8 or more. Physical activity was estimated using the International Physical Activity Questionnaire Short-Form (IPAQ-SF), which is a scale inquiring on the intensity of activity and the length of time spent on exercise during the previous 7 days (15). Physical activity was classified as high, moderate, or low. Dietary patterns were investigated using a single question on whether meal intake was always regular, usually regular, or irregular.
Patient history of hypertension and dyslipidemia was based on the medical records of the study subjects. These subjects were defined as having hypertension if they reported any history of hypertension in the medical records or were taking antihypertensive medication. Subjects were defined as having dyslipidemia if they reported history of dyslipidemia in the medical records or were taking lipid-lowering agents.
Height and body weight were measured to the nearest 0.1 cm and 0.1 kg, respectively by trained interviewers. Body mass index (BMI) was calculated as: (weight in kilograms)/(height in meters)2. Blood samples were collected to determine glucose and HbA1c levels after 8 hours of fasting. Impaired fasting glucose was defined according to WHO criteria by a fasting plasma glucose level of between 110 mg/dL and 125 mg/dL in the initial blood samples (16).
Measurement of sleep quality
Sleep quality was measured using the PSQI at the initial visit. This index is a self-administered questionnaire for evaluating quality of sleep in the previous month and is composed of seven subcategories: sleep quality, sleep latency, sleep duration, habitual sleep efficiency, sleep disturbance, hypnotic medication use, and daytime dysfunction (17). Each item in the PSQI is scored from 0 to 3, whereby 0 means the positive extreme and 3 means the negative extreme on the Likert scale; the PSQI global score is the sum of these items, and scores range from 0 to 21. Poor sleep quality was defined as a PSQI global score of 5 or more.
Definition of the development of T2DM
Subjects were defined as having T2DM if a diagnosis had been made by a physician or if the subject underwent antidiabetes therapy including lifestyle modification, oral hypoglycemic medication, or insulin treatment. In addition, T2DM was established if blood samples showed glucose concentrations of 126 mg/dL or more at fasting or HbA1c levels of 6.5% or more.
Statistical analysis
The duration of follow-up was calculated as the interval between the baseline examination and the diagnosis of T2DM or the date of last follow up until August 2013. Kaplan-Meier survival analysis was used to estimate the crude incidence rate of diabetes according to sleep duration and sleep quality. Cox regression analysis was used to examine the univariate and multivariate associations between different variables and T2DM incidence. Multivariate Cox regression analyses were performed after adjusting for age, sex, BMI, physical activity, family history of diabetes, and income. We included the factors previously determined to affect the development of T2DM and variables with P value<0.1 in the univariate Cox proportional hazard model that could be confounding factors in relation to T2DM incidence. Results from the Cox regressions are presented with relative risks (RR), P values, and 95% confidence intervals (CI). A P value<0.05 was accepted as statistically significant. All data were analyzed using SPSS version 21.0 [IBM SPSS Statistics Inc, Chicago, IL, USA].
RESULTS
Patient characteristics
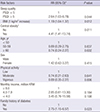
The baseline characteristics of the patients are listed in Table 1. Of the 563 subjects, 257 (45.6%) were men and 306 (54.4%) were women. The overall mean age of all subjects was 57.0±10.2 years, and the mean BMI was 24.1±2.8 kg/m2. More than four in 10 (44.0%) subjects earned less than 4,000,000 Korean won (KRW) (approximately equivalent to 3,600 USD) per month in household income. Current smokers accounted for 10.3% and risky alcohol drinkers for 21.5% of subjects. Subjects with a family history of diabetes accounted for 19.7% of the cohort. The average PSQI score was 5.4±3.2 points. It was 2.9±1.0 points in subjects with good sleep quality and 7.6±2.8 points in subjects with poor sleep quality.
Incidence of T2DM and variables related to diabetes risk
The total follow-up period was 1,401 person-years, and the median follow-up period was 2.6 years. Among the 563 subjects, 29 (5.2%) developed diabetes, resulting in a cumulative incidence rate of T2DM of 20.7 per 1,000 person-years. Table 2 describes the characteristics of the study participants according to T2DM incidence at follow up. There was no significant association between age or sex and incidence of T2DM. Subjects with higher BMI or lower income had a higher tendency to develop T2DM, but this was not statistically significant. Lifestyle factors including smoking, alcohol consumption, physical activity, and meal pattern did not correlate with the development of T2DM.
Sleep quality and sleep duration in relation to T2DM incidence
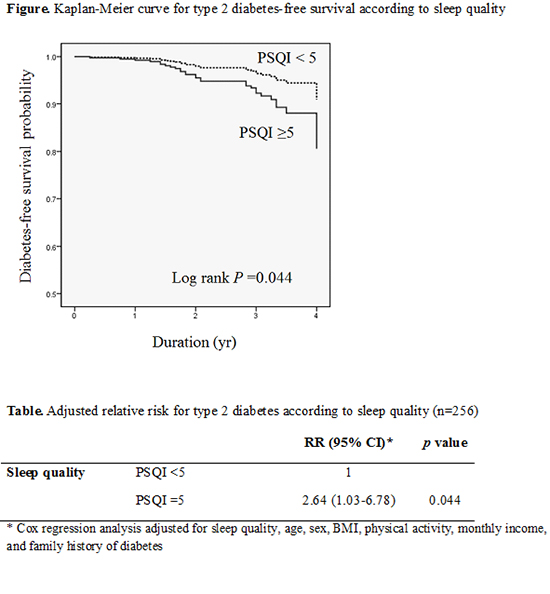
Using Kaplan Meier estimation, the incidence of T2DM was higher among subjects with poor sleep quality (P=0.044) (Fig. 1). The cumulative incidence rate of T2DM was 27 per 1,000 person-years in participants with poor sleep quality. Otherwise, the T2DM incidence was 12 per 1,000 person-years in participants with good sleep quality. A short sleep duration (≤5 hours) did not increase the incidence of T2DM (P>0.05). Cox regression analysis was used to estimate adjusted relative risk for T2DM according to sleep quality and other risk factors (Table 3). The incidence of T2DM was still higher in subjects with poor sleep quality after adjusting for age, sex, BMI, income, and family history of diabetes mellitus (RR, 2.64; 95% CI, 1.03-6.78). Also the risk of T2DM tended to increase with increasing BMI (RR, 1.19; 95% CI, 1.04-1.37), central obesity (RR, 4.41; 95% CI, 1.41-13.74) and family history of diabetes (RR, 2.75, 95% CI, 1.15-6.57).
DISCUSSION
In our current prospective cohort study, the risk of T2DM was more than two-fold higher in subjects with poor sleep quality. This relationship remained significant after adjusting for possible confounding factors including age, sex, BMI, income, and family history of diabetes.
Previous related studies have mostly reported that sleep problems increase the risk of diabetes (1318). Swedish men who reported difficulty falling asleep or use of sleeping pills had a higher risk of incident diabetes (18). A study on 2,649 Japanese men also documented that subjects with high frequency of difficulty initiating or maintaining sleep had more than a two-fold higher risk of diabetes (13). Several hypotheses have been suggested to explain the association between sleep problems and diabetes. Sleep restriction has potential effects on neuroendocrine and metabolic hormones (678), such as by generating greater cortisol levels in the evening, resulting in decreased insulin sensitivity the following morning. In addition, sympathetic nervous system activity would be higher in sleep restriction (6). Such responses to sleep restriction may disturb glucose metabolism and lower the levels of metabolic hormones such as leptin and insulin. In addition, sleep restriction can lead to food cravings, increasing the time for eating food, and decreasing physical activity. Thus, sleep restriction can cause weight gain and may lead to the development of diabetes (1920).
In our current study, we used the Pittsburgh Sleep Quality Index to evaluate sleep problems in our patient cohort. This scale allowed for a more systematic assessment of sleep problems than that of previous studies. In our analysis, short sleep duration was not found to be associated with T2DM risk but poor sleep quality did show an association with a higher incidence of T2DM. These results suggest that sleep quality is a better predictive factor than sleeping hours. In addition, our subject cohort was slightly older than those examined in previous studies (2122), which included subjects aged 25-39 years old. Thus, our participants would likely have had a shorter sleep duration, which may have attenuated the association between sleep duration and diabetes risk.
Obesity and overweight are well-known risk factors for the development of diabetes. Consistent with previous studies, diabetes risk was enhanced 15% on 1 kg/m2 of BMI increases. In addition, subjects with central obesity had more than a four-fold higher risk of T2DM development in our present study. In the previous Nurses' Health Study, overweight women (BMI, 25.0-29.9) had a more than seven times higher risk for developing diabetes compared to those with a BMI <23.0 kg/m2 during 16 years of follow-up (23). Unlike other studies, lifestyle factors such as smoking, risky alcohol consumption, and low physical activity were not associated with increased risk of T2DM. Because the median follow-up period of our study was 2.6 years, it was too short to evaluate the association between lifestyle factors and diabetes. If our follow-up period had been longer, the association may have become clearer. In addition, the average age of our study subjects was 57 years, which is relatively older than in previous studies. Subjects with poor lifestyle factors had already have diabetes in our cohort and they could be excluded from the analysis of this study.
Impaired fasting glucose is one of the strongest risk factors for the development of T2DM. Consistent with previous reports, impaired fasting glucose increased the T2DM risk almost seven-fold higher in our present cohort and it was still significantly associated with T2DM risk in multivariate analysis after adjusting for age, sex, BMI, income, physical activity, and sleep quality. Unfortunately, the association between sleep quality and T2DM risk was not found to be significant by multivariate analysis after adjusting for impaired fasting glucose. This could be because impaired fasting glucose might be a potential mediator of T2DM development as a result of poor sleep quality. Also, because sleep deprivation increases diabetes risk, the concurrent adjustment for sleep quality and impaired fasting glucose would result in multicollinearity. Therefore, the association between T2DM incidence and poor sleep quality might disappear after adjusting for impaired fasting glucose.
The strengths of our current study are its longitudinal design, large sample size and use of a standardized questionnaire concerning sleep problems. In our current study series also, the incidence of T2DM was 20.7 per 1,000 person-years, which is almost four-fold higher than that reported previously (2425). According to the report "Diabetes in Korea, 2007" by the Korean Diabetes Association Task Force Team for Basic Statistical Study of Korean Diabetes Mellitus, the incidence of diabetes is 5-6 per 1,000 person-years (25). This could be explained by a high proportion of our subjects with impaired fasting glucose levels. In our cohort also, 8% of subjects had a fasting glucose level of ≥110 mg/dL and 34.3% of subjects had ≥100 mg/dL. Furthermore, we measured fasting glucose levels only once and defined T2DM based on the one reading, which may have overestimated the incidence of T2DM in our cohort.
This study had several limitations of note. First, sleep quality was surveyed using a subjective method instead of an objective method such as polysomnography. However, the global PSQI score has good diagnostic sensitivity and specificity as a subjective method and may be useful to distinguish between good and poor sleepers (17). Second, because our study subjects were mainly included in patients visiting family physicians, our results would not be generalized in Korean population. Third, our study follow-up period of 2.6 years was relatively short in terms of accurately assessing the incidence of T2DM. With a longer follow-up period, the association between poor sleep quality and T2DM may have been stronger. In our analyses also, T2DM was determined by a glucose concentration of ≥126 mg/dL from one reading, which may have overestimated its incidence in our subjects. However, 80.7% of diabetes-positive subjects are diagnosed by their treating physician or the use of antidiabetes therapy, and most subjects undergo measurements for both fasting glucose and HbA1c levels, suggesting that any overestimation could not account for a large portion of the subjects. Finally, we considered several potential confounding factors affecting T2DM incidence, such as BMI, lifestyle factors (including physical activity), and family history. We also included monthly income to reflect the socioeconomic status of participants. However, unmeasured residual confounding factors may have been present. In addition, because patients visiting family physicians were recruited in this study, a number of subjects with chronic diseases such as hypertension or dyslipidemia were included and this may have affected the development of T2DM.
In conclusion, the incidence of T2DM is increased in subjects with poor sleep quality, but not in those with poor sleep duration. This may suggest that sleep quality is a better predictive factor for this condition than sleeping hours. Further studies are needed to determine if improving sleep quality decreases insulin resistance and the risk of developing T2DM.
 XML Download