Journal List > J Korean Med Sci > v.31(12) > 1023184

Kim, Hong, Shin, Ro, Ahn, Kim, and Lee: Validation of the Shock Index, Modified Shock Index, and Age Shock Index for Predicting Mortality of Geriatric Trauma Patients in Emergency Departments

Abstract

The shock index (SI), modified shock index (MSI), and age multiplied by SI (Age SI) are used to assess the severity and predict the mortality of trauma patients, but their validity for geriatric patients is controversial. The purpose of this investigation was to assess predictive value of the SI, MSI, and Age SI for geriatric trauma patients. We used the Emergency Department-based Injury In-depth Surveillance (EDIIS), which has data from 20 EDs across Korea. Patients older than 65 years who had traumatic injuries from January 2008 to December 2013 were enrolled. We compared in-hospital and ED mortality of groups categorized as stable and unstable according to indexes. We also assessed their predictive power of each index by calculating the area under the each receiver operating characteristic (AUROC) curve. A total of 45,880 cases were included. The percentage of cases classified as unstable was greater among non-survivors than survivors for the SI (36.6% vs. 1.8%, P < 0.001), the MSI (38.6% vs. 2.2%, P < 0.001), and the Age SI (69.4% vs. 21.3%, P < 0.001). Non-survivors had higher median values than survivors on the SI (0.84 vs. 0.57, P < 0.001), MSI (0.79 vs. 1.14, P < 0.001), and Age SI (64.0 vs. 41.5, P < 0.001). The predictive power of the Age SI for in-hospital mortality was higher than SI (AUROC: 0.740 vs. 0.674, P < 0.001) or MSI (0.682, P < 0.001) in geriatric trauma patients.

INTRODUCTION

The elderly population is rapidly growing, and traumatic injury of geriatric individuals is a significant problem for the health care systems of most advanced countries (1). Elderly patients experience traumatic injuries as drivers or passengers in motor vehicles, as pedestrians being struck by motor vehicles, by falling from a height, and from crushing (234). Elderly trauma patients usually have co-morbidities so the complications and the long-term mortality of traumatic injury is greater for elderly individuals than for young individuals (5).
Previous studies have used several methodologies to assess the severity and predict the mortality of patients with traumatic injuries. However, many of these scoring tools are inconvenient for initial use in an emergency department (ED) because the calculations are complex or because detailed clinical and laboratory information is required (67). The shock index (SI), calculated as heart rate (HR) divided by systolic blood pressure (SBP), is a measure of hemodynamic stability that is useful in predicting mortality and injury severity in trauma patients (89101112). The SI is superior to heart rate and systolic blood pressure alone in predicting mortality in geriatric trauma patients (1314).
The SI is easy to calculate, but its accuracy for geriatric populations is controversial. Previous research suggested that SI multiplied by age (Age SI) is a better predictor of mortality following traumatic injury of an elderly patient (15). Another investigator proposed use of the modified shock index (MSI), the ratio of heart rate to mean blood pressure, as a more accurate predictor than systolic blood pressure, heart rate, and SI (1617). However SI, MSI, and Age SI were developed and validated for different populations (111213). In the present study, we assessed the predictive power of the SI, MSI, and Age SI in geriatric patients using a single large nationwide trauma database.
The aim of this study was to validate the power of the SI, MSI, and Age SI in prediction of mortality in geriatric trauma patients.

MATERIALS AND METHODS

Study design

This study is a retrospective analysis that used the Emergency Department-based Injury In-depth Surveillance (EDIIS) database of Korea. The EDIIS is a nationwide injury database that includes all injured patients admitted to EDs across Korea. The Korea Centers for Disease Control and Prevention (KCDC) developed and operates the EDIIS.

Study setting

Twenty tertiary academic hospital EDs provide data to the EDIIS database of all injured patients who were admitted to their EDs. The EDIIS database has demographic information, injury prevention and epidemiologic information, prehospital procedures, initial clinical findings at the ED, diagnosis (coded by ICD-10), treatment in the ED, ED disposition, and patient outcome after admission (18). Primary information was acquired by physicians of each institution during their clinical practice and by trained coordinators of the EDIIS project who were assigned to each hospital. The coordinators collected the data from the standardized registry. The data of each ED were entered into a web-based database of the KCDC and a quality improvement program was conducted regularly.

Selection of participants

We included injured patients aged 65 years or older among all cases registered in the EDIIS database from January 2008 to December 2013. We excluded patients who were dead upon arrival at the ED, who had isolated traumatic brain injury, and who had non-traumatic injuries such as a burn, drowning, or drug intoxication. We also excluded patients if the injury occurred more than 6 hours before arrival at the ED. Patients without data on vital parameters (HR, SBP, or DBP) and time parameters were also excluded.

Variables and measurements

We calculated the SI, MSI, and Age SI using vital signs initially measured at the ED. For each indicator, we defined the different cut-off values of hemodynamic instability according to previous research (131517). Hemodynamic instability was defined as an SI equal to or greater than 1, an MSI equal to or greater than 1.3, and an Age SI equal to or greater than 50.
We abstracted the following data from the EDIIS database for analysis: demographics, insurance, initial vital signs measured at the ED, use of an emergency medical service (EMS), intention of injury, mechanisms of injury, mentality according to the Alert-Voice-Pain-Unresponsive (AVPU) classification, operative intervention, in-hospital mortality and ED mortality.

Outcome measures

The primary outcome was the percentage of hemodynamically unstable geriatric trauma patients, categorized by cut-off values for the 3 indexes, among survivors and non-survivors. The secondary outcome was the statistical power of the SI, MSI, and Age SI for predicting mortality of geriatric patients. We measured the area under the receiver operating characteristic curve (AUROC) for the SI, MSI, and Age SI by a binary model and a continuous model.

Statistical analysis

We performed descriptive analysis using medians and interquartile ranges for parameters with non-normal distributions. We compared variables using the Wilcoxon rank sum test for continuous variables and the χ2 test for categorical variables. P values were based on a two-sided significance level of 0.05. We calculated AUROC curves to assess the predictive power of the 3 scoring systems by use of a binary model (using cut-off values for each system) and by a continuous model using numerical values for each system. We also conducted sensitivity analyses to calculate the values of each system that provided the best cut-off (SI and MSI by 0.1 unit, Age SI by 1 unit). SAS version 9.4 (SAS Institute Inc., Cary, NC, USA) was used for statistical analysis.

Ethics statement

The study was approved by the institutional review board of Seoul National University College of Medicine and Hospital (IRB number: 1103-152-357). Informed consent was exempted by the board.

RESULTS

Fig. 1 shows the procedure used to select geriatric trauma patients. During the study period, 1,179,175 trauma cases were registered in the EDIIS database and 111,431 (9.4%) of these cases were geriatric patients. Based on our inclusion criteria, we ultimately enrolled 45,880 cases for analysis (Fig. 1).
Fig. 1
Criteria used to select the study population of geriatric patients with traumatic injuries.
ER = emergency room.
jkms-31-2026-g001
Table 1 compares the demographics and injury epidemiology of survivors and non-survivors. Segregation of patients into 3 age groups (> 85, 75–84, and 65–74 years-old) indicated significantly greater mortality in patients who were older. Cases who had traffic accidents and who used an EMS were more likely to have died, and the time from injury to ER arrival was longer in cases who died.
Table 1

Demographics and injury epidemiology of survivors and non-survivors

jkms-31-2026-i001
Characteristics Total Survivors Non-survivors P value
No. % No. % No. %
Total 45,880 100 45,347 98.8 533 1.2
Sex, male 21,223 46.3 20,928 46.2 295 55.3 < 0.001
Age, yr < 0.001
 65–74 27,633 60.2 27,386 60.4 247 46.3
 75–84 14,462 31.5 14,257 31.4 205 38.5
 > 84 3,785 8.2 3,704 8.2 81 15.2
 Median (IQR) 72 (6–78) 72 (68–78) 75 (70–81) < 0.001
Type of trauma < 0.001
 TA 11,709 25.5 11,403 25.1 306 57.4
 Falling 25,038 54.6 24,841 54.8 197 37.0
 Blunt force 5,286 11.5 5,272 11.6 14 2.6
 Penetrating 3,503 7.6 3,488 7.7 15 2.8
 Other 344 0.7 343 0.8 1 0.2
EMS use < 0.001
 Prehospital 18,285 39.9 18,012 39.7 273 51.2
 Interhospital 2,468 5.4 2,351 5.2 117 22.0
 Ambulatory 21,899 47.7 21,841 48.2 58 10.9
 Unknown 3,228 7.0 3,143 6.9 85 15.9
Injury to ED time < 0.001
 Median (IQR) 1 (0.52–2.07) 1 (0.52–2.05) 1.18 (0.57–2.63)
IQR = interquartile ranges, TA = traffic accident, EMS = emergency medical service, ED = emergency department.
We also assessed the clinical characteristics of survivors and non-survivors (Table 2). The results show the non-survivors had lower SBP, lower DBP, higher heart rate, poorer mental status, and were more likely to be admitted to the ED, given an operation, and admitted to the ICU.
Table 2

Clinical parameters and ED disposition of survivors and non-survivors

jkms-31-2026-i002
Variables All Survivors Non-survivors P value
No. % No. % No. %
Total 45,880 100 45,347 98.8 533 1.2
SBP, Median (IQR) 140 (123–160) 140 (124–160) 106 (80–135) < 0.001
DBP, Median (IQR) 80 (70–90) 80 (70–90) 62 (50–80) < 0.001
HR, Median (IQR) 80 (72–88) 80 (72–88) 88 (76–103) < 0.001
Mental status < 0.001
 Alert 43,763 95.4 43,429 95.8 334 62.7
 Verbal 741 1.6 671 1.5 70 13.1
 Pain 233 0.5 182 0.4 51 9.6
 Unresponsive 112 0.2 56 0.1 56 10.5
 Unknown 1,031 2.2 1,009 2.2 22 4.1
ED result < 0.001
 Discharge 30,164 65.7 30,164 66.5 - -
 ED death 189 0.4 - - 189 35.5
 Admission 12,198 26.6 11,854 26.1 344 64.5
 Transfer 3,329 7.3 3,329 7.3 - -
Operation 5,511 12.0 5,367 11.8 144 27.0 < 0.001
ICU admission 1,199 2.6 1,003 2.2 196 36.8 < 0.001
SBP = systolic blood pressure, IQR = interquartile ranges, DBP = diastolic blood pressure, HR = heart rate, ED = emergency department, ICU = intensive care unit.
We determined the median values of each index for survivors and non-survivors (Table 3). The results of in-hospital group indicate the non-survivors had a greater median SI (0.84 vs. 0.57, P < 0.001), MSI (1.14 vs. 0.79, P < 0.001), and Age SI (64.0 vs. 41.5, P < 0.001), which of ED group indicate the non-survivors had a greater SI (1.05 vs. 0.57, P < 0.001), MSI (1.40 vs. 0.79, P < 0.001), and Age SI (80.0 vs. 41.5, P < 0.001). We also compared percentage of hemodynamically unstable cases defined by each system among survivors and non-survivors. The percentage of cases classified as unstable were significantly more likely to be non-survivors according to the SI (36.6% vs. 1.8% of in-hospital group, 56.1% vs. 0.9% of ED group), the MSI (38.6% vs. 2.2% of in-hospital group, 58.2% vs. 1.2% of ED group) and the Age SI (69.4% vs. 21.3% of in-hospital group, 83.1% vs. 18.8% of ED group) (Table 3).
Table 3

Percentage of survivors and non-survivors who were classified as stable and unstable according to the SI, MSI, and Age SI

jkms-31-2026-i003
Variables Total In-hospital ED
No. % Survivors Non-survivors P value Survivors Non-survivors P value
No. % No. % No. % No. %
Total 45,880 100 45,347 98.8 533 1.2 30,164 99.4 189 0.6
SI < 0.001 < 0.001
 < 1 44,884 97.8 44,546 98.2 338 63.4 29,897 99.1 83 43.9
 ≥ 1 996 2.2 801 1.8 195 36.6 267 0.9 106 56.1
 Median (IQR) 0.57 (0.49–0.66) 0.57 (0.49–0.65) 0.84 (0.62–1.13) < 0.001 0.57 (0.49–0.65) 1.05 (0.76–1.35) < 0.001
MSI < 0.001 < 0.001
 < 1.3 44,662 97.3 44,335 97.8 327 61.4 29,792 98.8 79 41.8
 ≥ 1.3 1,218 2.7 1,012 2.2 206 38.6 372 1.2 110 58.2
 Median (IQR) 0.79 (0.69–0.90) 0.79 (0.69–0.90) 1.14 (0.86–1.55) < 0.001 0.79 (0.69–0.90) 1.40 (1.04–1.84) < 0.001
Age SI < 0.001 < 0.001
 < 50 35,832 78.1 35,669 78.7 163 30.6 24,498 81.2 32 16.9
 ≥ 50 10,048 21.9 9,678 21.3 370 69.4 5,666 18.8 157 83.1
 Median (IQR) 41.6 (35.5–48.7) 41.5 (35.4–48.5) 64.0 (47.0–87.0) < 0.001 41.5 (35.4–48.6) 80.0 (57.0–100.0) < 0.001
ED = emergency department, SI = shock index, IQR = interquartile ranges, MSI = modified shock index, Age SI = age shock index.
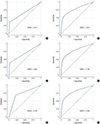
Finally, we compared the AUROC of each index for prediction of in-hospital and ED mortality (Table 4, Fig. 2). Age SI showed higher predictive power for in-hospital mortality than SI (Binary model: 0.740 vs. 0.674, P < 0.001, Continuous model: 0.808 vs. 0.786, P < 0.001). Age SI also showed higher power than MSI (Binary model: 0.740 vs. 0.682, P < 0.001, Continuous model: 0.808 vs. 0.786, P < 0.001). For ED mortality, Age SI showed better prediction than SI (Binary model: 0.807 vs. 0.771, P = 0.024, Continuous model: 0.890 vs. 0.880, P = 0.039).
Table 4

Predictive power of the SI, MSI, and Age SI for in-hospital mortality and ED mortality based on a binary model and a continuous model

jkms-31-2026-i004
Parameter Binary model Continuous model
AUC (95% CI) AUC (95% CI) P value AUC (95% CI) AUC (95% CI) P value
In-hospital mortality
 SI vs. MSI 0.674 (0.654–0.695) 0.682 (0.661–0.703) 0.125 0.786 (0.762–0.810) 0.788 (0.765–0.812) 0.514
 SI vs. Age SI 0.674 (0.654–0.695) 0.740 (0.721–0.760) < 0.001 0.786 (0.762–0.810) 0.808 (0.785–0.831) < 0.001
 MSI vs. Age SI 0.682 (0.661–0.703) 0.740 (0.721–0.760) < 0.001 0.788 (0.765–0.812) 0.808 (0.785–0.831) < 0.001
ED mortality
 SI vs. MSI 0.771 (0.735–0.806) 0.779 (0.744–0.814) 0.439 0.880 (0.848–0.911) 0.884 (0.853–0.915) 0.411
 SI vs. Age SI 0.771 (0.735–0.806) 0.807 (0.780–0.834) 0.024 0.880 (0.848–0.911) 0.890 (0.860–0.920) 0.039
 MSI vs. Age SI 0.779 (0.744–0.814) 0.807 (0.780–0.834) 0.084 0.884 (0.853–0.915) 0.890 (0.860–0.920) 0.327
AUC = area under curve, CI = confidence interval, SI = shock index, MSI = modified shock index, Age SI = age shock index, ED = emergency department.
Fig. 2
Area under the receiver operating characteristic (AUROC) curve for in-hospital mortality based on the SI (A and B), MSI (C and D), and Age SI (E and F) for a binary model (A, C, and E) and a continuous model (B, D, and F).
jkms-31-2026-g002

DISCUSSION

In the present study, we validated the SI, MSI and Age SI in predicting the mortality of geriatric trauma patients using a single nationwide injury surveillance system from 20 tertiary EDs across Korea. All of the indexes had higher values for non-survivors than survivors. The percentage of unstable patients who died was 36.6% based on the SI, 38.6% based on the MSI, and 69.4% based on the Age SI. The AUROC curve for in-hospital mortality was 0.674 for the SI, 0.682 for the MSI, and 0.740 for the Age SI. Predictive power for in-hospital mortality of Age SI in both models was higher than SI or MSI. Previous studies developed or validated these indexes for different study populations and used different definitions of “elderly” or “geriatric” (1315192021). Our investigation validated each parameter using a single trauma database and we defined “geriatric” as being older than 65 years.
To analyze the prediction of early mortality, we analyzed the ED patients except for hospitalized patients. The AUROC curve for ED mortality was 0.771 for the SI, 0.779 for the MSI, and 0.807 for the Age SI in binary model, which were higher than the AUROC curve for in-hospital patients (Table 4). We estimated that the SI, MSI, Age SI were more effective in the early mortality prediction.
We determined the percentage of hemodynamically unstable patients among survivors and non-survivors based on cut-off values for each index that were used in previous studies (13151722). Among the 45,880 enrolled cases, 2.2% of cases were unstable defined by an SI of 1 or more and 2.7% of cases were unstable defined by an MSI of 1.3; but 21.9% of cases were unstable defined by an Age SI of 50 or more. Thus, for patients older than 65 years, use of the Age SI cut-off value of 50 overestimated severity of the trauma. In other words, in very elderly geriatric patients, the age component in the Age SI formula led to a large increase in the number of patients classified as hemodynamically unstable. We calculated the AUROC of the Age SI according to the age group. The AUROC of Age SI predicting ED mortality was 0.816 (95% CI, 0.773–0.860) for age from 65 to 74, and 0.779 (95% CI, 0.738–0.821) for age from 75 to 84, and 0.744 (95% CI, 0.707–0.782) for age over 85 in binary model. In continuous model, the AUROC of Age SI for each 65–74, 85–84 and 85– aged group was 0.876 (0.824–0.927), 0.882 (0.828–0.926) and 0.909 (0.857–0.962), respectively.
We also performed sensitivity analyses in predicting mortality for each index. In these analyses, the SI ranged from 0.1 to 2.0 (by 0.1 unit), the MSI ranged from 0.4 to 2.3 (by 0.1 unit), and the Age SI ranged from 41 to 60 (by 1.0 unit) (Table 5). If we consider the sum of sensitivity and specificity to indicate the best model, then the SI was maximized with a cut-off at 0.7 (sensitivity, 70.0%; specificity, 73.6%), the MSI with a cut-off at 0.8 (sensitivity, 55.9%; specificity, 90.9%), and the Age SI with a cut-off at 49 (sensitivity, 73.0%; specificity, 74.9%). If we consider mean sensitivity and specificity, then the cut-off values are 0.8 for the SI, 0.9 for the MSI, and 55 for the Age SI. Comparing the cut-off value of each index using the same methodology of previous research such as sum or mean value of sensitivity and specificity, there was a difference of the value between our study and previous research (13141517). The difference could be observed due to the difference of study population or different inclusion criteria of the database used for each study.
Table 5

Sensitivity analysis of SI, MSI, and Age SI for predicting in-hospital mortality

jkms-31-2026-i005
SI MSI Age SI
Cut-off Sensitivity, % Specificity, % Cut-off Sensitivity, % Specificity, % Cut-off Sensitivity, % Specificity, %
≥ 0.1 100.0 0.0 ≥ 0.4 99.8 0.1 ≥ 41 86.9 46.0
≥ 0.2 100.0 0.0 ≥ 0.5 99.4 0.6 ≥ 42 85.7 50.1
≥ 0.3 99.8 0.1 ≥ 0.6 97.8 4.6 ≥ 43 84.2 54.0
≥ 0.4 98.7 2.5 ≥ 0.7 94.2 17.1 ≥ 44 81.2 58.2
≥ 0.5 95.1 15.9 ≥ 0.8 86.9 39.1 ≥ 45 79.6 62.0
≥ 0.6 84.6 43.5 ≥ 0.9 75.8 65.4 ≥ 46 77.5 65.6
≥ 0.7 70.0 73.6 ≥ 1.0 64.0 82.4 ≥ 47 76.2 69.1
≥ 0.8 58.5 89.4 ≥ 1.1 55.9 90.9 ≥ 48 74.3 72.2
≥ 0.9 49.0 95.4 ≥ 1.2 49.5 95.2 ≥ 49 73.0 74.9
≥ 1.0 39.8 97.7 ≥ 1.3 42.6 97.1 ≥ 50 70.4 77.5
≥ 1.1 31.9 98.7 ≥ 1.4 35.8 98.2 ≥ 51 68.3 79.9
≥ 1.2 23.8 99.2 ≥ 1.5 29.8 98.9 ≥ 52 66.8 82.0
≥ 1.3 20.6 99.5 ≥ 1.6 24.8 99.2 ≥ 53 65.3 83.9
≥ 1.4 15.8 99.7 ≥ 1.7 20.5 99.4 ≥ 54 63.4 85.7
≥ 1.5 11.8 99.8 ≥ 1.8 16.9 99.6 ≥ 55 62.1 87.1
≥ 1.6 10.1 99.8 ≥ 1.9 14.1 99.7 ≥ 56 60.2 88.4
≥ 1.7 7.5 99.9 ≥ 2.0 12.2 99.8 ≥ 57 58.9 89.6
≥ 1.8 5.6 99.9 ≥ 2.1 10.9 99.8 ≥ 58 57.6 90.7
≥ 1.9 4.5 99.9 ≥ 2.2 9.0 99.9 ≥ 59 55.9 91.6
≥ 2.0 3.4 100.0 ≥ 2.3 6.9 99.9 ≥ 60 54.8 92.5
SI = shock index, MSI = modified shock index, Age SI = age shock index.
This study had several limitations. First, this was a retrospective analysis. Second, we did not measure exact time profile from injury occurrence to mortality. Shock index is effective to predict short term mortality. But predictive power of shock index for long term mortality is controversial. To conduct robust assessment of predictive power of shock index, measuring time from injury to mortality is required. But the database used in the study did not collect time profile of mortality. Instead of exact time profile, we assessed predictive power of shock index for mortality during ED stay and total in-hospital period, respectively. Third, we could not assess the effect of anti-hypertensive drug medication (such as beta blockers) on the validity of the SI because the EDIIS did have this information. To overcome this limitation, collection of information about drug use was required, but in the emergency clinical settings where geriatric trauma patients are managed, the SI was used regardless of whether information about medication use was available.
In conclusion, we assessed the statistical power of the SI, MSI, and Age SI for predicting the mortality of geriatric trauma patients using a large nationwide database. As expected, each index classified more non-survivors than survivors as hemodynamically unstable. The AUROC curve for predicting mortality was 0.674 for the SI, 0.682 for the MSI, and 0.740 for the Age SI in binary models. The Age SI showed better predictive power of in-hospital mortality than SI or MSI in geriatric trauma patients visited emergency departments.

Notes

Funding The Korea Centers for Disease Control and Prevention performed the Emergency Department based Injury Surveillance System project.

DISCLOSURE The authors have no potential conflicts of interest to disclose.

AUTHOR CONTRIBUTION Conception and design: Hong KJ. Draft of the manuscript: Kim SY. Statistical analysis: Shin SD, Ahn KO. Analysis and interpretation of data: Ro YS. Collection of CDC injury registry data: Kim YJ, Lee EJ. Revision and approval of the manuscript: all authors.

References

1. Joyce MF, Gupta A, Azocar RJ. Acute trauma and multiple injuries in the elderly population. Curr Opin Anaesthesiol. 2015; 28:145–150.
2. Giannoudis PV, Harwood PJ, Court-Brown C, Pape HC. Severe and multiple trauma in older patients; incidence and mortality. Injury. 2009; 40:362–367.
3. Tornetta P 3rd, Mostafavi H, Riina J, Turen C, Reimer B, Levine R, Behrens F, Geller J, Ritter C, Homel P. Morbidity and mortality in elderly trauma patients. J Trauma. 1999; 46:702–706.
4. Wang SJ, Chung JM. Geriatric trauma. J Korean Geriatr Soc. 2003; 7:85–94.
5. Perdue PW, Watts DD, Kaufmann CR, Trask AL. Differences in mortality between elderly and younger adult trauma patients: geriatric status increases risk of delayed death. J Trauma. 1998; 45:805–810.
6. Osler TM, Rogers FB, Badger GJ, Healey M, Vane DW, Shackford SR. A simple mathematical modification of TRISS markedly improves calibration. J Trauma. 2002; 53:630–634.
7. Kilgo PD, Meredith JW, Osler TM. Incorporating recent advances to make the TRISS approach universally available. J Trauma. 2006; 60:1002–1008.
8. Cannon CM, Braxton CC, Kling-Smith M, Mahnken JD, Carlton E, Moncure M. Utility of the shock index in predicting mortality in traumatically injured patients. J Trauma. 2009; 67:1426–1430.
9. Birkhahn RH, Gaeta TJ, Terry D, Bove JJ, Tloczkowski J. Shock index in diagnosing early acute hypovolemia. Am J Emerg Med. 2005; 23:323–326.
10. Rady MY, Smithline HA, Blake H, Nowak R, Rivers E. A comparison of the shock index and conventional vital signs to identify acute, critical illness in the emergency department. Ann Emerg Med. 1994; 24:685–690.
11. Toccaceli A, Giampaoletti A, Dignani L, Lucertini C, Petrucci C, Lancia L. The role of shock index as a predictor of multiple-trauma patients’ pathways. Nurs Crit Care. 2016; 21:e12–9.
12. Lim SI, Lee SW, Hong YS, Choi SH, Moon SW, Kim SJ, Kim NH, Park SM, Kim JY. Shock index, serum lactate level, and arterial-end tidal carbon dioxide difference as hospital mortality markers and guidelines of early resuscitation in hypovolemic shock. J Korean Soc Emerg Med. 2007; 18:287–293.
13. Pandit V, Rhee P, Hashmi A, Kulvatunyou N, Tang A, Khalil M, O’Keeffe T, Green D, Friese RS, Joseph B. Shock index predicts mortality in geriatric trauma patients: an analysis of the National Trauma Data Bank. J Trauma Acute Care Surg. 2014; 76:1111–1115.
14. Zarzaur BL, Croce MA, Magnotti LJ, Fabian TC. Identifying life-threatening shock in the older injured patient: an analysis of the National Trauma Data Bank. J Trauma. 2010; 68:1134–1138.
15. Zarzaur BL, Croce MA, Fischer PE, Magnotti LJ, Fabian TC. New vitals after injury: shock index for the young and age x shock index for the old. J Surg Res. 2008; 147:229–236.
16. Liu YC, Liu JH, Fang ZA, Shan GL, Xu J, Qi ZW, Zhu HD, Wang Z, Yu XZ. Modified shock index and mortality rate of emergency patients. World J Emerg Med. 2012; 3:114–117.
17. Singh A, Ali S, Agarwal A, Srivastava RN. Correlation of shock index and modified shock index with the outcome of adult trauma patients: a prospective study of 9860 patients. N Am J Med Sci. 2014; 6:450–452.
18. Ro YS, Shin SD, Holmes JF, Song KJ, Park JO, Cho JS, Lee SC, Kim SC, Hong KJ, Park CB, et al. Comparison of clinical performance of cranial computed tomography rules in patients with minor head injury: a multicenter prospective study. Acad Emerg Med. 2011; 18:597–604.
19. Furmaga W, Cohn S, Prihoda TJ, Muir MT, Mikhailov V, McCarthy J, Arar Y. Novel markers predict death and organ failure following hemorrhagic shock. Clin Chim Acta. 2015; 440:87–92.
20. Choi JY, Lee WH, Yoo TK, Park I, Kim DW. A new severity predicting index for hemorrhagic shock using lactate concentration and peripheral perfusion in a rat model. Shock. 2012; 38:635–641.
21. McNab A, Burns B, Bhullar I, Chesire D, Kerwin A. An analysis of shock index as a correlate for outcomes in trauma by age group. Surgery. 2013; 154:384–387.
22. Mitra B, Fitzgerald M, Chan J. The utility of a shock index >/= 1 as an indication for pre-hospital oxygen carrier administration in major trauma. Injury. 2014; 45:61–65.
TOOLS
ORCID iDs

Soon Yong Kim
https://orcid.org/http://orcid.org/0000-0002-1685-812X

Ki Jeong Hong
https://orcid.org/http://orcid.org/0000-0003-3334-817X

Sang Do Shin
https://orcid.org/http://orcid.org/0000-0003-4953-2916

Young Sun Ro
https://orcid.org/http://orcid.org/0000-0003-3634-9573

Ki Ok Ahn
https://orcid.org/http://orcid.org/0000-0002-8446-3269

Yu Jin Kim
https://orcid.org/http://orcid.org/0000-0001-7449-9025

Eui Jung Lee
https://orcid.org/http://orcid.org/0000-0001-8065-2014

Similar articles