

 PDF
PDF ePub
ePub Citation
 Print
Print


INTRODUCTION
Asian Americans are among the fastest growing and most diverse populations in the U.S. According to the 2010 U.S. Census, the Asian population accounted 5.6% of the total U.S. population. Between 2000 and 2010, Asian births increased more than four times faster than the total U.S. population, growing by 46% from 11.9 million to 17.3 million. In 2010, the U.S. Census showed Asian racial groups with more than one million, such as Chinese, Filipino, Asian Indian, Vietnamese, Korean, and Japanese in descending order of population size. Births to biracial Asian-White parents grew by 87% from 868,000 in 2000 to 1.6 million in 2010 (1). There is marked heterogeneity in their demographic and social characteristics among these Asian ethnic groups. However, Asian Americans have been often treated as a single group in epidemiological research. Some of the recent studies have reported significant differences in birth outcomes among Asian ethnic groups (2345678910). To our knowledge, there are few published studies about outcomes of births to biracial Asian-White parents (1112). Comparison for births to interracial parents provides a unique opportunity to study the interaction and impact of racial origin and environment on birth outcomes.
The objective of this study was to investigate birth outcomes, mean birthweight and risks for low birthweight (LBW) and preterm birth (PTB) in live births to biracial Asian-White parents and also, to the six major same ethnic Asian parents.
MATERIALS AND METHODS
Data source and study population
Our study used natality data files of the U.S. National Center for Health Statistics (NCHS). Our study included live births to six major Asian racial groups, both parents being Korean, Chinese, Japanese, Filipino, Asian Indian, and Vietnamese (e.g.; Korean/Korean, Vietnamese/Vietnamese, and so on) and one percent of live births to the White (non-Hispanic White mother/non-Hispanic White father) parents in the U.S. for the years between 1992 and 2012. We excluded births to mixed Asian parents (e.g.; Japanese/Chinese, Vietnamese/Korean, and so on), multiple births, births with gestational ages < 22 or ≥ 44 weeks and birthweights < 300 g. Thus, our study population (n = 2,824,626) consisted of four major groups; 1) births to White mother/Asian father parents group (n = 180,266), 2) Asian mother/White father parents group (n = 399,752), 3) births to the both same ethnic Asian parents group (n = 1,865,073), and 4) the reference group, births to the White mother/White father group (n = 379,535) (Fig. 1). Births to the first three groups (White mother/Asian father, Asian mother/White father, and Asian mother/Asian father) are each divided into six subgroups by Asian ethnicity, Korean, Chinese, Japanese, Filipino, Asian Indian, and Vietnamese, all together consisting of 18 subgroups (Fig. 1).
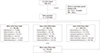
Fig. 1
A diagram showing the study design and populations.
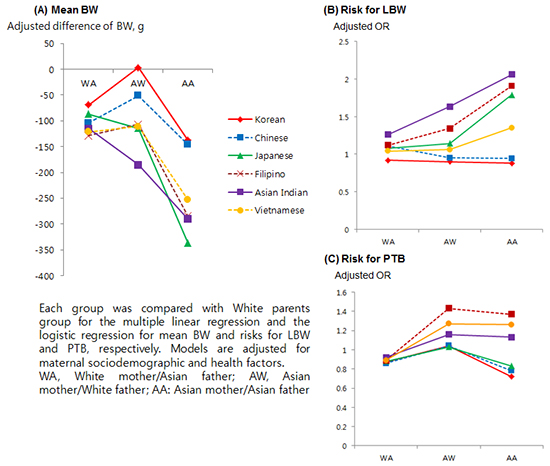
Each group was compared with White parents group for the multiple linear regression and the logistic regression for mean BW and risks for LBW and PTB, respectively. Models are adjusted for maternal sociodemographic and health factors.
WA = White mother/Asian father, AW = Asian mother/White father, AA = Asian mother/Asian father.
Variables and data analyses
In our study groups, we examined three indices of birth outcomes, mean birthweight, LBW (< 2,500 g) rate and PTB (< 37 weeks) rate. Parental characteristics associated with birth outcomes were examined among births to the 18 Asian parents groups and compared to the reference group, births to both White mother/father group. Parental characteristics examined were maternal age, education, marital status, adequacy of prenatal care, parity, maternal medical complications, maternal smoking and alcohol use, and paternal age. Maternal medical complications included were diabetes mellitus, chronic hypertension, pregnancy-induced hypertension, and eclampsia. The effect of these parental characteristics on birth outcomes of our 18 subgroups was further explored using multiple linear and logistic regression analyses and comparing mean birthweight, risks for LBW, and PTB of these subgroups to the White parent reference group.
Statistical analyses were performed using STATA 13 (Stata Corp., College Station, TX, USA). Categorical variables were analyzed by the χ2 test. Differences in continuous variables were assessed by Student’s t-test. P values < 0.05 were considered significant.
RESULTS
Study population
In our study, among singleton live births with Asian parental heritage (n = 2,445,091), the majority were born to the both ethnic Asian parents (76.3%, n = 1,865,073). Thus, the remainder (23.7%, n = 580,018) were born to the biracial parents with non-Hispanic White, consisting 16.3% having Asian mother and White father, and 7.4% having Asian father and White mother (Fig. 1). Among all births with Asian parental heritage, births to Chinese mother and/or father were most common, 26.0%. Although among all births with Asian heritage, only 5.9% were with Japanese heritage, but these births were most frequently to biracial Japanese/White parents (56.9%). On the other hand, births to Asian Indian heritage was relatively large, 25.2% of all Asian heritage, but only 9.8% of these births were to biracial Asian Indian/White parents (Fig. 1).
Parental characteristics and birth outcomes of 4 major groups
There were significant differences in both parental characteristics and birth outcomes among four groups; the reference White/White parents group, and three parents groups with Asian heritage, the white mother/Asian father, Asian mother/White father, and Asian mother/Asian father parents groups (Table 1). Compared to the White parents group, the three parents groups with Asian heritage tended to have births at older maternal and paternal ages, more often married and with less parity. Mothers of these Asian parental groups also tended to smoke and to drink alcohol less. Compared to the biracial Asian/White parents groups, mothers of the Asian mother/Asian father groups had remarkably far less use of alcohol and smoking, more were married, and had less maternal education. Compared to mean birthweight of births to the reference White parents group (3,410 g), births to all three parents groups with Asian heritage had less mean birthweight, least in the Asian father/Asian mother group (3,207 g). Difference in gestational age was at most less than a day or so between the reference and the Asian parent groups (Table 1). This finding suggests that differences in birthweight among groups are not attributable to differences in gestational age.
Table 1
Parental characteristics and birth outcomes of 4 major groups
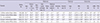
Data expressed as mean (± standard deviation).
GA = gestational age, BW = birthweight, LBW = low birth weight, PTB = preterm birth.
*P < 0.01 compared to White mother/White father group; †Medical complications include diabetes mellitus, chronic hypertension, pregnancy-induced hypertension, and eclampsia.
Parental characteristics and birth outcomes of 18 subgroups
Difference in birth outcomes, birthweight, gestational age, LBW, and PTB, was hard to compare between births to Asian parents and births to the reference White group, since their parental characteristics differed significantly. It was even more so among the six Asian ethnic groups (Table 2). Among the six Asian parents groups with either Asian father and/or mother, the Asian Indian group had the youngest mean maternal age (29.7 years), married most (97.1%), smoked least (0.3%) and used alcohol least (0.1%), while the Japanese parents group had the oldest maternal age (32.5 years), married less (94.5%), smoked the most (3.3%) and used alcohol the most as well (1.0%). However, compared to the Asian Indian group, the Japanese group had one quite favorable factor, the highest proportion of adequate prenatal care, 84.0%, compared to 75.4% in the Asian Indian group. Births to the Japanese group had average birthweight, average gestational age, and LBW and PTB rates were all significantly lower, compared to the births to the Asian Indian group. It is notable that among all groups, the Korean group had the worst prenatal care status with a proportion of adequate care of 75.2%. However, births to the Korean group had the most favorable birth outcomes, mean birthweight, mean gestational age, and prevalence of LBW and PTB. Although average birthweight of births to the Korean group was less, 3,329 g, compared to 3,410 g in the White group, other three indices, gestational age, LBW and PTB rates were better than the White group (Table 2). Grouping births with Asian heritage into the six ethnic Asian groups might not be adequate for comparing birth outcomes, since each of these six Asian ethnic groups included the biracial parents groups, White mother/Asian father and Asian mother/White father. And proportion of these three subgroups, Asian mother/Asian father, and two biracial parents groups varied widely among these six ethnic Asian parents groups.
Table 2
Parental characteristics and birth outcomes of 18 subgroups
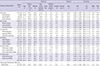
Data expressed as mean (± standard deviation).
GA = gestational age, BW = birthweight, LBW = low birth weight, PTB = preterm birth.
*P < 0.01 compared to White mother/White father group; †0.01 ≤ P < 0.05 compared to White mother/White father group; ‡Medical complications include diabetes mellitus, chronic hypertension, pregnancy-induced hypertension, and eclampsia.
Interracial differentials in mean birthweight of 18 subgroups
Thus, we further divided each of the six ethnic Asian groups by three parental groups, White mother/Asian father, Asian mother/White father, and Asian mother/Asian father, resulting into the 18 ethnic Asian parental groups. Then, we examined birth outcomes of these 18 subgroups with and without adjustment of parental demographic and health characteristics. In general, in births to all 18 Asian parents groups average birthweight was less than the reference White parents group, ranging from 18 g to 295 g (Tables 3 and 4). In these groups, there was a clear and consistent trend that average birthweight was the lowest in births to the Asian mother/Asian father groups, compared to the births to other respective biracial parents groups, White mother/Asian father and White mother/White father groups. Generally, average birthweight in the Korean or Chinese group tended to be higher than the Japanese, Filipino, Asian Indian, and Vietnamese groups. We examined potential impact of variation in parental demographic and health factors among these 18 groups on their difference in birthweight. Adjustment of these parental factors did not change the pattern of difference in birthweight among the births to these 18 groups (Tables 3 and 4).
Table 3
Interracial differentials in mean birthweight and risks for low birthweight and preterm birth of 4 major groups

Each group was compared with White mother/White father group for the multiple linear regression and the logistic regression for mean birthweight and risks for LBW and PTB, respectively. Models are adjusted for maternal education and age, parity, marital status, prenatal care, maternal medical complications, maternal smoking and alcohol use, and paternal age; Medical complications include diabetes mellitus, chronic hypertension, pregnancy-induced hypertension, and eclampsia.
OR = odds ratio, CI = confidence interval.
*P < 0.01 compared to White mother/White father group.
Table 4
Interracial differentials in mean birthweight and risks for low birthweight and preterm birth of 18 subgroups
Each group was compared with White mother/White father group for the multiple linear regression and the logistic regression for mean birthweight and risks for LBW and PTB, respectively. Models are adjusted for maternal education and age, parity, marital status, prenatal care, maternal medical complications, maternal smoking and alcohol use, and paternal age; Medical complications include diabetes mellitus, chronic hypertension, pregnancy-induced hypertension, and eclampsia.
OR = odds ratio, CI = confidence interval.
*P < 0.01 compared to White mother/White father group; †0.01 ≤ P < 0.05 compared to White mother/White father group.
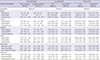
Interracial differentials in risk for low birthweight of 18 subgroups
The risks of LBW and PTB for the 18 parents groups were compared (Table 4). Compared to births to the White parents group, the risk of LBW was lower in births to the Korean and Chinese subgroups and higher in births to the Japanese, Vietnamese, Asian Indian, and Filipino subgroups. This risk was least in births to the Korean mother/Korean father subgroup (OR, 0.80; CI, 0.78, 0.82) and the Chinese mother/Chinese father subgroup (OR 0.87; CI, 0.85, 0.89) and highest in births to the Asian Indian mother/Asian Indian father subgroup (OR, 1.77; CI, 1.74, 1.80) and the Filipino mother/Filipino father subgroup (OR, 1.79; CI, 1.76, 1.83) (Table 4). In Japanese, Vietnamese, Asian Indian, and Filipino subgroups, the risk of LBW was lower with the biracial parents than with the same ethnic Asian parents, while in Korean and Chinese subgroups, this risk was increased with biracial parents than with the same ethnic Korean or Chinese parents. Adjusting parental demographic and health factors did not change the pattern of the risk of LBW among Asian subgroups and also between individual Asian subgroups and White parents group. This adjustment only further accentuated the difference in the risk of LBW from the White parents group, further increasing the risk in Japanese, Filipino, Asian Indian, and Vietnamese groups, while in Korean and Chinese subgroups, this difference in the risk of LBW was narrowed (Table 4).
Interracial differentials in risk for preterm birth of 18 subgroups
Compared to the reference White parents group, the risk of PTB was consistently lower in all Korean, Chinese, and Japanese subgroups, particularly more so in births to the same ethnic Asian parents (Korean, OR 0.63; CI, 0.62, 0.65; Chinese, OR 0.71; CI, 0.70, 0.72; Japanese, OR, 0.72; CI, 0.70, 0.75). However, this risk was not consistent in Filipino, Asian Indian, Vietnamese subgroups except the biracial subgroups with White mother or White father that consistently showed lower risk of PTB than in the White parent group (Table 4). In these latter three Asian subgroups, adjustment of parental factors yielded a consistent pattern of the LBW risk. With adjustment, the risk of PTB in White mother/Asian father subgroups tended to be lower than in the reference White parents group (Filipino, OR, 0.89; CI, 0.85, 0.93; Asian Indian, OR, 0.92; CI, 0.85, 0.99; Vietnamese, OR, 0.89; CI, 0.80, 1.01), while in Asian mother/White father group, this risk was notably higher than the reference White parents group (Filipino, OR, 1.43; CI, 1.39, 1.47; Asian Indian, OR, 1.16; CI, 1.08, 1.25; Vietnamese, OR, 1.27; CI, 1.18, 1.37) and also shown higher in both Asian parents groups (Filipino, OR, 1.37; CI, 1.33, 1.40; Asian Indian, OR, 1.13; CI, 1.11, 1.16; Vietnamese, OR, 1.26; CI, 1.22, 1.30). In Korean, Chinese, and Japanese subgroups, the unadjusted and adjusted risks of PTB were distinctly different from that of other three Asian ethnic groups. Compared to the reference White parents group, the adjusted risk was lowest in the same Asian parents group (Korean, OR, 0.72; CI, 0.70, 0.75; Chinese, OR, 0.78; CI, 0.76, 0.80; Japanese, OR, 0.83; CI, 0.80, 0.87). In these three Asian groups, compared to the White reference group, this risk was somewhat lower in the White/Asian parental groups (Table 4).
DISCUSSION
We studied outcomes of births to Asian parents in the U.S. Compared to the births to White parents, births to Asian parents had less mean birthweight, and variable LBW rates. Birth outcomes significantly differed even within six Asian groups in the U.S. The Korean and Chinese had a very similar pattern with each other, and showed more favorable risk of LBW or PTB than the White or other Asian ethnic groups. On the other hand, births to Filipinos, Asian Indian and Vietnamese had quite higher rates of LBW and PTB than both the White and other Asian groups. This pattern of outcomes had changed little with adjustments of all examined maternal sociodemographic and health factors, except race or ethnicity. This observation indicates that race or ethnicity was an overwhelming factor for the birth outcomes. And it is similarly noted also in births to the biracial parents.
LBW and PTB are major determinants for both neonatal and infant mortality (13). When studied births to Asian mothers in the U.S. as a single group, it had higher rate of LBW, compared to births to non-Hispanic White mothers (1415). However, other studies on Asian subgroups observed differing birth outcomes compared to the White group and within Asian groups (57891011161718). As in our present study, most of these studies consistently found that births to Korean parents had least prevalence of LBW and PTB among births to White and other Asian parents. Births to Chinese parents had a little higher prevalence of LBW and PTB, but slightly higher or lower compared to births to the White parents and consistently lower than other Asian subgroups such as Japanese, Filipino, Vietnamese, and other Asian Pacific Islanders. Magnitude of difference in LBW and PTB outcomes varied among the studies. This was primarily due to the difference in study population by its location, racial or ethnic composition, its sociodemographic characteristics, and size (e.g.; hospital, state, or the U.S. populations). Wong and her associates (10) investigated the difference in birth outcome among various Asian ethnic subgroups, using a large population data, the U.S. births of the year 2003. Results of this study are strikingly similar to those of the present study. In both studies, it is notable that births to Asian Indian parents had lower mean birthweight and higher LBW rate than births to Korean, Chinese, Filipino, and Vietnamese, although Asian Indian mothers more often had better sociodemographic and prenatal care status. Similarly, births to Japanese parents had less mean birthweight and higher prevalence of LBW and PTB than births to either Korean or Chinese parents, while Japanese parents had more favorable sociodemographic status than the other two. In both studies adjusting maternal factors changed little of the gap in birth outcomes among Asian subgroups. These observations suggest that maternal race or ethnicity is the major determinant for birth outcomes among all sociodemographic and health care factors.
In the U.S., rate of interracial marriage is rapidly increasing with its population becoming more racially diverse. In 1970, only one percent of infants had biracial parents. This proportion increased to ten percent by 2003 (19). Nystrom and his associates (11) tested their hypothesis that the perinatal outcomes of interracial Asian-White couples would differ from the same race, Asian or White couples. Further, the outcomes would differ in those with Asian mothers versus Asian fathers. In their study, Asian mother/Asian father group had lower median birthweight and higher risk for LBW compared to the same race White parents or biracial Asian/White parents groups. Their study population was small, a hospital population with 868 births from the interracial couples. Schempf and his associates (12) studied a larger population, births in California and Hawaii in 2003 to 2005. When comparing outcomes of births among the same race parents groups, births to most of Asian subgroups (Asian Indian, Cambodian, Filipino, Hmong, Japanese, Pakistani, Vietnamese, Native Hawaiian, and so on) had higher risk of LBW and PTB than the same race White parents group. Births to the same Korean parents were the only group having lower LBW and PTB risks than the same White parents group. Adjustment of maternal sociodemographic and health care status changed little of this pattern. In their study, 6 of 11 Asian subgroups (Chinese, Filipinos, Japanese, Korean, Thai, and Samoans) multiple race/ethnicity women had higher risks of LBW and PTB than did their single race/ethnicity counterparts. However, this study did not explore potential difference in birth outcomes between Asian mother/White father and White mother/Asian father in biracial parents. Lim and his associates (20) reported differences in mean birthweight, LBW and PTB in births to biracial Korean/other Asian subgroup (Chinese, Vietnamese, Filipino and Japanese) in the U.S. Birth outcomes of Korean mother/Vietnamese or Filipino father subgroup were more similar to the outcomes of births to the same Korean parents group than those of their counter parts, Vietnamese or Filipino mother/Korean father subgroups.
In our study, birth outcomes in births to biracial parents were also demonstrated. Among different biracial Asian/White parents groups, we observed that both maternal and paternal race/ethnicity influenced outcomes of births to the biracial parents. Birth outcomes tended to be more affected with paternal race in White father/Korean, Chinese, Japanese mother subgroups, while maternal race tended to be more influential in Filipino, Asian Indian, Vietnamese mother/White father subgroups. These observations suggest that birth outcomes in biracial parents are affected by both maternal and paternal races/ethnicities and this differential impact on birth outcomes by parents may differ among different race/ethnicity. In addition, we also found that variation of differentials in both birthweights and risks for LBW and PTB among the White mother/Asian father groups was relatively much smaller than that among the Asian mother/White father groups. This finding suggests that maternal impact on birth outcomes might be much more dominant than paternal effect. In general, mean birthweight of infants born to biracial parents is known to be closer to mean birthweight of infants of mother’s race, rather than father’s.
In conclusion, the present and previous studies clearly demonstrate that birth outcomes vary among different race/ethnic groups. In studying birth outcomes of Asian populations or a population with Asian subgroups, the overall estimates of birth outcomes would lead to a misleading conclusion. It should recognize heterogeneous impact of birth outcomes by individual Asian subgroups. The present study attempted to explore the cause(s) for difference in birth outcomes among different race or ethnic groups. Although our study population was ever large enough, detailed data on socioeconomic, demographic, psychosocial, and health conditions beyond the conventional lists were lacking. However, we have to conclude that variation in birth outcomes among different race or ethnic groups cannot be explained solely by their differences in socioeconomic or health care status. It is a case in point that Korean has consistently shown more favorable birth outcomes than Japanese or all racial or ethnic groups in the U.S. Further, Asian Indians in the U.S. have consistently higher undesirable birth outcomes than most Asian subgroups that have more unfavorable socioeconomic and health care status. Studying births to biracial parents may lead into an inquiry for impact of genetics and environments or their interaction on birth outcomes. The present study indicates that among all conventional sociodemographic and health care factors parental race is the most determining factor for the birth outcomes such as birthweight and risks of LBW and PTB. However, causes of and mechanism(s) for these variable birth outcomes among different races would require more extensive and detailed epidemiologic studies and/or possibly joined with appropriate genomic investigations.
 XML Download