

 PDF
PDF ePub
ePub Citation
 Print
Print


INTRODUCTION
Hypertension is an important risk factor for cardiovascular disease and carries significant morbidity worldwide (12). Globally, 54% of stroke and 47% of ischemic heart disease cases can be attributed to high blood pressure (BP). Approximately, 13.5% of total premature deaths and 6.0% of disability-adjusted life years have been attributed to high BP (1). Furthermore, as the prevalence of hypertension is predicted to increase over the next decade (3), it is important to establish the risk factors for hypertension.
Socioeconomic status (SES) is an established clinical indicator of cardiovascular disease; and in developed countries an inverse correlation between these variables has been reported (45). However, studies in populations from developing countries have found a range of correlations between SES and hypertension (678). The Republic of Korea has experienced dramatic westernization and economic growth over recent decades. However, there are no published reports of a comprehensive investigation into the association between SES, the prevalence of hypertension and incident hypertension in Korea.
Education and income status are widely used as parameters to stratify SES in Korea as well as in worldwide (91011121314). Obesity is regarded as a key confounding factor for SES (15), and levels of obesity across SES were markedly heterogeneous and varied with gender and time (1617). Furthermore, obesity trends in Korea have changed over time (1819).
We investigated the association between SES and the prevalence of hypertension and evaluated the potential role of obesity. We also evaluated the effect of a number of SES parameters on the incidence of hypertension after a 4-year follow up.
MATERIALS AND METHODS
Study sample
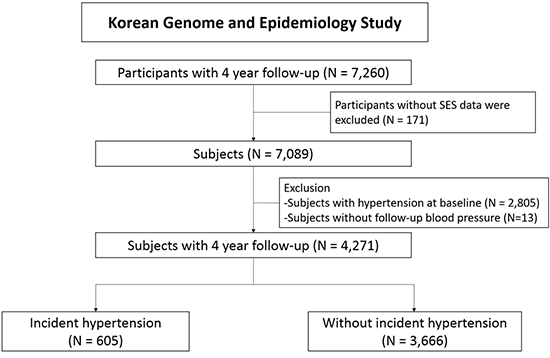
The Korean Health and Genome study, supported by the Korea National Institute of Health, is a prospective cohort study designed to survey the prevalence and risk factors of chronic disease in Korea. The baseline study was performed between 2001 and 2003 and a follow-up survey was conducted every 2 years. Subjects were recruited from urban and rural areas, Ansan and Anseong, respectively. We obtained baseline and follow-up data at 4 years for 7,260 subjects from the Korea National Institute of Health. The details of the cohort have been published elsewhere (202122).
Definition of hypertension
Measurement of BP was taken using a mercury sphygmomanometer following a standardized protocol (23). Blood pressure was measured after a 5-minute rest period and 2 readings were recorded from both arms in the sitting position. Mean systolic and diastolic values were analyzed in this study.
Participants were defined as hypertensive when BP recordings were systolic BP ≥ 140 mmHg and diastolic BP ≥ 90 mmHg (24), or when they were prescribed anti-hypertensive medication. These criteria were also applied to diabetic and chronic kidney disease participants. Incident hypertension was defined as hypertension diagnosed at the 4-year follow-up in a subject who had not diagnosed with hypertension in the baseline survey. We defined an additional prehypertension group in subjects without hypertension where systolic BP ≥ 120 mmHg or diastolic BP ≥ 80 mmHg, for additional risk stratification.
Socioeconomic status variables and other measurements
Education and income levels were used as parameters for SES. The duration of education was stratified into 4 groups: short (≤ 6 years), mid-short (7–9 years), mid-long (10–12 years), or long (≥ 12 years). Social income level was also classified into 4 groups by quartiles according the monthly household income, defined as low (< 500,000 KRW), mid-low (500,000–1,499,999 KRW), mid-high (1,500,000–2,999,999 KRW) or high (≥ 3,000,000 KRW) (At 2001, 1 $ = 1,257 KRW). We classified the income level considering the reported national income data of first semester of 2001 (25). Marital status was classified as unmarried, married or other, which included widowed and divorced. Participant residential area was defined as urban (Ansan) or rural (Anseong).
We collected demographic, medical, and social behavioral data by standardized questionnaires administered by trained interviewers. The body mass index (BMI) was used to assess the degree of obesity in participants. The BMI was calculated as measured body weight (kg) divided by height (meters) squared. Participants were stratified into the following groups based on the BMI (26): underweight (BMI < 18.5 kg/m2), normal weight (BMI between 18.5 and 22.9 kg/m2), overweight (BMI between 23 and 24.9 kg/m2), or obese (BMI ≥ 25 kg/m2). Diabetes was defined as HbA1c ≥ 6.5% in a person previously diagnosed with diabetes mellitus or taking hypoglycemic medication.
We defined cardiovascular disease as the summation of coronary artery disease, myocardial infarction, cerebrovascular accident, peripheral artery disease, and congestive heart failure. High physical activity was defined as high intensity activity > 3 hours per week, such as climbing, running, farming, or playing ballgames.
Statistical analysis
Data were described as mean ± standard deviation for continuous variables, and as numbers and frequencies for categorical variables. For comparisons across groups, the χ2 test or Fisher’s exact test was used for categorical variables and the unpaired Student’s t-test was applied to continuous variables. For the analysis of continuous variables between more than 2 groups, we used the one-way analysis of variance and Scheffé’s post hoc test. The log-rank test was applied to investigate the significant predictor of the prevalence of hypertension and the incidence of hypertension after the 4-year follow-up. Two-sided P values < 0.05 were accepted as statistically significant. Factors indicating significant predictability in univariate logistic regression were used in multivariate analysis. IBM SPSS Statistics version 22 was used to perform statistical tests (SPSS Inc., Chicago, IL, USA).
Ethics statement
This cohort study was conducted in accordance with the Declaration of Helsinki and approved by the institutional review board of the Korea Centers for Disease Control and Prevention, Ajou University Hospital (IRB approval No. AJIRB-CRO-06-039) and Korea University Ansan Hospital (IRB approval No. ED0624). This analysis was approved by institutional review board of Seoul National University Hospital (IRB approval No.1607-102-776). Written informed consent was obtained from all participants.
RESULTS
Baseline characteristics of the study population
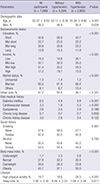
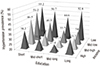
Among 7,260 subjects, we excluded subjects whose data on education or social income level were not available in the baseline survey (n = 171). As shown in Table 1, subjects with hypertension were older, had a shorter education duration and lower social income, and had more comorbidities, such as diabetes mellitus and cardiovascular disease. Interestingly, the association between BMI and education was affected by participant gender (Fig. 1). Male subjects had a higher BMI in longer education duration groups than in the short education duration group (23.4 ± 3.1, 24.3 ± 2.8, 24.5 ± 2.8, and 24.4 ± 2.9, P < 0.001), while females had a lower BMI in longer duration groups (25.3 ± 3.4, 24.8 ± 2.9, 24.4 ± 3.0 and 24.2 ± 3.4, P < 0.001). The positive correlation with BMI in males and the negative correlation in females were reproduced across all income levels.
Table 1
Baseline characteristics of subjects
Relation of education and social income with hypertension prevalence
Baseline patient characteristics stratified according to the education and income level are shown in Supplementary Tables 1 and 2, respectively. The SES stratified according to the duration of education or income level was inversely associated with hypertension (both P < 0.001).
Table 2 shows data adjusting multivariables exclusively to the education and income level, as in previous studies (1011). The duration of the education and the income status proved their predictive value for prevalent hypertension in univariate analysis (P < 0.001); the duration of education consistently proved its prognostic value for prevalent hypertension in multivariate analysis (P < 0.001). In contrast, the predictability of the income level was limited in multivariate analysis (P = 0.305). When education and income level were evaluated with other risk factors, odds ratio according to the SES level were as follows: odds ratio across longer education duration groups were 0.860 (0.719–1.030), 0.676 (0.562–0.812), and 0.755 (0.604–0.944) for mid-short, mid-long, and long education durations, respectively. Odds ratio across higher income were 0.976 (0.810–1.176), 0.849 (0.691–1.042), and 0.918 (0.728–1.157) for mid-low, mid-high, and high income level groups, respectively.
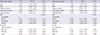
Table 2
Prediction of prevalent hypertension at baseline survey
We used age, sex, history of diabetes mellitus, cardiovascular disease and chronic kidney disease, smoking and drinking history, prehypertension, physical activity, sleep time and BMI to evaluate the association with prevalent hypertension in univariate analysis. Factors which showed significant association in univariate analysis were included in multivariate analysis.
OR = odds ratio, CI = confidence interval, BMI = body mass index.
*Education level and income level were analyzed exclusively to each other.
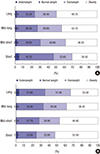
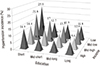
Fig. 2 shows the prevalence of hypertension, stratified according to education and income levels. It demonstrates the inverse relationship between SES and the prevalence of hypertension. Only 36 people were classified as having a long education duration and low income, so the high prevalence of hypertension may not accurately reflect the clinical picture.
The incidence of hypertension to education status and income
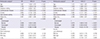
Data on blood pressure follow-up were collected and 13 subjects were excluded because their blood pressure was not recorded. Among the subjects without hypertension at baseline, 605 subjects (14.2%) were newly diagnosed with incident hypertension. Subjects with incident hypertension had more unfavorable baseline characteristics, such as older age, a shorter duration of education, lower income level, and higher BMI (Table 3). The incidence rate of hypertension was 22.0% (short), 14.1% (mid-short), 10.6% (mid-long), and 9.2% (long) at each education level (P < 0.001). The incidence rate of hypertension across the higher income group was 21.8% (low), 17.5% (mid-low), 11.1% (mid-high), and 8.8% (high) at each level (P < 0.001). Factors such as older age, a shorter duration of education, lower income level, higher BMI, and longer time of high physical activity were not only more frequently observed in subjects with incident hypertension as shown in Table 3, but were also significant risk factors of incident hypertension in the univariate analysis (Table 4).
Table 3
Baseline characteristics according to the incident hypertension after 4-year follow-up
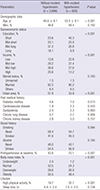
Table 4
Prediction of incident hypertension after 4-year follow-up
We used age, sex, history of diabetes mellitus, cardiovascular disease and chronic kidney disease, smoking and drinking history, prehypertension, physical activity, sleep time and BMI to predict incident hypertension by logistic regression in univariate analysis. Factors which showed significant association in univariate analysis were included in multivariate analysis.
HR = hazard ratio, CI = confidence interval, BMI = body mass index.
*Education level and income level were analyzed exclusively to each other.
Fig. 3 shows the incidence of hypertension simultaneously stratified by education and income level. In multivariate analysis, a serial risk reduction was observed in the long education group compared to the short education group (P = 0.030). In contrast, the association between income status and incident hypertension was weak in multivariate analysis (P = 0.161) (Table 4). When education level and income level were simultaneously evaluated with other risk factors, hazard ratios according to SES level were as follows: hazard ratios for the prevalence of hypertension across longer education durations were 0.757 (0.546–1.048) for mid-short, 0.676 (0.482–0.947) for mid-long, and 0.637 (0.416–0.976) for long education durations. Across higher income levels, these were 1.054 (0.758–1.465) for mid-low, 0.883 (0.606–1.287) for mid-high, and 0.806 (0.519–1.253) for high income levels. Body mass index was also found to be a valuable prognostic marker for incident hypertension (P < 0.001).
DISCUSSION
This study demonstrates significant associations between education and hypertension and between income and hypertension, in terms of both prevalence and incidence of association. However, in multivariate logistic regression, only the association between education and hypertension was significant, unlike the association between income and hypertension.
In developed countries, an inverse association between SES and hypertension has been reported (4927). However, the association between SES and hypertension in developing countries is disputed. One study showed that educational background was not associated with hypertension in China (6). In Ghana, a positive association between income and hypertension was observed (28). Minh et al. (8) found that wealthy men carried a higher risk of hypertension while Vathesatogkit et al. (10) reported that longer education was associated with a significant risk reduction in incident hypertension in Thailand.
These differences might be explained by the different social environment in the countries studied. Our results were consistent with those of an earlier study conducted in Korea where education status was strongly associated with hypertension (1129). We also found that education status had a risk reduction effect on incident hypertension, unlike income status.
SES is regarded as an important clinical indicator because it reflects awareness and knowledge of hypertension (30). In our study, the difference in hypertension awareness among education groups was statistically significant across the duration of education: 36.0%, 30.6%, 29.6%, and 36.3% for short, mid-short, mid-long, and long education durations, respectively (P = 0.011). But this statistical significance was clinically inconclusive because there was no linear association between hypertension awareness and SES even P value was less than 0.05 (Supplementary Table 2).
In the subgroup analysis, there was no statistically significant difference in the incidence of hypertension between subjects whose income improved or deteriorated. We postulated that there were other factors which could explain the association between the incidence of hypertension and SES in Korea; they might be dietary intake or metabolic syndrome (31). In addition, SES itself might affect blood pressure directly as chronic psychological stress via autonomic nervous system and hypothalamus-pituitary-adrenal axis (3233).
Interestingly, high physical activity appeared to be related to higher risk of incident hypertension, as shown in Table 4. This seems to be the opposite direction of association compared to the existing knowledge; there might be protective effects of physical activity onto cardiovascular disease, including hypertension (3435). However, there was a debate that influence on blood pressure was different according to the type of physical activity; work time physical activity or leisure time physical activity (36). In addition, low leisure type physical activity group was reported to have a higher amount of work time physical activity and a lower SES level in Korea (35). As we did not have the information about the type of physical activity, it might be a confounder in this study.
There are several limitations in our study. Firstly, we only included subjects who underwent a 4-year follow-up. People with poor compliance or deteriorating general medical condition who could not complete the 4-year follow-up, were not included in this analysis, therefore we cannot exclude the possibility of selection bias. Secondly, data about education and income were collected only as categorical variables, not by continuous variables; this may have an effect on the statistical significance of SES stratification. Thirdly, direct asking of income level might result in incorrect answering. However, the data we had was similar to the data from the Statistics Korea (25), which reported median level of monthly income as 1,973,587 KRW. Finally, we classified the residential area as urban (Ansan) or rural (Anseong) according to an earlier study (38), however, both cities are relatively large and a simple binary classification could bias the analysis.
In conclusion, our analysis supports that SES is significantly associated with hypertension. This study has showed that the subjects in Korea with a longer duration of education and higher income level demonstrated a lower prevalence and incidence of hypertension over a 4-year follow up. We finally conclude that socioeconomic status, as defined by education level but not by income level, is a significant and independent prognostic factor for hypertension, when the effect of obesity is taken into account.
 XML Download