

 PDF
PDF ePub
ePub Citation
 Print
Print


INTRODUCTION
Nonalcoholic fatty liver disease (NAFLD) is getting great concern in the clinical field of metabolism as well as hepatology. Out of various metabolic diseases, cardiovascular disease, type 2 diabetes, and metabolic syndrome were known to have a strong association with NAFLD (123). As a pathophysiologic mechanism of theses metabolic diseases, the role of insulin resistance (IR) was definitely established in disease occurrence and progression (4). IR also has a pivotal role in the development of NAFLD (56). IR accelerates the release of free fatty acid (FFA) from adipose tissue and their influx into liver, which is one of the accepted theories for the mechanism of NAFLD (7). However, reverse relationship between NAFLD and IR has not been clarified yet. For instance, several questions can be raised. “What is the effect of NAFLD on the development of IR?” or “Was insulin sensitivity actually aggravated under NAFLD with the passage of time?” Although there have been some studies that showed the effect of NAFLD on IR, they were not enough to answer these questions clearly because of their limitations such as small sample size or cross-sectional design (89). Especially, considering that many cases of NAFLD are diagnosed in non-diabetic and non-insulin intolerance state, it is necessary for clinical studies to investigate the effect of NAFLD on insulin sensitivity. These studies may be helpful to set the clinical guideline for the NAFLD patients without currently serious metabolic diseases related with IR. Thus, this study was conducted to examine the clinical association between NAFLD and the development of insulin resistance.
MATERIALS AND METHODS
Study design
A prospective cohort study was conducted to examine the association between NAFLD and the development of IR in Korean men participating in a medical health check-up program at Total Healthcare Center of Kangbuk Samsung Hospital, Sungkyunkwan University, Seoul, Korea. Interpretation for medical health check-up was described in our other manuscript in detail (10).
Study population
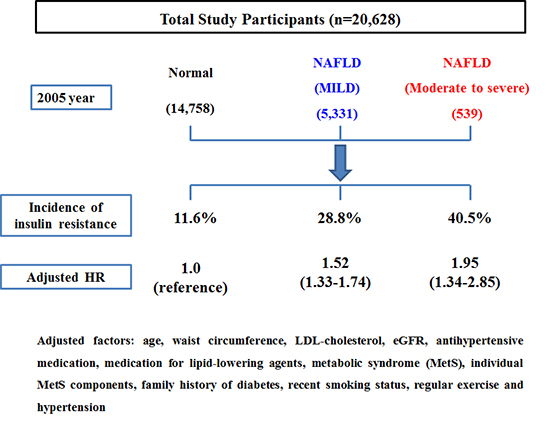
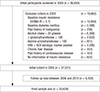
A total of 46,693 men who had examined the abdominal ultrasonography (US) for a medical check-up at Kangbuk Samsung Total Healthcare Center in 2005 participated in this study. Among the 46,693 participants, 19,662 men were excluded based on the following exclusion criteria that might influence insulin resistance or ultrasonography (US) findings of the liver as a result of other liver disease. Participants with presence of IR were also excluded from initial examination. IR was evaluated by homeostasis model assessment of insulin resistance (HOMA-IR), and 10,949 had a baseline IR (HOMA-IR ≥ 2.7) at initial examinations. Because some participants had more than one exclusion criteria, the total number of men eligible for the study was 27,031. Additionally, 6,403 participants were excluded for follow-up loss from 2006 to 2010. Accordingly, 20,628 participants were included in the final analysis and were observed for the development of insulin resistance (Fig. 1). The total follow-up period was 73,311.2 person year and average follow-up period was 3.55 (standard deviation [SD], 1.48) person year.
Clinical and laboratory measurements
Study data included a medical history, a physical examination, information provided by a questionnaire, anthropometric measurements and laboratory measurements. All medical histories including drug prescription were assessed by examining physicians. All participants were asked to respond to a questionnaire on health-related behavior. Questions about alcohol intake included the frequency of alcohol consumption per week and the usual amount per day (≥ 20 g/day). We considered persons reporting that they smoked at that time to be current smokers. In addition, the participants were asked about their weekly frequency of physical activity, such as jogging, bicycling, and swimming that lasted long enough to produce perspiration (≥ 1 time/week).
Diabetes mellitus was defined as fasting serum glucose higher than 126 mg/dL or current medication of blood glucose-lowering agents. Hypertension was defined as the current medication of antihypertensive drug or blood pressure (BP) ≥ 140/90 mmHg at initial examinations.
HOMA-IR was calculated by (fasting serum insulin [μU/mL] × fasting serum glucose [mmol/L])/22.5 (11). The development of IR was assessed from the annual records of all participants, and defined as HOMA-IR value ≥ 2.7 by referring previous studies (101213). The procedures for anthropometric and biochemical measurements from blood samples were described in detail elsewhere (10).
The diagnosis of fatty liver and its degree were based on the results of abdominal US with a 3.5-MHz transducer (Logic Q700 MR, GE, Milwaukee, WI, USA). Abdominal US were carried out by eleven experienced radiologists who were unaware of the aims of the study and blind to the laboratory values. Images were captured in a standard fashion, with the patient in the supine position, with the right arm raised above the head.
The methodology of ultrasonographically diagnosing liver disease was previously described in our other study (14).
Findings meet one of following criteria.
1) Coarse or highly non-homogenous liver parenchymal echotexture
2) Irregular or nodular liver surface (inferior margin of right lobe)
3) Blunted or rounded liver edge
4) Enlarged liver size (> 15 cm in mid-clavicular line) or shrunken liver size (< 10 cm in mid-clavicular line)
5) Enlarged spleen size (> 13 cm)
The degree of hepatic fatty infiltration was evaluated by quantitative grading system conventionally used in radiologic field (171819) as follows:
Normal (grade 0): Hepatic parenchymal echogenicity is usually equal to that of the renal cortex.
Mild fatty liver (grade 1): diffuse slight increase in fine echoes in the hepatic parenchyma with normal visualization of the diaphragm and intrahepatic vessel borders.
Moderate fatty liver (grade 2): moderate diffuse increase in fine echoes with slightly impaired visualization of the intrahepatic vessels and diaphragm.
Severe fatty liver (grade 3): marked increase in fine echoes with poor or no visualization of the intrahepatic vessel borders, diaphragm and posterior portion of the right lobe of the liver.
To assess the intra- and inter-observer reliability of ultrasound diagnosis of fatty liver, a random sample of 200 stored ultrasonographic images was re-read at least two weeks apart by the eleven radiologists. All radiologists were blinded to clinical information. The inter-observer reliability and intra-observer reliability for fatty liver diagnosis were substantial (kappa static of 0.74) and excellent (kappa static of 0.94), respectively.
The presence of metabolic syndrome (MetS) was made according to the joint interim statement of the International Diabetes Federation Task Force on Epidemiology and Prevention (20). Waist circumference (WC) change was calculated as follows: WC change = (WC at censoring time − WC at baseline)/follow-up period (person year).
Statistical analysis
Data were expressed as means (standard deviation) or medians (interquartile range) for continuous variables and percentages of the number for categorical variables.
The one-way ANOVA and χ2-test were used to analyze the statistical differences among the characteristics of the study participants at the time of enrollment in relation to the NAFLD categories. Categories of the NAFLD comprised the following: normal, mild, moderate and severe. Moderate (n = 533, 2.58%) and severe NAFLD (n = 6, 0.03%) was combined into moderate to severe NAFLD category for analyses, owing to the small number of severe NAFLD. The distributions of continuous variables were evaluated, and log transformations were used in the analysis as required. For incident insulin resistance cases, the time of insulin resistance occurrence was assumed to be the midpoint between the visit at which insulin resistance was first diagnosed and the baseline visit (2005). The person years were calculated as the sum of follow-up times from the baseline until an assumed time of insulin resistance development or until the final examination of each individual. We used Cox proportional hazards models to estimate adjusted hazard ratios (HRs) and 95% confidence intervals (CI) for incident insulin resistance comparing the mild and moderate to severe NAFLD categories vs. the normal group. In the multivariate models, we included variables that might confound the relationship between NAFLD and insulin resistance, which include age, WC, WC change during follow-up, LDL-cholesterol, eGFR, baseline HOMA-IR, antihypertensive medication, medication for lipid-lowering agents, MetS, individual MetS components, family history of diabetes, recent smoking status, proper exercise and hypertension.
For the linear trends of risk, the number of NAFLD categories was used as a continuous variable and tested on each model. To use the Cox proportional hazards models, we checked the validity of the proportional hazards assumption. The assumption was assessed by log-minus-log-survival function and found to be graphically unviolated. P values < 0.05 were considered to be statistically significant. Statistical analyses were performed PASW Statistics 18 (SPSS Inc., Chicago, IL, USA).
RESULTS
During 73,311.2 person-years of follow-up, 3,471 (16.8%) incident cases of IR developed between 2006 and 2010.
Compared with analytic cohort (n = 20,628), 6,403 participants not included in analytic cohort were 2.6 years older (45.3 vs. 42.7), and had a less favorable baseline clinical characteristic in systolic and diastolic BP, fasting serum glucose, insulin, eGFR, GGT, MetS, BP ≥ 130/85 mmHg, fasting serum glucose ≥ 100 mg/dL, WC ≥ 90 cm, antihypertensive medication, current smoking status, proper exercise and hypertension. (Supplementary Table 1).
The baseline characteristics of the study participants in relation to the NAFLD categories are presented in Table 1. At baseline, the mean (SD) age, WC and BMI of study participants were 42.7 (7.2) years, 82.3 (7.0) and 23.7 (2.5) kg/m2, respectively. There were clear dose response relationships between all of the listed variables and NAFLD categories except for WC change during follow-up.
Table 1
Baseline characteristics of participants according to NAFLD categories (n = 20,628)
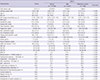
Data are means (standard deviation), medians (interquartile range), or percentages.
NAFLD = non-alcoholic fatty liver disease.
*P value by ANOVA-test for continuous variables and χ2 test for categorical variables.
![]()
In contrast to participants without incident IR, those with incident IR were slightly older (43.8 vs. 42.5) and more likely to have the NAFLD. As expected, all clinical variables showed statistically significant differences between two groups except for current smoking status (Supplementary Table 2).
Table 2 shows the HRs and 95% CI for IR (HOMA-IR ≥ 2.7) according to the NAFLD categories. In unadjusted model, when HRs of normal group for IR was set as reference, HRs of NAFLD groups increased according to the degree of NAFLD (mild group: 2.73 [2.55–2.93] and moderate to severe group: 4.07 [3.54–4.69]) (P for trend < 0.001). These associations were attenuated, but still remained statistically significant, even after further adjusting for covariates in model 1 and 2. In model 2, the adjusted HRs and 95% CI for IR were 1.19 (1.02–1.39) and 1.32 (1.08–1.57), respectively (P for trend < 0.001).
Table 2
Hazard ratios (HRs) and 95% confidence intervals (CI) for the incidence of insulin resistance according to NAFLD categories (insulin resistance: HOMA-IR ≥ 2.7)
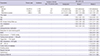
Model 1 was adjusted for age, WC, WC change during follow-up, LDL-cholesterol and eGFR; Model 2 was adjusted for model 1 plus baseline HOMA-IR, antihypertensive medication, medication for lipid-lowering agents, MetS, individual MetS components, family history of diabetes, recent smoking status, regular exercise and hypertension.
NAFLD = non-alcoholic fatty liver disease.
![]()
DISCUSSION
Our study showed a strong association between the degree of NAFLD and the subsequent development of IR. In addition, this association was independent of other metabolic conditions such as age, WC, WC change during follow-up, LDL-cholesterol, eGFR, antihypertensive medication, medication for lipid-lowering agents, MetS, individual MetS components, family history of diabetes, recent smoking status, proper exercise and hypertension. These findings are the most noticeable points of the study corresponding to our study aim. This study was designed to investigate the effect of NAFLD on insulin sensitivity, in the background that these studies must be helpful to research the prognosis of NAFLD. As mentioned above, there have been studies to show the clinical associations between NAFLD and various metabolic diseases such as type 2 diabetes, cardiovascular diseases, and MetS (123). We also found that the risk of type 2 diabetes independently increase under NAFLD in previous study (21). In that study, incidence rate and HRs of type 2 diabetes were significantly associated with the degree of NAFLD. Nevertheless, it is not easy to suggest the definite etiologic mechanisms for these associations. Although IR has been demonstrated as one of significant mechanisms, the theory for the effect of NAFLD on IR was not fully established yet. Accordingly, our study findings may be helpful to understand the pathophysiologic mechanism of metabolic diseases related to NAFLD. In this sense, our study suggests that NAFLD can be the cause of metabolic diseases over simple comorbidity.
There were several studies that showed the effect of NAFLD on IR. Sinn et al. (8) showed the significant association between NAFLD and IR. Their study demonstrated that NAFLD could be an independent predictor for identifying patients with IR in non-obese, non-diabetic, middle-aged Asian adults (8). In addition, Musso et al. (9) reported that NAFLD had the better diagnostic accuracy for IR than MetS did in 197 non-diabetic, non-obese Caucasians. Nevertheless, both studies were not enough to show the causal relation between NAFLD and IR, because of their limitations such as cross-sectional design or small sample size. However, our study was so large scale prospective cohort study with 20,628 participants as to be better for elucidating the association between NAFLD and IR.
As mechanisms of our findings, we can suggest some theories concerning the effects of NAFLD on glucose metabolism. NAFLD is characterized as the histologic findings of damaged hepatocyte resembling alcoholic hepatitis, fibrosis, and fat infiltration (522). Especially, fatty liver infiltration and hepatocyte injury are main features of NAFLD, which can disturb the hepatic glucose metabolism and insulin clearance. Impaired hepatic glucose metabolism and insulin clearance are likely to lead the hyperglycemia and hyperinsulinemia (7). As well known, hyperglycemia and hyperinsulinemia are directly related to IR as main features.
Another is the “lipotoxic” hypothesis. The influx of free fatty acid from the excessive adipose tissue to the peripheral tissues would induce the IR especially, when they infiltrate into liver (723). In short, while IR is predominant cause of NAFLD, developed NAFLD can reversely aggravate IR.
Physical inactivity should be considered as one of major causes for accentuated IR. Our study showed that the rate of regular exercise was inversely related to the degree of NAFLD. This finding agrees well with previous finding that physical inactivity increases the intrahepatic fat content (24). Accordingly, decreased physical activity which induced baseline NAFLD might contribute to the development of IR.
When interpreting our results, some limitations should be considered. First, the presence of NAFLD was assessed by US instead of pathologic method. Although US is regarded reasonable and accurate, it cannot identify fatty infiltration of the liver below the threshold of 30% (25). Therefore, there is possibility of discrepancy between ultrasonographic finding and real NAFLD. However, it was inappropriate to perform invasive test in a population-based epidemiological study (26). In addition, US is a widely used and acceptable modality for diagnosis of NAFLD with high sensitivity (82%–94%) and specificity (66%–95%) (2728). Most of all, all examinations were carried out by experienced radiologists using widely established methods and criteria. Thus, despite of this limitation, US might be more clinically reasonable modality to diagnose NAFLD in this study.
Second, our study population was only limited to Korean men. Thus, the results of this study cannot be necessarily extrapolated to women and other ethnic groups and further studies are needed.
Third is the controversy as to the clinical acceptability for cut off value of IR. In this study, we adopted HOMA-IR ≥ 2.7 into indicator of IR. Although HOMA-IR has been widely used as reliable indicator of IR, the definite cut off value is in debate. Additionally, several studies for Asians adopted cut-offs less than our cut-off in defining insulin resistance (2930). However, HOMA-IR was accepted as a reproducible and reliable tool in the assessment of IR alternative to glucose clamp or other sophisticated techniques in epidemiologic settings (31). Several studies also demonstrated the clinical adequacy of HOMA-IR ≥ 2.7 as a marker of IR (101213). Accordingly, considering the predictive role of HOMA-IR, it is probable that NAFLD affected the development of IR. Additionally, since we were concerned about the impending risk for insulin resistance in study population with HOMA-IR a bit less than 2.7, we included baseline HOMA-IR in adjusting covariates. We could see the maintained statistical significance even after adjusting for baseline HOM-IR, which suggests the clinical significance of our cut-off, HOMA-IR ≥ 2.7 in determining insulin resistance. Nonetheless, we recognize that the debate for cut-off of HOMA-IR attenuates the generalizability of our finding.
In conclusion, our findings, which were obtained from a large cohort, showed that insulin sensitivity was more potentially aggravated under NAFLD. In addition, the risk of IR increased according to the degree of NAFLD independent of other metabolic conditions. Considering the effect of IR on metabolic diseases, our study may be helpful to understand the clinical association between NAFLD and metabolic diseases.
 XML Download