

 PDF
PDF ePub
ePub Citation
 Print
Print


INTRODUCTION
Sleep is a complex amalgam of physiologic and behavioral processes. Sleep quality affects our mental state, physical status and social interactions. Low sleep quality or lack of sleep undermines recovery of human body function, thus weakening the immune system and endocrine system function (12). Excessive or insufficient sleep could be a marker of mediocre health and quality of life in the elderly (3). Specifically, elderly who report more than eight hours or less than seven hours of sleep per day exhibit increased risk of all-cause mortality (4) and various diseases such as coronary disease (5), hypertension (6), obesity (7), depression (8), and fall (9). Some longitudinal studies indicate chronic sleep disturbance as a risk factor for developing anxiety and depression (1011). In addition, a clinical study has reported that sleep disturbance is correlated with diffused pain sensitivity in arthritis patients (12).
Gender is an important determinant in human health, and there is a clear pattern for sex-specific prevalence of various mental and physical disorders. A study on individuals between the age of 25 and 29 has shown that there is no gender difference in dimension of short sleep (13). Men's sleep was more likely to be affected by their work role, while women's sleep was influenced by their work and family role. In addition, they found that the gender difference in sleep problems was associated with time use, and especially the social roles that men and women occupied (13). In a study of 8,578 men and women between the age of 16 and 74, women were significantly more susceptible to sleep problems than men, as gender differences in social economic status inequalities play a major role (14). Some epidemiological studies have shown that sleep disturbance in older women lead to greater risk of cardiovascular disease than older men (15), and short sleep duration is found to be significantly associated with prevalence and incidence of hypertension only in middle-aged women (16).
Elders have a higher prevalence of sleep disturbance than general adult population. In this study, we conducted to elucidate whether gender difference in sleep quality and what factors can affect sleep quality among elderly in South Korea.
MATERIALS AND METHODS
Sample population
The study population is part of the Hallym Aging Study (HAS), which is a population-based prospective cohort study among 45 years and older in Chuncheon, a small city of Korea. HAS started in 2003, with follow-up examinations performed in 2007 and 2010. The city was divided into 1,408 areas based on the 2000 census and 200 areas were randomly selected. A total of 1,520 subjects were systematically sampled: 30% of the subjects were 45 to 64 years of age while individuals aged 65 years or older occupied 70% of the sample size. Among them, 918 subjects agreed to participate in clinical examinations and completed face-to-face interviews at baseline in 2004. In 2007 and 2010, only 547 and 382 subjects, respectively, responded to the survey because some participants were withdrawn due to death, refusal, contact loss, or relocation. Demographic information, medical history, behavior, psychology, and physical activities and function were obtained from structured questionnaires via face-to-face meetings by trained interviewers. In this study, data from a total of 382 participants (175 males and 207 females, 16.2% participants were less than 65 years) were analyzed. Details of the selection method are described in a previously published article (17).
Measurements
Demographic characteristics
The average monthly income for families was divided into less than 50, 50–149, 150–249 and more than 250 (unit: 10,000 won). Duration of education was divided into illiteracy, 0 to less than 6 years (0 years applies to subjects who have not attended school, but could still read and write), 6 years, and more than 6 years. Smoking and drinking status were categorized as current, past or never. All subjects were also divided bilaterally according to their exercise frequency.
The Pittsburgh Sleep Quality Index (PSQI)
We utilized the Pittsburgh Sleep Quality Index (PSQI) to measure sleep satisfaction. Trained interviewers were familiar with the PSQI questionnaires through practices and completed all questionnaires between 5 and 10 minutes. PSQI assessed sleep quality during the previous month. It was composed of 19 items covering seven major domains including subjective sleep quality, sleep latency, sleep duration, habitual sleep efficiency, sleep disturbances, use of sleeping medications and daytime dysfunction. Subjective sleep quality and sleep duration were assessed by one question having four-point scales from excellent to very poor and > 7 hours to < 4 hours, respectively. Sleep latency was calculated from two questions regarding falling asleep time and frequency of difficulty falling asleep. Sleep disorders were evaluated by nine questions focusing on the situations that affect sleep including waking up at night and in the early morning at ease, getting up to the toilet at night, difficulty in breathing, cough or snore frequency, feeling cold, feeling hot, nightmares, pain and discomfort, and also other effects of sleep. Each question was rated on a 4-point Likert scale: none, less than once per week, once to twice per week, three or more times per week. Use of sleeping medications and daytime dysfunction were also rated on a 4-point scale. Each domain score ranges from 0 to 3 (no difficulty to severe difficulty) and all seven domain scores are summed up to obtain one global score range from 0 to 21. Higher scores indicate poorer subjective sleep quality (PSQI global score > 5 suggests sleep disturbance) (18).
Anthropometric measurements
Blood pressures were the average values checked from arms at the beginning and end of the interview. Subjects who had hypertension were defined by disease history if they answered that they had been diagnosed with hypertension by a physician or systolic blood pressure higher than 140 mmHg or diastolic blood pressure higher than 90 mmHg. Likewise, diabetes was defined by disease history if subjects answered that they had been diagnosed with diabetes by a physician or if they had more than 126 mg/dL of fasting blood sugar levels. Other diseases were assessed by subjects’ self-reporting if they had been diagnosed by a physician.
Depression and stress status
Depression status of the participants was evaluated by geriatric depression scale (GDS). It was translated into Korean by Jung et al. (19), and the Chronbach’s α was 0.88. This scale consists of 30 items including 16 negative questions and 14 positive questions that examine powerlessness, worry, fear, anxiety, unfortunately, cognitive decline and reduced activity. Each question answered as yes was scored one while no was scored zero. The total score range was 0 to 30 with higher scores indicating more severe depression. A score of less than 14 suggests normal while 14–18 score indicates distrust, 19–21 score shows mild distrust, and score of 22 and above indicates severe depression status.
Level of stress was assessed by one specific question, ‘Did you have a mental or physical breakdown in the last month?’ Three common answers included never, occasionally or often.
Cognitive impairment
Cognitive impairment of participants was evaluated by Korean-Mini Mental State Examination (K-MMSE). It was translated by Kang et al (20). and has a total of 23 items with 30 possible points including time-orientation (5 points), place-orientation (5 points), memory registration (3 points), concentration and calculation (5 points), reminiscence (3 points), language (8 points), and visual organization (1 point). A total score of 0–19 point indicates dementia, 20–23 point suggests probable dementia while 24 point and above is considered normal.
International Prostate Symptom Score
The International Prostate Symptom Score (IPSS) questionnaire has seven questions on lower urinary tract (LUT) symptoms (incomplete emptying, frequency, intermittency, urgency, weak stream, straining and nocturia) and one question for quality of life (QoL). LUT questions were scored from 0 (none) to 5 (always) while QoL question was scored from 0 (delighted) to 6 (terrible) and we used LUT question scores in this study. Score from 0 to 7 indicates mild, 8–19 suggests moderate and 20–35 means severely symptomatic (21).
Statistical analysis
Data were expressed as mean and standard deviation (SD) for continuous variables. The test of normality was verified by Shapiro-Wilk test (P value > 0.05 indicates the variable has a normal distribution). For results with P value < 0.05, we used Mann-Whitney U test to describe the significance of the sleep quality global score distribution. Comparison of the other continuous variables (age) was performed by Student’s t-test while categorical variables were statistically evaluated by χ2 test. Sleep quality segregated by gender was calculated by PROC GLM program. Odds ratios (OR) for risk of poor sleep status were computed by logistic regression analysis after adjusting for potential covariates. P value less than 0.05 was considered statistically significant and data analyses were performed by SPSS version 21.0 (SPSS, Inc., Chicago, IL, USA).
RESULTS
General characteristics
Table 1 shows demographic and clinical characteristics of the subjects. The mean age of men and women were 73.5 ± 7.64 years and 71.4 ± 7.81 years, respectively. A higher percentage of the male subjects felt that they had good quality of sleep compared to women (61.4% vs. 46.3%). In terms of monthly family income, more men were distributed in the middle level while most women were distributed in the lower level. More men had longer education years than women did. More men were current smokers and alcohol consumers while more women did not exercise regularly. About 60% of men had no signs or symptoms of depression and exhibited normal cognitive status in comparison with 36.7% of women.
Table 1
General characteristics of the subjects
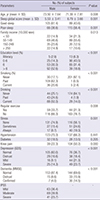
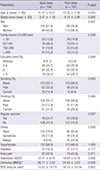
Table 2 summarizes characteristics of the participants according to their sleep quality. In this population of community-dwelling older adults, 61.4% of the male and 43.6% of female participants had good sleep. The distribution of income, smoking and chronic diseases showed statistically significant difference in sleep quality. The poor-sleep group had a higher rate of depression but interestingly, had lower percentage of dementia when compared to the good-sleep group. No statistically significant difference was observed between the two groups for chronic diseases (hypertension and diabetes). As expected, the global score of sleep quality was higher in poor-sleep group compared to good-sleep group.
Table 2
Comparison between poor and good sleep quality
The components of PSQI
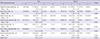
PSQI has seven components, each component was scored from 0 to 3 (no difficultly to severe difficulty). When a component score was ≥ 2, it indicated sleep disturbance. In this study, poor subjective sleep quality was 20.0% and 33.8%, sleep latency was 32.4% and 42.1%, sleep duration was 35.4% and 45.1%, habitual sleep efficiency was 13.3% and 16.1%, sleep disorders were 17.7% and 24.2%, use of sleep medication was 3.4% and 4.3%, daytime dysfunction was 18.3% and 28.0%, respectively in men and women. The prominent problems were sleep duration, sleep latency, subjective sleep quality in both genders, but use of sleep medication was not very high. In addition, there were more women who had sleep disorders and poor daytime dysfunctions. The total PSQI scores of women (6.79 ± 3.61) were significantly higher than men (5.53 ± 3.41). Five components of PSQI which are subjective sleep quality, sleep latency, sleep duration, sleep disorders, daytime dysfunction had significant differences between males and females (Table 3).
Table 3
Comparison of components of PSQI by gender
Risk factors of sleep quality by gender
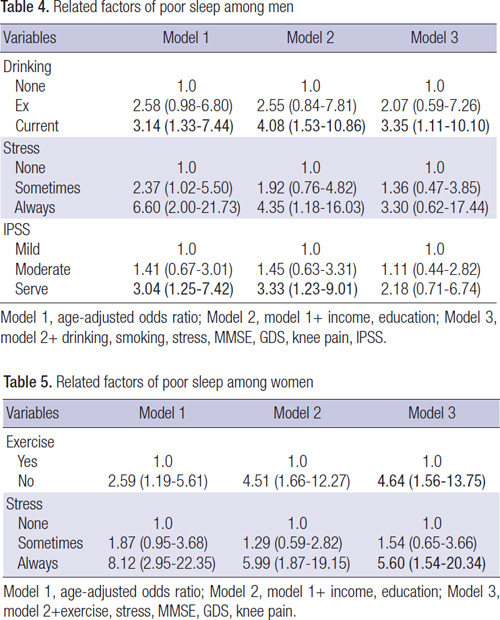
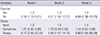
The results of the logistic regression analysis were shown in Tables 4 and 5. It was performed to investigate the relationship between sleep quality and some related factors. Model 1 tested the contribution of each single variable after age adjustment for sleep disturbance. Model 2 tested the contribution of each single variable to sleep disturbance after controlling for income and education. Model 3 added other factors including life behavior, mental status, and depression.
Table 4
Related factors of poor sleep among men
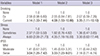
Table 5
Related factors of poor sleep among women
After adjusting for age, education, smoking, drinking, stress, MMSE, GDS, knee pain and IPSS, alcohol consumption among men was a risk factor of poor sleep. Current drinkers were 3.35 times more likely to suffer from poor sleep than non-drinkers (95% CI = 1.11–10.10) in males (Table 4).
In females, lack of exercise was a risk factor of poor sleep. Non-exercisers were reported to be 4.64 times more likely to experience poor sleep (95% CI = 1.56–13.75) than regular exercisers. Stress was another important risk factor of poor sleep for females as stress is correlated with 5.60 times higher chance of poor sleep (95% CI = 1.54–20.34) (Table 5).
DISCUSSION
Sleep problems have beset people of different ages and they are very common in the elderly. The incidence of sleep disturbance is increasing with age (22). Our study showed sleep disturbance is common in women, which was similar with another study result (23). Previous study showed shrinkage of the ventrolateral preoptic nucleus (VLPO) with advancing age may explain sleep deficits in elderly humans (24). Of the parameters measured, only the volume and cell number of the sexually dimorphism nucleus in preoptic area (SDN-POA) showed a dramatic decrease with aging. In males, a major reduction in SDN-POA cell number was observed between the ages of 50 to 60. In females, cell death was found to be more prominent than in males, especially among old people (25).
While not all stress is bad, exposure to chronic stress can cause both physical and psychological harm. People may feel stress differently and exhibit a variety of symptoms including headaches, sleeplessness and depressed mood (26). Not surprisingly, stress is one of the main factors affecting sleep. The stress response is a comprehensive expression of the body against environmental pressure through hypothalamic pituitary adrenal axis activity. When stress arises, the endocrine system activity leads to hypothalamic-mediated secretion of corticotropin-releasing factor. This hormone activates pituitary and adrenal glands to secrete stress hormones, which induce a state of alertness, thus increasing sleep disturbance (27). Men and women tend to react differently with stress, both psychologically and biologically. Some epidemiological studies had demonstrated that women experience more anxiety, depression and stress than men (28). Based on a series of researches, psychologist Shelley Taylor (29) has pointed out gender dictates different responses to environmental pressure. She believes that this difference originated a long time ago and has changed through human evolution. Women are negatively affected by interpersonal events more easily than men. Men and women have different neural activation, where men possess asymmetric prefrontal activity while women have primarily limbic activation (30). Consistent with this finding, only women showed a relationship between sleep and stress in this study.
Since a long time ago, people have begun to care about the relationship between sleep and alcohol. A little of alcohol seems to help induce sleep and help people to sleep more deeply for a while, but some studies also showed that irrespective of the alcohol doses, drinking before going to bed can reduce onset latency of sleep, consolidate sleep and increase electroencephalogram power densities in the delta frequencies during NREM sleep, especially before the middle of the night (31). Another longitudinal study of 20 years discovered the impact of low-level alcohol consumption on cognitive function. Specifically, study results showed that despite a lack of performance difference, young adults who used alcohol on a regular basis differ significantly from non-users with respect to their neural activity (32). Our results showed that alcohol can affect sleep quality but only in men, but this observation might be due to less women drinking alcohol. Although we did not determine exactly when the participants consumed alcohol, it is a well-known Korean custom and habit to drink in the evening or at night.
Regular physical activity has been associated with better sleep through multiple physiological and psychological pathways (33). Kubitz et al.’s study (34) showed that regular exercise was commonly found to be associated with increased slow wave sleep, enhanced total sleep time and decreased REM sleep. Exercise training induces significant improvement in subjective sleep quality in postmenopausal women. Even a low dose of exercise resulted in greatly reduced odds of having significant sleep disturbance (35). In middle-aged and older people with sleep problems, studies have indicated that exercise training has a moderate beneficial effect towards sleep quality, sleep latency and medication usage (36). Our results showed that exercise can affect sleep quality only in women. A previous study has examined and demonstrated the influence of physical exercise on sleep in patients with sleep disturbances than in good sleepers (37). There are more women who have sleep disturbance, thereby we can deduce that women are more sensitive to exercise than men.
IPSS was a useful tool for evaluating urinary symptoms. In our study, prostate symptoms of men as a single factor affected sleep quality but after adjusting for covariables, the significant difference disappeared. IPSS mainly inquired subjective symptoms and the impact of living status. The study by Tanaka et al. (38) indicated that nocturnal urinary frequency only caused disturbance in sleep maintenance, but did not cause any other sleep disturbance directly in healthy aged men. Another previous study showed that nocturia may be the strongest risk factor of sleep disturbance while other irritative and obstructive lower urinary tract symptoms also correlated with severe sleep disturbance (39). Specifically, after adjusting for the frequency of nocturia, obstructive symptoms tended to predict, albeit modestly, worsening Jenkins Sleep Scores and insomnia. Hence these data suggest that nocturia may not be the only significant predictor of sleep disturbance.
The strength of this study is that the data of males and females were analyzed separately. According to the results, we can take the appropriate intervention to improve the sleep quality by gender. However, since this study is cross-sectional, it is difficult to explain the direction of cause and effect between sleep disturbance and some factors. While sleep quality is susceptible to multiple factors, our data are not exhaustive of all factors. Some variables sleep, depression, mental status, stress, exercise and so on checked by subjective questionnaire, it can affect our result. Another weakness of our study includes its small sample size, thus not necessarily applicable to all of the elderly.
In summary, sleep quality appears to be associated with drinking in men elderly and less exercise and more stress in women elderly. Further researches are needed to clarify these associations in prospective studies with large population.
 XML Download