

 PDF
PDF ePub
ePub Citation
 Print
Print


INTRODUCTION
There have been several studies about the association between body composition components and bone mineral density (BMD) (12345). These studies focused on the total body composition and showed different results according to the surveyed populations or measuring methods with reflecting the necessity of purpose oriented study design. The Farmers' Cohort for Agricultural Work-related Musculoskeletal Disorders (FARM) Study was designed to elucidate the work-related musculoskeletal disorders and their related factors, particularly for lumbar spinal disorders among Korean farmers, and to identify their pathophysiological association as background evidences for the developing coping strategies to improve the spinal stability (6).
The mechanical stress exerted by muscle action on the bone mass may have increased the muscle-mediated skeletal dynamic load and spinal BMD (7), which was explained by the bone modelling performed by the osteocyte mechanoreceptors as a result of the muscle contraction induced tension on the bone (8). Moreover with regards to the trunk muscle mass, the abdominals and lumbar paraspinal muscles play important roles in providing stability and facilitating the functional movement of the back, as well as providing stability of the trunk during activities of daily living (9). Trunk fat mass also has been studied widely because of the osteogenic potential of adipose-derived cells (10), as well as its role in producing estrogen from androgen, lowering serum osteocalcin concentration, and cushioning against bone trauma (11).
Based on these concepts, the spinal BMD should be considered as a qualification method for assessing the passive musculoskeletal system in maintaining spinal stability (12), and the trunk body composition consisting of muscle and fat mass also has to be considered as subsystem actively involved in spinal stabilization (91011). Because these passive and active spinal stability systems are functionally interdependent, this cross-sectional analysis of FARM study purposed to prove the association between trunk body composition and spinal BMD in Korean farmers.
MATERIALS AND METHODS
Participants
The first wave (September 2013 to June 2014) and the second wave (October 2014 to March 2015) of FARM study, designed to assess the musculoskeletal disorders of Korean farmers, were conducted by the Center for Farmers' Safety and Health at the Kangwon National University Hospital and supported by the Korean Ministry of Agriculture, Food and Rural Affairs since 2013 (6). This study is a cross sectional result of the longitudinal FARM study. Among the 1013 farmers who were involved in the first wave of the FARM study (September 2013 to June 2014), we contacted 857 active farmers based on their agriculture-related activity (≥ 30% of total activity), agricultural income (≥ 30% of total income), and cultivated land area (≥ 991.7 m2) for possible participation in this study. After excluding 318 farmers based on their refusal to participate (n = 308), change of residence (n = 5), contact disruptions (n = 4), and death (n = 1), a total of 539 farmers were secondarily recruited. After excluding those with a history of spinal surgery, 523 active eligible farmers were grouped into groups I (259 male), IIa (44 premenopausal females), and IIb (220 postmenopausal females), based on their gender and menopausal status, when applicable (Fig. 1). Factors such as age, sex, and anthropometric measurements such as height (cm), weight (kg), and body mass index (BMI, kg/m2) were used for demographic and regression analysis.
Spinal bone mineral density
Spinal BMD (g/cm2) was measured at the L4 level, which was estimated by dual-energy X-ray absorptiometry (DXA, Lunar DPX-L pencil beam scanner). Coefficients of variation of DXA in our laboratory, as determined by double measurements in healthy individuals, were less than 1.0% for the spine. Scans were analysed using processing software (en CORE version 13.31, GE Healthcare, Madison, WI, USA). One experienced technician performed the scans and provided all the interpretations.
Trunk body composition
Cross-sectional computed tomography scans (MX 8000 IDT; Philips Medical Systems, Cleveland, OH, USA) were acquired at the mid-L4 vertebral level with a 10-mm slice thickness. Coefficients of variation of CT in our laboratory were 0.4% for fat and 0.2% for the muscle area. In terms of lean body mass, the total trunk muscle mass (TMM, cm3) was segmented using the standard Hounsfield unit (HU) ranges for skeletal muscles (-29 to +150). Spinal back muscle mass (BMM) was computed by manually outlining the psoas and paraspinal muscles. Abdominal wall muscle mass (AMM) was calculated as TMM-BMM. In terms of the adipose tissue, total trunk fat mass (TFT, cm3) was segmented using standard HU ranges for adipose tissue (-190 to -30) (13). Visceral fat mass (VFM) was computed by manually outlining the inner abdominal wall. Subcutaneous fat mass (SFM) was calculated as TFT-VFM. These areas were determined using image processing software (extended brillance workspace version 4.5.3, Philips Healthcare Nederland B.V.). One expert technician performed all the scans and the image processing.
Statistical analysis
To show the differences between age groups, we put together group IIa and group IIb as group IIa + IIb. ANOVA with Tukey post-hoc analysis was performed in order to identify the serial changes in demographic data and the results of spinal BMD and trunk body composition between each age groups (40-50 years old, 50-60 years old, 60-70 years old, and ≥ 70 years old), and gender groups (I, IIa, and IIb). Chi-square analysis was performed in order to show the association between the gender groups and the BMD classification. Pearson's correlation coefficients between each component of the trunk muscle and fat masses, and spinal BMD based on each gender group were analyzed to show their associations. To analyze the gender-specific association between trunk body composition and spinal BMD, multivariate linear regression (enter) analyses were performed with spinal BMD as dependent variable for each group separately with adjusting for height or age which showed significant results within group analysis. All data were analyzed using the Statistical Package for the Social Sciences, version 20.0 (SPSS, Chicago, IL, USA).
Ethics statement
The present study protocol was reviewed and approved by the institutional review board of Kangwon National University Hospital (IRB No. 2013-06-009-007). Informed consent was submitted by all subjects when they were enrolled. This is a cross sectional analysis of prospective cohort study, registered at the Clinical Research Information Service (CRIS, http://cris.nih.go.kr), number KCT0000829.
RESULTS
Comparison of the demographic characteristics
Table 1 shows the baseline demographic characteristics of the study participants. The heights of both genders were serially decreased with aging. The body weight and BMI of the participants in the 40-50 years old age group were significantly higher compared to all the other older age groups, while there were no significant generation differences in group IIa+IIb. The age was youngest in group IIa and oldest in group IIb. Group I participants were taller and heavier compared to participants in groups IIa and IIb (P < 0.001). There were significant differences only in height (P = 0.029) not in weight (P = 0.774) between groups IIa and group IIb. BMI showed no significant differences among the gender groups (P > 0.05).
Table 1
Comparison of the demographic characteristics of the study groups
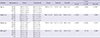
Group I, males; Group IIa, premenopausal females; Group IIb, postmenopausal females.
Statistical significances were tested by one-way ANOVA test of variances among generation based on Tukey multiple comparison, and "*, †, ‡, §, ∥, and ¶" same character means that statistically significant difference (P < 0.05 or P < 0.01) between the generations within gender groups.
![]()
Comparison of the results of the trunk body composition and spinal bone mineral density evaluations
The results of the trunk body composition evaluated by computed tomography and the spinal BMD evaluated by dual-energy X-ray absorptiometry are presented in Table 2. Within gender groups, there were significant serial decreases in all muscle mass components such as TMM, BMM, and AMM in groups I and group IIa+IIb, while in terms of fat mass only VFM showed significant serial increases in group IIa+IIb. Between gender groups, group I showed higher levels of TMM, BMM, and AMM compared to groups IIa and group IIb (P < 0.001). The TMM and BMM of group IIa were significantly higher than those of group IIb. TFM was higher in group IIb compared to that of group I (P < 0.001). VFM and SFM were highest in groups I and IIb, respectively. The VFS of group IIb was higher compared to group IIa (P = 0.006). However, this was not observed with the SFM (P = 0.647).
Table 2
Comparison of the results of the trunk body composition and spinal bone mineral density evaluations between study groups
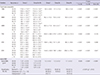
Group I, males; Group IIa, premenopausal females; Group IIb, postmenopausal females; TMM, total trunk muscle mass; BMM, back muscle mass; AMM, abdominal wall muscle mass; TFM, total trunk fat mass; VFM, visceral fat mass; SFM, subcutaneous fat mass; BMD, bone mineral density.
Statistical significances were tested by one-way ANOVA test of variances among generation based on Tukey multiple comparison, and "*, †, ‡, §, and ∥" same character means that statistically significant difference (P < 0.05 or P < 0.01) between the generations within gender groups. Chi-square analysis showed the higher incidence of osteoporosis in Group IIb (χ2 = 24.0, P < 0.001).
![]()
Spinal BMD of the 40-50 years old age group was higher than that of 60-70 years old age group in Group IIa+IIb. There were no significant generation differences in spinal BMD in group I. Additionally, group IIb participants showed significantly low levels of spinal BMD compared to groups I and IIa (P < 0.001). There were no differences in spinal BMD between groups I and IIa (P = 0.520). Chi-square analysis showed that more participants in group IIa had normal BMD (81.8%) compared to those in groups I (59.1%) and IIb (47.3%). Group IIb participants had a higher incidence of osteoporosis (χ
2 = 24.0, P < 0.001).
Association between spinal bone mineral density and trunk body composition
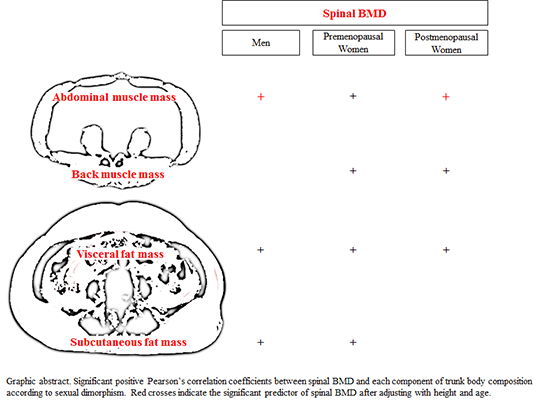
The correlation pattern between spinal BMD and trunk muscle mass and fat mass are presented in Figs. 2 and 3, respectively. Spinal BMD was significantly correlated with TMM (r = 0.360, P < 0.05; 0.26, P < 0.01, respectively), BMM (r = 0.304, P < 0.05; 0.172, P < 0.05) and AMM (r = 0.324, P < 0.01; 0.272, P < 0.01) in groups IIa and IIb, and AMM (r = 0.181, P < 0.01) in group I, respectively. It was not correlated with both TMM (r = 0.090) and BMM (r = -0.02) in group I. In terms of trunk fat mass, there were significant correlations between spinal BMD and TFM (r = 0.165, P < 0.01; 0.424, P < 0.01, respectively), VFM (r = 0.156, P < 0.05; 0.323, P < 0.05) and SFM (r = 0.142, P < 0.05; 0.401, P < 0.01) in groups I and IIa, and VFM (r = 0.132, P < 0.05) in group IIb.
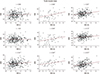 | Fig. 2Pearson's correlation coefficients between each component of the total trunk muscle mass (TMM, cm3), back muscle mass (BMM), and abdominal wall muscle mass (AMM), and spinal bone mineral density (BMD, g/cm2), according to sexual dimorphism.
*P < 0.05, †P < 0.01.
|
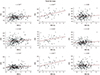 | Fig. 3Pearson's correlation coefficients between each component of the total trunk fat mass (TFM, cm3), visceral fat mass (VFM), and subcutaneous fat mass (SFM), and spinal bone mineral density (BMD, g/cm2), according to sexual dimorphism.
*P < 0.05, †P < 0.01.
|
Table 3 presents the results of multivariate linear regression for the predictor variable of spinal BMD. In both unadjusted and adjusted by age or/and height, there a clear trend toward increased in AMM associated with increased spinal BMD in Group I and IIb, whereas increased BMM was related to decreased spinal BMD after adjusting with height, or age and height in Group I.
Table 3
Multivariate linear regression (enter) results of trunk muscular effects on spinal bone mineral density, unadjusted and adjusted models.
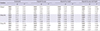
Group I, males; Group IIa, premenopausal females; Group IIb, postmenopausal females; TMM, total trunk muscle mass; BMM, back muscle mass; AMM, abdominal wall muscle mass; TFM, total trunk fat mass; VFM, visceral fat mass; SFM, subcutaneous fat mass; BMD, bone mineral density.
![]()
DISCUSSION
Similar to previous studies assessing the association between body composition and BMD, this study identified sexual dimorphism in the relationship between trunk body composition and spinal BMD. The new significance of this study is that in addition to sexual dimorphism between body composition and BMD, the sub-categorical association between trunk body composition and BMD were considered. We hypothesized that there may be a close association between trunk body composition and spinal BMD, and attempted to figure out the individual associations between the components of muscle or fat mass and spinal BMD. Based on the results, trunk muscle and fat mass are closely associated with spinal BMD, and abdominal muscle mass is important predictor for spinal BMD in male and post-menopausal female farmers.
Body composition method is usually used in the two-component method, which divides the body into muscle and fat mass (14). Previous studies regarded these components as a whole mass without acknowledging the dynamic subdivision into the body composition components (2347151617). However, the dynamic muscle components of the spine have specialized roles in segmental stabilization and primary spine movement even though trunk muscles work together in a coordinated fashion for optimal trunk stability and function (18). Moreover, comparison of visceral and subcutaneous adipose derived cells showed a variety of osteogenic potentials according to their anatomical site (10). Accordingly, subdivision of the trunk body composition in detail should be performed in order to show the role of the trunk body composition components in association with spinal BMD.
The association between muscle mass and BMD was relatively consistent. Muscle mass was the strongest predictor of BMD at all ages for Chinese men and women (5), and the main composition contributor to bone mass in young, healthy, non-obese young Romanian women (17), and a significant contributor to femoral BMD in perimenopausal women (19). Generally, fat mass has been regarded as strong predictor for BMD in females than in males, while muscle mass in both genders (2021). Sexual dimorphism was explained by the gender differences in the bone-muscle relationship such that bone and muscle have a common embryogenesis and both components are regulated and controlled by the same hormones and genes (22). However, in this study, only AMM, not BMM, was associated with BMD in both genders, and only VFM, not SFM, was associated with BMD in female farmers, showing different association trend compared to previous studies, which studied whole body fat and muscle masses by DXA. In other aspect, clinical importance of AMM and VFM in maintain spinal BMD could be considered, and practically, exercise to build up the AMM might be considered. However, VFM has been known as disease promotor (23). Thus, simple view about the association BMD and VFM should be avoided.
Regarding the role of trunk muscle mass for spinal BMD, the positive correlation between AMM and spinal BMD indicates the importance of the mechanical active exertion by the AMM with spinal motion (24). In terms of male, there were absolutely higher mass in trunk muscle and fat mass in male compared to female farmers. However, male farmers did not show generation differences in BMD, and only AMM was associated with spinal BMD. In terms of female, even though both AMM of pre- and postmenopausal females were correlated with spinal BMD, only AMM in postmenopausal female was the associated predictor for spinal BMD. The fact that there was serial decrease in muscle mass and spinal BMD with aging in female farmers may implicate the potential effects of aging on the relationship between muscle mass and BMD. Additionally almost of recruited premenopausal females showed normal BMD, which may not be related to the aging-related association unlikely postmenopausal females.
Sinaki et al. (25) reported the long-term protective effects of stronger back muscles on the spine to prevent the vertebral fractures. In particular, BMM of male farmers showed inconsistent results with the AMM. We hypothesized that apart from the AMM, which is regarded as the source of mechanical force to the spine because of its dynamic movement, BMM could be regarded as a compensatory or supportive source because of its relatively stationary contraction. Thus, as results of low spinal BMD, BMM may be increased to overcome or protect the spinal bony weakness, which must be proven by the longitudinal follow-up study.
There is a controversial association between fat mass and BMD. Higher trunk fat mass was positively associated with the spinal BMD (16), and fat mass was the significant determinant of BMD at the lumbar spine and proximal femur (15). However, other previous studies reported that increased central body fat had a negative association with BMD (26) such that waist body fat distribution was a risk factor for osteoporosis (27), and fat mass was the most significant determinant of decreased bone mineral density at the lumbar spine (28). In this study, VFM showed significant positive correlation with the spinal BMD in all gender groups. For SFM, there were significant positive correlations with spinal BMD in male and premenopausal female groups.
Additionally, the VFM and SFM were decreased in the "low" BMD group of male and postmenopausal females, and premenopausal females, respectively. Regarding the small portion of premenopausal females (18.2%) in the "low" BMD group, the clinical meaning of SFM was negligible. These results implicated the close association between trunk fat mass and spinal BMD with different osteogenic potentials according to the derived anatomical sites. This can be explained by the results of previous study wherein adipose-derived stromal cells were demonstrated to have multiple differentiation capacities, including osteogenic potentials, and visceral adipose-derived cells exhibited higher osteogenic potentials compared to subcutaneous adipose-derived cells (10).
When designing the study, there were profound considerations about the trunk body composition analysis. First, Dual-energy X-ray absorptiometry (DXA) has been used widely in assessing body composition because of its relatively accurate outcome and technical feasibility (1429). However, if considering the spinal BMD, DXA underestimates the abdominal fat mass compared to CT (30). In this aspect, CT has been used widely to measure the cross-sectional area quickly and shows precise outcomes in assessing the trunk muscle and fat (31). Second, Blain et al. (32) reported that quadriceps strength explains a great part of the association between lean mass and BMD at the femoral neck site but not at the lumbar spine site, and suggested that there is a site-specific effect of muscular strength on bone. Thus, to match the exactly same level to result of spinal DXA and cross-sectional area of trunk CT scan, we adopted the results of the spinal DXA at the L4 level, and selected the mid L4 level for trunk CT scan based on the result of optimal maximal level of both paraspinal muscles such as multipidus and erector spinae (31).
There are several related factors to spinal BMD such as race, genetics, dietary pattern, cardiorespiratory fitness, smoking, alcohol consumption (233), and trunk body composition. Additionally, when considering the dynamic effects of muscle on bone mass, both muscle mass and strength should be considered because previous studies have reported that the strength of back muscles may contribute to the bone mineral density of vertebral bodies (34). Furthermore, the isometric strength of abdominal muscle predicted BMD (33). Thus, the association between muscle mass and strength, and other related factors with BMD and physical functional status is a reflection of the close association between body composition and BMD. These factors not considered should be included in further studies. Additionally, the study population was too small (especially, premenopausal females) to generalize the results, and the cost-benefit of CT was controversial in practical use in clinical setting. Even though these limitations, a major advantage of this study includes the use of a healthy population based sample, which is rarely available among in vivo CT measurements of the trunk body composition and same level assessments for body composition and BMD. It is important to identify the body components associated with the status of BMD in order to help build up the compensatory strategy and induce a proper association between trunk body composition and BMD.
In conclusion, there are positive correlations between mass of trunk muscle and fat, and spinal BMD, and abdominal wall muscle mass is a strong predictor for spinal BMD in male and postmenopausal female farmers with sexual dimorphism. Further comprehensive studies on the relationship between comprehensively associated factors and the interventional approach to enhance the association between trunk body composition and spinal BMD should be performed as a coping strategy.
 XML Download