

 PDF
PDF ePub
ePub Citation
 Print
Print


INTRODUCTION
Approximately, 20%-30% of colorectal cancer (CRC) patients who undergo curative radical colectomies suffer recurrence (1). Currently, there are no recommendations for patients to reduce their risks of recurrence and mortality after treatment, except for complying with active surveillance. Searching for modifiable factors could provide opportunities for these patients to avoid recurrence and to improve overall survival. There have been several recent studies on the association between obesity and CRC prognosis. However, their results have been inconsistent; although some revealed poorer prognoses for obese patients (234), others showed no association (567). In such studies, the timing (before or after surgery) and the methods used to define the relationship between obesity and the risk of CRC recurrence or mortality have varied. Few reports have studied the influence of weight change on the risk of recurrence (68). Further, the impact of changes in the amount of adipose tissue on recurrence and survival has not been addressed by the existing studies.
We investigated, in a retrospective cohort study, the association between the amount of adipose tissue before and after curative treatment, as well as the links between changes during this time period and CRC survival outcomes. We selected a postoperative timing of more than 1 year after CRC surgery during a sustained period of a disease-free state. Using this timing, we were able to characterize the possible influence of changes in the amount of adipose tissue on cancer cells during the disease-free period.
MATERIALS AND METHODS
Study population
We conducted a retrospective cohort study of CRC patients who underwent curative colectomy performed by the same surgeon at Seoul National University Hospital between October 2004 and December 2008 (n = 701). The cancer stage was determined using the American Joint Committee on Cancer criteria (9). Curative resection included a complete excision of the tumor- proximally, distally and circumferentially, as confirmed by a lack of tumor cells at the resection margin, conventional lymph node dissection and no remaining macroscopic evidence of disease. Because all of the operations were performed by the same surgeon, the patients were not affected by inter-surgeon variability. Overall, 630 patients remained after the application of the following exclusion criteria: TNM stage IV tumors; operative methods including total colectomy or transanal excision; extent of colon resection (10) of R1 (all gross disease resected by en bloc resection with margins histologically positive for disease) or R2 (residual gross disease remaining unresected) (11); preoperative neoadjuvant chemoradiation therapy; a history of colon disease, including CRC and inflammatory bowel disease; a family history of CRC; and a cancer treatment history in any organ. For all of the patients eligible for the study, electronic or paper medical records were reviewed. Informations on the patient's age, year of surgery, pathologic stage, tumor location and postoperative adjuvant treatment were collected.
Definitions and exposure measurements
All of the CRC patients underwent preoperative abdominal computed tomography (CT) for staging work-up. Body mass index (BMI) was calculated using recorded body weight (kg) and height (m) before surgery. BMI greater than 25 kg/m2 was defined as obese BMI. Postoperative surveillance with abdominal CT, colonoscopy and Carcinoembryonic antigen was started one year after surgery and was repeated annually for 5 years. In this retrospective study, we evaluated the most recently assessed abdominal CT during the recurrence-free follow-up, which was defined as more than 1 year after surgery or more than one year after the completion of adjuvant therapy. Postoperative assessment windows for the CT scan were selected to allow sufficient time after the completion of treatment for the patients to return to their usual bodily states and to avoid any biases caused by wasting cachexic effects or possible adipose tissue area losses immediately before recurrence or death.
The adipose tissue area was measured at the level of the umbilicus, using abdominal CT scanner, as previously described (Fig. 1) (12). We used a commercial software (Rapidia 2.8; INFINITT, Seoul, Korea) to measure the pixels density between -250 and -50 Hounsfield units (HU) which defines the fat compartment. We defined visceral adipose tissue (VAT) as an intra-abdominal adipose tissue area confined by the parietal peritoneum, excluding the paraspinal muscles and the vertebral column. Subcutaneous adipose tissue (SAT) areas were defined as adipose tissue areas external to the abdomen and back muscles (12). Because there are no standard values for the definition of a normal amount of abdominal adipose tissue, we used the medians of the SAT and VAT areas recorded in this study as references. Obese VAT and obese SAT were defined as values greater than their respective median values (VAT50% and SAT50%).
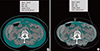 | Fig. 1Calculation of adipose tissue area by multi-detector CT scan.
The measurement was performed at the level of umbilicus. Adipose tissue areas were indicated by Hounsfield scale between -250 and -50 Hounsfield units, which is an attenuation values specific for fatty tissues. (A) Green color indicates total adipose tissue area, both subcutaneous and visceral. (B) Green color inside the circle indicates the visceral adipose tissue area.
|
The changes in the adipose tissue area were calculated by subtracting the adipose tissue area on preoperative abdominal CT from that on postoperative abdominal CT, as described above. Data on the changes in adipose tissue area were available for 548 patients of eligible 630 patients, because some patients underwent surveillance at their local hospitals or experienced recurrence within 1 year after surgery.
Outcome assessments
In the analyses of obesity, defined either by BMI or adipose tissue area, and of the changes in adipose tissue area, the primary end-points were disease-free survival (DFS), distant metastasis-free survival (MFS) and overall survival (OS). DFS was defined as the time from the primary operation to cancer recurrence (including local recurrence and distant metastasis) or to the occurrence of a new primary colorectal cancer, and MFS was defined as the time from the primary operation to the detection of distant metastasis. Overall survival (OS) was defined as the time from the primary operation to death from any cause. The data were obtained via linkages with the national death database.
Statistical analyses
Continuous variables are expressed as the means ± standard deviation (SDs). The χ2 test or Student's t-test and analysis of variance (ANOVA) for independent samples were used to assess the differences in risk factors between the groups. The effects of the preoperative obesity state, as measured by the SAT and VAT areas, were estimated by calculating hazard ratios (HRs) and 95% confidence intervals (CI), using the Cox proportional hazards model. The effect of adipose tissue area changes, as measured by SAT and VAT area, were also estimated by calculating HRs and 95% CIs. Result were considered statistically significant if P < 0.05. All of the statistical analyses were performed using the SPSS software, version 19.0 (SPSS, Chicago, IL, USA)
RESULTS
Baseline characteristics
The eligible group included 405 men (64.2%) and 225 women (35.8%), and the mean age was 62.2 ± 10.5 years old. The median follow-up duration was 67 months (range 13-102 months). Based on BMI, 34.7% were obese. Data on the changes in adipose tissue area were available in 548 patients. The baseline characteristics of the enrolled patients are shown in Table 1 according to the changes in VAT after colectomy. During the postoperative surveillance, 47.3% (259 patients, 176 men and 83 women) of the patients had an increase in VAT amount after colectomy. The VAT-increased group was more likely not to be poorly differentiated (P = 0.007), to smoke (P = 0.014) and to have an increase in SAT after the operation (P < 0.001). In the analysis of changes in the amount of SAT, 62.8% (344 patients, 223 men and 121 women) of the patients had an increase in SAT amount after colectomy. In the increased SAT group, more advanced pathology (T stage, P = 0.005; overall stage, P = 0.001) and VAT increases (P < 0.001) were observed, compared to the decreased SAT group.
Table 1
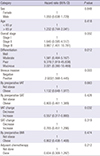
Demographic and clinical characteristics of patients by changes in VAT
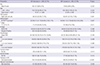
*standard deviation; †W, well differentiated; ‡M, moderately differentiated; §P, poorly differentiated; ∥Mucinous, mucinous cell; ¶ALI, angiolymphatic invasion; **VI, venous invasion; ††PNI, perineural invasion.
![]()
We analyzed the trends in adipose tissue area after colectomy stratified by stages. In stage I, VAT increased in 53.4%, and SAT increased in 50.9%; in stage II, VAT decreased in 51.9%, and SAT increased in 70%. In stage III, VAT decreased in 56.8%, and SAT increased in 63.1%. The total amount of adipose tissue increased in all of the stages.
Impact of adipose tissue amount on cancer recurrence or death
After a mean follow-up of 67 months, of 630 eligible patients, 121 (19.2%) had recurrences (stage I, 15 patients [11.2%]; stage II, 26 [10.9%]; and stage III, 80 [31.1%]), and 101 died (stage I, 8 patients [6%]; stage II, 30 [12.5%]; and stage III, 63 [24.5%]. In univariate analysis, TNM staging, pathological differentiation and VAT changes after colectomy were significantly associated with OS, DFS and MFS. SAT changes were significant only in DFS. Preoperative obesity status, as defined by VAT, SAT, and BMI, showed no significance in the prediction of OS, DFS or MFS. Kaplan-Meier analysis was performed for stage III patients. The five-year overall survival rate was 72.5% in the VAT-decreased group and 88.0% in the VAT-increased group (P = 0.001). The five-year disease-free survival rate was 56.5% in the VAT-decreased group and 74.9% in the VAT-increased group (P = 0.007) (Fig. 2).
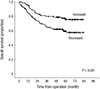 | Fig. 2Kaplan-Meier analysis of overall survival for stage III patients by changes in VAT amount after surgery.
VAT, Visceral adipose tissue.
|
Since the TNM staging, pathological differentiation and VAT changes were significant in univariate analysis, we performed a multivariate analysis with these factors and other obesity factors under adjustment of sex and age.
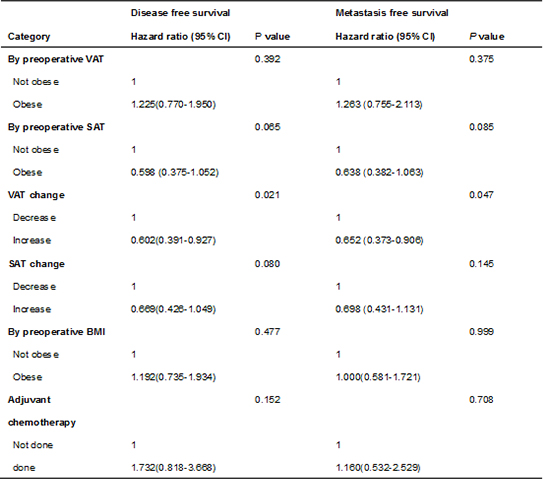
The result of the multivariate analysis with TNM stage, differentiation, venous invasion, preoperative VAT, SAT, and BMI obesity status and postoperative changes in VAT and SAT are shown in Table 2 and 3. For the clinical relevance of the amount of adipose tissue in survival outcomes, VAT change was the only factor that predicted OS, DFS and MFS. Patients who had an increased VAT after colectomy had better OS (hazard ratio [HR], 0.557; 95% confidence interval [CI], 0.317-0.880), DFS (HR, 0.602; 95% CI, 0.391-0.927) and MFS (HR, 0.652; 95% CI, 0.373-0.906). There were no prognostic effects of preoperative obesity, as defined by VAT, SAT or BMI.
Table 2
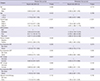
Multivariate Cox proportional hazard model for overall survival
![]()
Table 3
Multivariate Cox proportional hazard model for disease free survival and metastasis free survival
![]()
Subgroup analysis of stage III patients
We performed subgroup analysis of stage III patients by performance of postoperative chemotherapy. In stage III patients who had postoperative chemotherapy, VAT change was a significant factor that predicted OS (HR, 0.453; 95% CI, 0.213-0.965, P = 0.040), DFS (HR, 0.547; 95% CI, 0.310-0.963, P = 0.037) and MFS (HR, 0.528; 95% CI, 0.288-0.971, P = 0.040) by multivariate analysis. Among stage III patients, 18 patients did not have chemotherapy due to patient's refusal or old age. On the contrary to chemotherapy-received group, in stage III patients who did not have postoperative chemotherapy, VAT change was not a significant predictor for OS (P = 0.979), DFS (P = 0.796) and MFS (P = 0.796) by multivariate analysis.
DISCUSSION
In this retrospective cohort study, an increase in the amount of visceral adipose tissue was associated with better overall survival, disease-survival and distant metastasis-free survival; patients with increased visceral fat after surgery had better surgical outcomes. Compared to the results of several previous studies, the preoperative status of obesity, as defined by VAT and BMI, had no significance in predicting prognostic outcomes. Although gastrointestinal cancer surgery is generally believed to cause weight loss or fat loss, the total amounts of adipose tissue and subcutaneous tissue increased after surgery in all stages.
In most of the previous papers (26) on obesity and CRC prognosis, obesity has been determined by BMI, which is a function of both body weight and height. The total amount of adipose tissue in the body, including both visceral and subcutaneous, is included in the body weight. Nevertheless, the distributions and clinical functions of these two types of fat are quite different from one another, and this discrepancy is not considered in calculating BMI alone. The proportions, absolute amounts and responses to nutritional change of these two types of fat are influenced by sex and others factors. For example, visceral obesity is much more common among men than women (13). In our study, men had a higher VAT value (male, mean 11,655.7 mm2 vs. female, mean 9,758 mm2, P < 0.001) but a lower SAT amount (male, mean 11,898 mm2 vs. female, mean 17,794 mm2, P < 0.001) than women, as measured on preoperative CT scans, as described above. Regarding BMI, there was no difference between sexes (male, mean 23.97 kg/m2 vs. female, mean 23.83 kg/m2, P = 0.582).
The clinical significance of VAT and SAT is very different. First, VAT is more susceptible to changes in nutritional status. In calorie a restricted state, although changes can be observed in both VAT and SAT, there was preferential loss of VAT with weight loss (14). As such, VAT changes reflect nutritional status and quality of life after surgery. In our study, VAT change was the only positive prognostic factor regarding adiposity. In previous studies, weight loss was a poor prognostic factor for patients who had chemotherapy after surgery because malnutrition affected these patients' tolerance of chemotherapy-induced toxicity (15), immunologic reactivity and susceptibility to infections (8). In our study, we performed subgroup analysis in stage III patients. In those patients, positive prognostic effect of VAT increase was observed only in those who had postoperative chemotherapy. It could be postulated that, because an increase in VAT might reflect good nutritional status, a sense of well-being and good quality of life, VAT changes should be prospectively investigated during follow-up. If progressive loss of visceral fat is noted, nutritional support in advance might yield greater improvement in clinical outcomes. Patients should be educated about the potential implications of visceral fat changes, particularly patients receiving adjuvant chemotherapy, who must survive the toxicity and side effects of chemotherapy (81516). Second, VAT has generally been reported to be a more pathogenic fat deposit than SAT. VAT obesity is known to have been more closely associated with metabolic syndrome (17) and colorectal cancer development and progression, compared with SAT. Increased circulating levels of insulin, free IGF-1, growth factors and the secretion of pro-inflammatory cytokines are known to contribute to the underlying mechanism (18). As such, visceral fat takes on a double-sided character. Nevertheless, to analyze the studies more deeply, the characteristics of the study populations seem quite different. In studies suggesting poorer prognoses of CRC in obese patients, the obese groups mostly had BMI greater than 30 or so (25). Comparably, in the studies that showed positive nutritional effects of visceral adipose tissue in CRC patients, BMI was much lower (8192021). In our study patients who were VAT obese, the mean BMI was 25.34 kg/m2. Thus, it is suspected that there might be a turning point or threshold below which increasing visceral fat has a positive effect, but beyond some level, it turns into a harmful fat character.
Third, in several papers, subcutaneous adipose tissue was not a direct risk factor for metabolic syndrome; in contrast, a beneficial role was hypothesized (22232425). In our study, the SAT increased in 62.8% of patients after surgery, whereas the total adipose tissue increased in 55.7% of patients. Although the total adipose tissue was increased, due to the still high proportion of SAT, there might have been no effect of TAT obesity on overall survival. Though there are several studies that report the relationship between ratio of VAT to SAT and cardiometabolic morbidity (26), we analyzed the respective amount of VAT and SAT to reflect the distinctive clinical difference between them.
There are several theories that explain the clinical difference between VAT and SAT. VAT and SAT have different developmental origins, and the type of adrenergic receptor they express is quite different, in fact demonstrating opposing reactions to sympathetic stimulation (18). As a result, not only the body weight, but also the respective changes in VAT and SAT seem to be critical to any investigation of the clinical relevance of obesity.
Several limitations of our paper existed. First, changeable factors, such as muscle mass and body fluid, were not included in the analysis. Since the data acquisition was not available due to our technical limits, we could not have considered their effects. Second, we were not able to study such biochemical markers as lipokines and cytokines to investigate the origins of adipose changes and their underlying mechanisms. Third, we could not objectively verify the changes and differences in physical activity, menopausal status or dietary habits that might have had independent associations with surgical outcomes. Nevertheless, our study retained certain advantages over other papers. First, this was the first paper to focus on the changes in VAT and SAT with regard to surgical outcomes. We were able to assess the differences in the distributions and clinical relevance of the two fat types regarding the survival outcomes of CRC. Second, because all of the patients had regular abdominal CT scans, chest x-rays and colonoscopies, we were able to analyze the patients' disease-free survival in further detail.
In this study, visceral fat, increased up to a certain cut-off level, exerted a positive effect on the overall survival and disease-free survival. During the follow-up, the monitoring of VAT changes, to encourage sufficient nutritional support in progressive VAT loss patients, might improve surgical outcomes. Because visceral and subcutaneous fat demonstrate quite different distributions and clinical features, studying the clinical relevance of adiposity should be further pursued respectively in VAT and SAT. Finally, the degree of visceral adiposity that poses a pathogenic risk, versus yielding a protective effect on CRC outcomes, should be investigated in a larger sample of patients.
 XML Download