

 PDF
PDF ePub
ePub Citation
 Print
Print


INTRODUCTION
Neonatal and infant mortality rates (NMR, IMR) are traditionally used as health care or social indicators of individual countries. In 2011, the latest year that data are available for all OECD member nations, Japan had IMR of 2.3 per 1,000 live births, and Korea had 3.0 per 1,000 live births, lower than the average of OECD member nations, 4.0 per 1,000 live births. Japan and Korea ranked 3rd and 10th among the 34 OECD member countries, while the U.S. ranked 31st with its IMR of 6.1 per 1,000 live births (1).
Comparing NMR or IMR among different countries is of limited value or often misleading unless one accounts its two determinants, birth weight distribution (BWD) and birth weight-specific mortality rates (BW-SMRs). NMR or IMR has its two components, mortality rates in individual birth weight groups, and proportions of its birthweight groups in a population. Thus, it can be viewed as the sum of BW-SMRs multiplied by the proportion of live births in each birth weight category (2). The BW-SMR is influenced by the level of health care, among them most importantly by the level of neonatal medical care.
On the other hand, BWD of a live birth population is associated with its sociodemographic status, including maternal age, parity, education, and complications of pregnancy. Race is a factor which is associated with both factors, more with BWD and less with BW-SMRs. Thus, crude NMR or IMR does not reflect the level of infant medical care independent of sociodemographic conditions or vice versa. Our objective is then to determine impact of these two factors, BWD and BW-SMRs on differences in crude NMR and IMR among three countries, Korea, Japan, and the U.S.
MATERIALS AND METHODS
Our study population includes live births for the years 2009 through 2010, from the linked birth/infant death data files of the U.S. National Center for Health Statistics (NCHS) (n = 8,130,051), the Statistics Korea (n = 915,020), and Japan Ministry of Health, Labour, and Welfare (n = 2,141,339) (345678). We excluded 5,019 infants whose birth weights or mortality status were not stated (1,543 in the U.S., 3,013 in Korea, and 463 in Japan). Thus, our final study population consisted of 11,181,391 live births of the U.S. (n = 8,128,508), Korea (n = 912,007), and Japan (n = 2,140,876). The NMR is defined as number of deaths within 28 days per 1,000 live births and IMR, number of deaths within 1 year per 1,000 live births.
First, we estimated the impact of difference in BW-SMRs on the difference in crude mortality rates among these three countries, controlling for the difference in BWD. So, we estimated expected NMR and IMR of Korea and Japan, assuming that both these two countries had the same BWD as in the U.S. Second, we estimated the impact of difference in BWD on the difference in crude mortality rates by estimating expected NMR and IMR of Korea and Japan, assuming that these two countries had the same mortality rates in each of all birth weight categories.
RESULTS
Neonatal and infant mortality rates, birth weight distribution, and birth weight-specific mortality rates in Korea, Japan, and the U.S.
In the period 2009-2010, NMR and IMR in Korea were 1.8 and 3.2 per 1,000 live births, respectively, significantly lower than in the U.S. of 4.1 and 6.2 per 1,000 live births respectively, but higher than in Japan, 1.1 and 2.1 per 1,000 live births respectively (Table 1). Comparing different countries, the crude rates may differ by the differences in its two components, BWD and BW-SMRs. Lower birth weight groups have exponentially higher mortality than the larger birth weight groups. Thus, although it is a small proportion, this smaller birth weight group would greatly affect the overall crude rate. As well, difference in mortality rates in individual birth weight groups among different countries would also contribute to the variance in their overall crude mortality rates.
Table 1
Number of live births, neonatal and infant mortality rates in the U.S., Korea, and Japan, 2009-2010
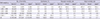
In this period, proportion of live births with < 2,500 g was 5.0% in Korea, lower than 8.2% in the U.S. and 9.6% in Japan (Table 1). The difference was more pronounced in the proportion of very low birth weight infant (< 1,500 g, VLBWI); 0.6% in Korea and 0.8% in Japan, while it was 1.4% in the U.S., more than twice higher than in Korea or 75% more than in Japan. BW-SMRs were also quite different among these three countries (Table 1). Compared to Korea and the U.S., Japan had lower BW-S NMR and IMR in all birth weight categories. It is notable that Koreans had higher infant mortality in the VLBWI group, compared to the Japanese or the U.S.
Thus, we compared independent contributions of these two components on the crude mortality rate in three countries. First, we estimated expected crude NMR and IMR in Korea and Japan using BWD of the U.S. births but with actual BW-SMRs of Korea and Japan. Second, we estimated expected crude NMR and IMR in Korea and Japan using BW-SMRs of the U.S. but with actual BWD of Korea and Japan.
Expected neonatal and infant mortality rates in Korea after standardization with birth weight distribution and birth weight-specific mortality rates in the U.S.
Standardizing BWD of Korea with that of the U.S. resulted in expected crude NMR and IMR in Korea of 3.9 and 6.1 per 1,000 respectively, higher than the actual crude rates of 1.8 and 3.2 per 1,000 respectively (Fig. 1A, Table 2). These expected rates were quite similar to the U.S. NMR and IMR of 4.1 and 6.2 per 1,000, respectively. Standardizing BW-S NMR and IMR of Korea with those of the U.S. resulted in expected crude NMR and IMR in Korea of 2.0 and 3.8 per 1,000 respectively, slightly higher than the actual crude rates of 1.8 and 3.2 per 1,000, respectively (Fig. 1B, Table 2). These two estimations indicate that the lower NMR and IMR in Korea than in the U.S. is predominantly due to its favorable BWD.
Fig. 1
Actual and expected neonatal and infant mortality rates in Korea after standardization with birth weight distribution (A) and birth weight-specific mortality rates (B) in the U.S. If Koreans had the same birth weight distribution as in the U.S., their crude neonatal and infant mortality rates would be 3.9/6.1. If Koreans had the same birth weight-specific mortality rates as in the U.S., the crude neonatal and infant mortality rates would be 2.0/3.8.
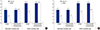
Table 2
Actual and expected neonatal and infant mortality rates in Korea (A) and Japan (B), 2009-2010

BWD, birth weight distribution; BW-SMR(s), birth weight-specific mortality rate(s).
*Sum of expected BW-S neonatal or infant deaths {(BWD(%) in the U.S. × total live births in Korea or Japan × BW-SMRs in Korea or Japan)/1,000}; †(Total expected neonatal or infant deaths in Korea or Japan/total live births in Korea or Japan) × 1,000; ‡Sum of expected BW-S neonatal or infant deaths (BW-SMRs in the U.S. × BW-S live births in Korea or Japan/1,000); §(Total expected neonatal or infant deaths in Korea or Japan/total live births in Korea or Japan) × 1,000; ∥Data from the U.S. National Center for Health Statistics; ¶Data from the Statistics Korea; **Data from Japan Ministry of Health, Labour, and Welfare (345678).
Expected neonatal and infant mortality rates in Japan after standardization with birth weight distribution and birth weight-specific mortality rates in the U.S.
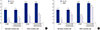
Similar comparison was made for the difference in mortality rates between Japan and the U.S. (Fig. 2, Table 2). Standardizing BWD of Japan with that of the U.S. resulted in expected crude NMR and IMR in Japan of 1.5 and 2.5 per 1,000 respectively, somewhat higher than the actual crude rates of 1.1 and 2.1 per 1,000 respectively (Fig. 2A, Table 2). Standardizing BW-S NMR and IMR of Japan with those of the U.S. resulted in expected crude NMR and IMR in Japan of 2.7 and 5.0 per 1,000 respectively, remarkably higher, about 2.5-folds higher than the actual crude NMR and IMR (Fig. 2B, Table 2). These observations suggest that the lower NMR and IMR in Japan than in the U.S. are due to both factors, predominantly by its better BW-SMRs and lesser by its favorable BWD.
Fig. 2
Actual and expected neonatal and infant mortality rates in Japan after standardization with birth weight distribution (A) and birth weight-specific mortality rates (B) in the U.S. If Japanese had the same birth weight distribution as in the U.S., their crude neonatal and infant mortality rates would be 1.5/2.5. If Japanese had the same birth weight-specific mortality rates as in the U.S., the crude neonatal and infant mortality rates would be 2.7/5.0.
DISCUSSION
NMR and IMR are believed to reflect level of health care and socioeconomic status of a population. Our study demonstrates that comparing crude NMR and IMR among different countries has a limited value or often is misleading. Our study delineates that lower NMR and IMR in Korea than in the U.S. is primarily due to its favorable BWD, lesser prevalence of births of small birth weight or premature groups having higher mortality, and little from the difference in BW-S MR. On the other hand, Japan has lower NMR and IMR than the U.S., because of its favorable BWD and also its remarkably low BW-S MR.
IMR of the U.S. ranked lower, the 11th in the world in the period 1950-1955 with its IMR of 30.5 per 1,000 live births. But this rank has become progressively worsened over time, the 17th in 1970-1975 and the 22nd in the 1990-1995. By the period 2010-2015 its world rank hit the 40th, although its IMR has declined remarkably to 5.9 per 1,000 live births. This trend was there when we compared IMR of the three countries, the U.S., Japan and Korea, the latter two countries reducing their IMR below that of the U.S., by the late 1960s in Japan and by the 1990s in Korea (9). This pattern in mortality transition among countries may be readily explained by the status of two determinants of mortality rates, BWD and BW-S MR over time. In the 1950s, there was a wide disparity in health care, particularly in infant care among countries. Then, BW-S MR in general was more influential factor than BWD. But since then knowledge and technology in infant health care, particularly neonatal care have progressively diffused to the world, including Korea. Thus, when the level of BW-S MR has become similar in many countries, the difference in the other determinant, BWD has become the predominant factor on the crude NMR and IMR. BWD has become even more important since it has changed little within individual countries over many decades although it has varied widely among countries. In other words, in the middle of the 20th century, the U.S. had better health care than many other countries, resulting in its low IMR ranking in the world. But when in the late 20th century, other industrialized or even developing countries have improved their infant care level similar to that of the U.S., the U.S. IMR ranked worse than many of these countries, primarily because of little change in their BWD that has remained worse than many other countries.
In the study period 2009-2010, the U.S. had VLBWI, about 1.5% of all births, but this group contributed to 71.1% of all neonatal deaths and 53.5% of all infant deaths. In Korea and Japan this proportion of VLBWI were far lower, about half of the U.S., 0.6% and 0.8%, respectively, thus having far less impact on the crude NMR and IMR. Some specific reasons have been suggested for the causes of preterm birth or low birth weight, such as maternal sociodemographic status, race, age, education, health status and access to health care. And these factors were associated with difference in crude IMR (1011121314). However, recent studies suggest that among all maternal factors, maternal race or ethnicity is the overwhelming factor in explaining the difference in BWD, thus the resulting difference in NMR and IMR among the countries (151617). To our knowledge, our study is the first to include both the BWD and also, BW-SMR in comparing NMR and IMR of Korea, Japan and the U.S.
In conclusion, our study emphasizes that when comparing NMR or IMR among different populations or over time, one should include the impact of its two components, BWD and BW-SMR. This is particularly important in VLBWI having crucial impact on the crude NMR and IMR. The remarkably low, current NMR and IMR in Korea compared to the U.S. and many other countries is certainly not due to its superior infant care but rather due to its favorably low proportion of preterm or low birth weight births. With further improvement in infant medical care in Korea as in Japan, its IMR would rank at near to the top among industrialized countries, surely better than Japan, since the BWD in Korea is more favorable than in Japan.
 XML Download