Journal List > J Korean Med Sci > v.31(9) > 1023078

Kim, Kim, Kim, Kim, Kim, Park, Kim, Ahn, and Han: Clinical Utility of a New Automated Hepatitis C Virus Core Antigen Assay for Prediction of Treatment Response in Patients with Chronic Hepatitis C

Abstract

Hepatitis C virus core antigen (HCV Ag) is a recently developed marker of hepatitis C virus (HCV) infection. We investigated the clinical utility of the new HCV Ag assay for prediction of treatment response in HCV infection. We analyzed serum from 92 patients with HCV infection who had been treated with pegylated interferon and ribavirin. HCV Ag levels were determined at baseline in all enrolled patients and at week 4 in 15 patients. Baseline HCV Ag levels showed good correlations with HCV RNA (r = 0.79, P < 0.001). Mean HCV Ag levels at baseline were significantly lower in patients with a sustained virologic response (SVR) than in those with a non SVR (relapse plus non responder) based on HCV RNA analysis (2.8 log10fmol/L vs. 3.27 log10fmol/L, P = 0.023). Monitoring of the viral kinetics by determination of HCV RNA and HCV Ag levels resulted in similarly shaped curves. Patients with undetectable HCV Ag levels at week 4 had a 92.3% probability of achieving SVR based on HCV RNA assay results. The HCV Ag assay may be used as a supplement for predicting treatment response in HCV infection, but not as an alternative to the HCV RNA assay.

INTRODUCTION

Chronic hepatitis C virus (HCV) infection is a major cause of liver cirrhosis and hepatocellular carcinoma (1). The primary goal of therapy for patients with HCV infection is achievement of a sustained virologic response (SVR). Pegylated interferon (PEG-IFN) plus ribavirin has become the standard treatment for chronic hepatitis C (CHC) (2). In Europe and the US, following PEG-IFN plus ribavirin treatment, 40%-50% of patients infected with genotype 1 achieved SVR, and 70%-74% of patients infected with genotype 2 or 3 achieved SVR (34). SVR rates were slightly higher in Korean patients: 53.6%-69.5% and > 80% of Korean patients infected with genotype 1 and 2 achieved SVR, respectively (5).
When considering treatment strategies, prediction of the treatment response is important before starting antiviral therapy. Currently, the HCV RNA assay is the recommended tool for predicting treatment response. Several studies have reported that CHC patients with high viral load (> 800,000 IU/mL) have lower probabilities of achieving SVR (678). Furthermore, it was recently postulated that patients with low baseline viral load and undetectable HCV RNA by week 4 could be expected to have a shorter treatment duration (910). However, HCV RNA assays are expensive, time-consuming, and require technical equipment and highly trained personnel. Therefore, a less expensive and faster assay for predicting treatment response is needed, particularly in low-resource settings.
Recently, less expensive and time-consuming assays for detecting HCV core antigen (HCV Ag) have become available. The HCV core protein is a 21-kDa structural phosphoprotein of the HCV capsid and comprising the first 191 amino acids of the viral polyprotein, which can be detected and quantified in the serum of infected patients by an enzyme immunoassay technique (11). HCV Ag levels show good correlation with HCV RNA levels; therefore, this appears to be a useful new test for detecting viremia (121314). In this context, an attractive future approach for monitoring response to antiviral therapy may involve HCV viral load monitoring and predicting treatment response by determining HCV Ag levels. However, few studies have investigated the utility of the HCV Ag assay in this perspective. Therefore, the HCV Ag assay cannot be recommended until more data are obtained.
We aimed to evaluate the performance of the HCV Ag assay in predicting treatment response to PEG-IFN and ribavirin by comparing it with established methods for quantification of HCV RNA.

MATERIALS AND METHODS

Patients

Ninety-two patients with CHC treated with PEG-IFN plus ribavirin were enrolled in this study. All patients were over 18 years of age and had elevated serum alanine aminotransferase (ALT) levels, compensated liver disease, and documented chronic HCV infection by serum hepatitis C antibody and HCV RNA testing. The Ethics Committee of the hospital approved the study protocol.
All patients received a regimen of 180 µg PEG-IFN α-2a (Pegasys®, F.Hoffmann-La Roche, Ltd., Basel, Switzerland) or 1.5 µg/kg PEG-IFN α-2b (Pegintron®, Schering-Plough, Kenilworth, NJ, USA) once weekly plus 1,000–1,200 mg ribavirin daily, according to body weight. A 48-week treatment was administered to patients infected with genotype 1, and a 24-week treatment to patients infected with genotype 2. Serum samples were collected from all enrolled patients at baseline and from 15 patients at week 4 of therapy and stored at -80°C.

HCV Ag quantification

HCV Ag quantification was performed using ARCHITECT HCV Ag (Abbott, Wiesbaden, Germany) with an HCV Ag assay kit (Abbott Japan Co., Ltd., Tokyo, Japan). The ARCHITECT HCV Ag assay is a two-step quantitative chemiluminescent microparticle immunoassay run on a fully automated ARCHITECT instrument. The sample volume required was approximately 110 µL, and HCV Ag levels of < 3.0 fmol/L were considered nonreactive in accordance with the manufacturer’s instructions.

HCV RNA quantification

HCV RNA quantification was determined by the Cobas AmpliPrep/Cobas TaqMan HCV assay (CAM/CTM) (Roche Molecular Systems, Inc., Pleasanton, CA, USA). The lower detection limit of CAM/CTM is 15 IU/mL.

Assessment of efficacy

SVR was defined as an undetectable serum HCV RNA level 24 weeks after cessation of treatment, and relapse was defined as an undetectable HCV RNA level at the end of treatment but HCV RNA positive 24 weeks after discontinuation of therapy. No response was defined as a detectable HCV RNA level at the end of treatment. An early virologic response (EVR) was defined as an undetectable HCV RNA level or a decline of at least 2 log from baseline at week 12 of treatment. Treatment was stopped at week 12 in patients with HCV genotype 1 who did not achieve EVR.

Statistical analysis

Descriptive statistics are shown as the mean ± standard deviation or the median range, as appropriate. The correlation between HCV Ag and HCV RNA levels was calculated using Pearson’s correlation coefficient. Differences in the group characteristics were compared by χ2 and Fisher’s exact test for categorical variables and two-sided t-test was used for continuous variables. To identify independent predictors of SVR, univariate and subsequent multivariate regression analyses were used. Hazard ratios (HRs) and corresponding 95% CIs were used where indicated.
A difference was considered statistically significant when the P value was < 0.05. Viral quantification results (i.e. HCV RNA and HCV Ag) were converted into a logarithmic (log) scale. Statistical analyses were performed using SPSS software (ver. 18.0; SPSS Inc., Chicago, IL, USA).

Ethics statement

The study design was approved by the institutional review board at Severance Hospital (IRB No. 4-2013-0851). All subjects submitted informed consents before enrollment.

RESULTS

Baseline characteristics

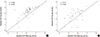
The baseline characteristics of the 92 patients are described in Table 1. At baseline, the log mean HCV RNA level and the mean HCV Ag level was 5.96 IU/mL and 2.94 fmol/L, respectively. HCV Ag was not detected in 1 patient (1.1%) with genotype 2. The HCV RNA level in this patient was 19,900 IU/mL. HCV Ag levels showed good correlation with HCV RNA levels in both genotypes (r = 0.798, P < 0.001 for genotype 1 [Fig. 1A]; r = 0.773, P < 0.001 for genotype 2 [Fig. 1B]).
Table 1

Baseline characteristics of the study population

jkms-31-1431-i001
Parameters All patients (n = 92) SVR (n = 64, 69.6%) Non-SVR (n = 28, 30.4%) P value*
Age, yr 51.4 ± 1.2 49.6 ± 13.0 55.6 ± 7.7 0.007
Male 41 (44.6) 28 (43.8) 13 (46.4) 0.824
Cirrhosis, clinically diagnosed 11 (12.0) 2 (3.1) 9 (32.1) < 0.001
HCV Genotype (1/2) 56/36 34/30 22/6 0.036
HCV RNA, log10IU/mL 5.96 ± 0.07 5.88 ± 0.79 6.13 ± 0.40 0.045
HCV Ag, log10fmol/L 2.94 ± 0.11 2.80 ± 1.14 3.27 ± 0.76 0.023
Serum albumin, g/dL 4.33 ± 0.04 4.36 ± 0.39 4.24 ± 0.35 0.170
Total bilirubin, mg/dL 0.86 ± 0.04 0.81 ± 0.36 0.98 ± 0.39 0.052
Alanine aminotransferase, IU/L 79.5 ± 6.3 78.4 ± 60.2 82.1 ± 62.9 0.787
Platelet count, 109/L 175.0 ± 6.6 187.0 ± 60.8 147.8 ± 62.3 0.007
Values are expressed as median (range) or No. (%).
SVR, sustained virologic response; HCV, hepatitis C virus; HCV Ag, HCV core antigen.
*SVR vs. Non-SVR
Fig. 1
HCV Ag levels show good correlation with HCV RNA levels in both genotypes. r = 0.798, P < 0.001 for genotype 1 (A); r = 0.773, P < 0.001 for genotype 2 (B).
jkms-31-1431-g001
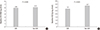
SVR was observed in 64 patients (69.6%), while 19 (20.7%) experienced relapse after the end of therapy. Nine (9.7%) patients with genotype 1 did not show EVR, so they stopped therapy at week 12. Significantly lower baseline HCV RNA levels were observed in patients with SVR (mean log10 5.88 IU/mL) than is those with non-SVR (mean log10 6.13 IU/mL) (P = 0.045). Mean baseline HCV Ag levels were significantly lower in patients with SVR versus non-SVR (non-SVR: relapse plus non responder) (2.8 log10 fmol/L for SVR vs. 3.27 log10 fmol/L for non-SVR, P = 0.023) (Fig. 2).
Fig. 2
Baseline HCV levels. (A) RNA levels (log10 IU/mL) in patients with a sustained virologic response (SVR) and non-SVR. The log mean baseline HCV RNA levels are significantly lower in patients with SVR (5.88 IU/mL) than non-SVR (6.13 IU/mL) (P = 0.045). (B) Ag levels (log10 fmol/L) in patients with SVR and non-SVR. The log mean baseline HCV Ag levels are significantly lower in patients with SVR (2.8 fmol/L) than in those with non-SVR (3.27 fmol/L) in logs (P = 0.023).
jkms-31-1431-g002

HCV RNA and HCV Ag levels as predictors of SVR

HCV RNA and HCV Ag levels were entered separately into each multivariate analysis, along with age and cirrhosis, due to the significant correlation between HCV RNA and HCV Ag levels. HCV RNA and HCV Ag levels were both independent predictors of SVR (HCV RNA: P = 0.026; adjusted HR 0.968, 95% CI 0.917-1.023; HCV Ag: P = 0.027, adjusted HR 0.454, 95% CI 0.226-0.914), together with cirrhosis (Table 2).
Table 2

Indepdenent predictors of sustained virologic response

jkms-31-1431-i002
Virologic response parameters Multivariate* Multivariate
Hazard ratio (95% CI) P value Hazard ratio (95% CI) P value
Age, yr 0.976 (0.923-1.032) 0.396 0.968 (0.917-1.023) 0.250
Cirrhosis, clinically diagnosed 0.085 (0.013-0.557) 0.010 0.084 (0.012-0.569) 0.011
Total bilirubin, mg/dL 0.323 (0.073-1.440) 0.138 0.331 (0.077-1.426) 0.138
Platelet count, 109/L 1.000 (1.000-1.000) 0.385 1.000 (1.000-1.000) 0.582
HCV RNA, log10IU/mL 0.968 (0.917-1.023) 0.026
HCV Ag, log10fmol/L 0.454 (0.226-0.914) 0.027
CI, confidence interval; HCV, hepatitis C virus; HCV Ag, HCV core antigen.
*HCV RNA adjusted by age, cirrhosis, total bilirubin and platelet count; HCV Ag adjusted by age, cirrhosis, total bilirubin and platelet count.

Changes of HCV RNA and HCV Ag levels at week 4 of therapy

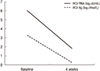
We investigated early changes of viral load among 15 patients at week 4 of therapy. The characteristics of the 15 patients are shown in Table 3. After 4 weeks of treatment, 9 patients had undetectable HCV RNA and 13 had undetectable HCV Ag. The mean HCV RNA level decreased from 6.05 log10IU/mL to 1.81 log10IU/mL (P < 0.001), and the mean HCV Ag decreased from 3.27 log10 fmol/L to 0.67 log10fmol/L (P < 0.001). Among the four patients who had detectable HCV RNA and a loss of HCV Ag at week 4, three achieved SVR. As illustrated in Fig. 3, monitoring of viral kinetics by determination of either the HCV RNA or the HCV Ag concentration resulted in similarly shaped curves.
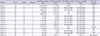
Table 3

Predictive value of undetectable HCV RNA and HCV Ag at week 4 of the treatment on sustained virologic response

jkms-31-1431-i003
Assay target PPV* NPV
Undetectable HCV RNA 9/9 (100%) 4/6 (66.7%)
Undetectable HCV Ag 12/13 (92.3%) 1/2 (50.0%)
HCV, hepatitis C virus; HCV Ag, HCV core antigen.
*Positive predictive values (PPVs) correspond to the rate of patients with undetectable HCV Ag or HCV RNA levels and subsequent sustained virologic response; Negative predictive values (NPVs) correspond to the rate of patients without undetectable HCV Ag or HCV RNA levels and subsequent sustained virologic response.
Fig. 3
Kinetics of HCV RNA and HCV Ag levels during the 4-week treatment period. Viral kinetics were monitored by determination of HCV RNA and HCV Ag levels. The similarly shaped curves indicate similar kinetics.
jkms-31-1431-g003

Predictive value of undetectable HCV RNA and HCV Ag at week 4 of treatment on SVR

Table 4 summarizes the positive predictive values (PPVs) and negative predictive values (NPVs) of HCV RNA and HCV Ag testing in terms of the response to combination therapy. As shown in Table 2, 92.3% of patients with undetectable HCV Ag subsequently attained an SVR to therapy, while 50.0% of patients with detectable HCV Ag did not attain an SVR to therapy. According to HCV RNA testing, the PPV was 100% and the NPV 66.7%.
Table 4

Clinical data of 15 patients with available data at 4 weeks after treatment

jkms-31-1431-i004
Patients Age, yr Gender Genotype HCV RNA at baseline, IU/mL HCV Ag at baseline, fmol/L HCV RNA at 4weeks, IU/mL HCV Ag at 4weeks, fmol/L Treatment response
Patient 1 34 F 1 22,400,000 17,139.56 49,000 140.16 SVR
Patient 2 43 M 1 11,700,000 14,444.98 Not detectable Not detectable SVR
Patient 3 56 F 2 14,800,000 13,998.37 Not detectable Not detectable SVR
Patient 4 27 F 1 825,000 1,605.15 718 Not detectable SVR
Patient 5 40 M 1 18,900,000 14,314.95 193 Not detectable SVR
Patient 6 45 M 2 34,500 120.95 Not detectable Not detectable SVR
Patient 7 41 M 2 181,000 269.02 Not detectable Not detectable SVR
Patient 8 69 F 2 3,110,000 321.87 Not detectable Not detectable SVR
Patient 9 19 M 2 372,000 2,950.81 Not detectable Not detectable SVR
Patient 10 47 F 2 2,190,000 3,096.32 Not detectable Not detectable SVR
Patient 11 65 F 2 8,850,000 17,394.41 232 Not detectable Relapse
Patient 12 55 M 2 318,000 812.54 32.5 Not detectable SVR
Patient 13 54 M 2 43,900 134.99 Not detectable Not detectable SVR
Patient 14 64 M 2 86,300 435.4 Not detectable Not detectable SVR
Patient 15 50 F 2 569,000 1,804.14 769 55.83 No response
HCV, hepatitis C virus; HCV Ag, HCV core antigen; SVR, sustained virologic response.

DISCUSSION

HCV Ag assays were introduced over the last decade (15), and in the majority of studies, HCV Ag was detected by enzyme-linked immunosorbent assays or enzyme immunoassays (161718). These quantitative HCV Ag assays became promising alternatives to HCV RNA assays because of their good correlations (1213). However, their low sensitivity prevented their use in clinical practice.
A fully automated chemiluminescent immunoassay with higher sensitivity was recently developed to overcome the shortcomings of conventional HCV Ag assays (19). This new HCV Ag assay stimulated further studies on the clinical utility of HCV Ag testing (202122). Park et al. (14) showed that HCV Ag assay results were comparable to those of HCV RNA viral load assay. Several studies have demonstrated the utility of antiviral response monitoring using the HCV Ag assay (2324).
In our study, HCV Ag was detected in 91 of 92 HCV RNA-positive baseline samples, showing high diagnostic sensitivity, consistent with previous reports (2025). We also confirmed a significant correlation between HCV Ag and HCV RNA levels at baseline, irrespective of HCV genotype, again in concordance with prior reports (1422). Following treatment, patients with SVR appeared to have lower serum HCV Ag levels prior to treatment (Fig. 2B). Therefore, the association between baseline HCV Ag levels and treatment response is similar to that of HCV RNA levels, in agreement with previous reports.
A rapid virologic response (RVR), typically defined as undetectable HCV RNA at week 4 of treatment with PEG-IFN plus ribavirin, is increasingly being used to identify patients most likely to achieve SVR. Such observations have led to the concept of shortening treatment durations (widely known as response-guided therapy). Among patients infected with HCV genotype 1 and who achieve RVR, approximately 90% achieve SVR after 48 weeks of treatment (2627). Moreover, shortened treatment regimens are appropriate for some patients with RVR (28). Thus, the estimation of an early treatment response at week 4 is of paramount importance. We aimed to elucidate the utility of HCV Ag levels at week 4 for predicting treatment response and determining treatment duration. Indeed, one finding in our study was that an undetectable HCV Ag level at week 4 had good reliability as a positive predictor of SVR. Our results indicate that the PPVs of HCV Ag and HCV RNA testing at week 4 were similar. The difference in the NPVs was based on a limited number of cases of non SVR; therefore, this finding should be interpreted with caution.
The introduction of direct-acting antiviral drugs (DAA) for CHC patients has radically changed the treatment of chronic HCV infections (29303132). The highly elevated SVR and end of treatment response rates have challenged the need for regular HCV-RNA efficacy monitoring. Furthermore, in consideration of the high costs of DAAs, less expensive tests to assess on-treatment responses are needed. Recent studies have demonstrated the clinical utility of monitoring HCV Ag in patients with CHC taking DAAs (333435). Aghemo et al. (33) investigated the accuracy of the HCV Ag assay in predicting which patients receiving DAAs would achieve SVR at week 12 (SVR12). The assays for HCV Ag and HCV RNA predicted the patients with SVR12, with positive predictive values of 90% and 83%, respectively, at week 2, and of 89% and 92%, respectively, at week 4. HCV Ag is as useful as HCV RNA in monitoring the treatment efficacy of anti-HCV DAA regimens, however, validation using larger cohorts is warranted.
Our study had some limitations. First, the number of enrolled patients was relatively small. Second, almost all patients who could undergo kinetics evaluation achieved SVR. Due to these limitations, we were unable to compare baseline HCV Ag levels with week 4 HCV Ag levels. Thus, the predictive value of HCV Ag at week 4 should be evaluated in further studies.
A sensitive HCV RNA assay that can detect < 15 IU/mL is the gold standard for determining a virologic response in CHC patients (36). Although the sensitivity of HCV Ag assays has improved, HCV Ag-based treatment response monitoring may need to be based on different algorithms than those currently in use because HCV RNA assays have a lower detection limit than HCV Ag assays. Therefore, the HCV Ag assay is less useful in settings that already use the HCV RNA assay. However, quantification of HCV RNA requires careful handling of specimens and is more expensive and time-consuming compared with the HCV Ag assay, which is based on a simple enzymatic reaction (17). Therefore, the HCV Ag assay can be used frequently for treatment monitoring, particularly in low-resource settings.
Our preliminary results show that HCV Ag levels have excellent correlation to HCV RNA levels. Furthermore, we show that the kinetics of Ag and viremia are similar. However, the HCV Ag assay should be used as a supplement for monitoring antiviral therapy, not as an alternative to the HCV RNA assay. Further studies monitoring HCV Ag levels at different time points will further clarify the clinical utility of this assay.

ACKNOWLEDGMENT

The authors are grateful to the Abbott Diagnostics for providing a part of the HCV Ag assay test kits.

Notes

Funding This study was supported by a grant of the Korea Healthcare Technology R & D Project, Ministry of Health and Welfare, Republic of Korea (HI10C2020) and partly by funds Yonsei Liver Blood Bank (YLBB). This research was also supported by a grant of the Research Driven Hospital R & D project, funded by the CHA Bundang Medical Center (grant number: BDCHA R & D 2015-25). The funders had no role in study design, data collection and analysis, decision to publish, or preparation of the manuscript.

DISCLOSURE The authors have no potential conflicts of interest to disclose.

AUTHOR CONTRIBUTION Study design: Han KH. Patients enroll and data collection: Han KH, Park JY, Kim DY, Ahn SH. Data analysis: Kim MN, Kim HS, Kim JK, Kim BK, Kim SU. Writing of manuscript: Kim MN. Revision and approval of manuscript: all authors.

References

1. Sagnelli E, Stroffolini T, Mele A, Almasio P, Coppola N, Ferrigno L, Scolastico C, Onofrio M, Imparato M, Filippini P. The importance of HCV on the burden of chronic liver disease in Italy: a multicenter prevalence study of 9,997 cases. J Med Virol. 2005; 75:522–527.
2. Fried MW, Shiffman ML, Reddy KR, Smith C, Marinos G, Gonçales FL Jr, Häussinger D, Diago M, Carosi G, Dhumeaux D, et al. Peginterferon alfa-2a plus ribavirin for chronic hepatitis C virus infection. N Engl J Med. 2002; 347:975–982.
3. European Association for the Study of the Liver. EASL clinical practice guidelines: management of hepatitis C virus infection. J Hepatol. 2011; 55:245–264.
4. Afdhal NH, McHutchison JG, Zeuzem S, Mangia A, Pawlotsky JM, Murray JS, Shianna KV, Tanaka Y, Thomas DL, Booth DR, et al. Hepatitis C pharmacogenetics: state of the art in 2010. Hepatology. 2011; 53:336–345.
5. Korean Association for the Study of the Liver (KASL). KASL clinical practice guidelines: management of hepatitis C. Clin Mol Hepatol. 2014; 20:89–136.
6. Berg T, Sarrazin C, Herrmann E, Hinrichsen H, Gerlach T, Zachoval R, Wiedenmann B, Hopf U, Zeuzem S. Prediction of treatment outcome in patients with chronic hepatitis C: significance of baseline parameters and viral dynamics during therapy. Hepatology. 2003; 37:600–609.
7. Civeira MP, Prieto J. Early predictors of response to treatment in patients with chronic hepatitis C. J Hepatol. 1999; 31:Suppl 1. 237–243.
8. Zeuzem S, Lee JH, Franke A, Rüster B, Prümmer O, Herrmann G, Roth WK. Quantification of the initial decline of serum hepatitis C virus RNA and response to interferon alfa. Hepatology. 1998; 27:1149–1156.
9. Diago M, Shiffman ML, Bronowicki JP, Zeuzem S, Rodriguez-Torres M, Pappas SC, Tietz A, Nelson DR. Identifying hepatitis C virus genotype 2/3 patients who can receive a 16-week abbreviated course of peginterferon alfa-2a (40KD) plus ribavirin. Hepatology. 2010; 51:1897–1903.
10. Sarrazin C, Shiffman ML, Hadziyannis SJ, Lin A, Colucci G, Ishida H, Zeuzem S. Definition of rapid virologic response with a highly sensitive real-time PCR-based HCV RNA assay in peginterferon alfa-2a plus ribavirin response-guided therapy. J Hepatol. 2010; 52:832–838.
11. Tanaka E, Kiyosawa K, Matsumoto A, Kashiwakuma T, Hasegawa A, Mori H, Yanagihara O, Ohta Y. Serum levels of hepatitis C virus core protein in patients with chronic hepatitis C treated with interferon alfa. Hepatology. 1996; 23:1330–1333.
12. Enomoto M, Nishiguchi S, Tamori A, Kohmoto M, Habu D, Sakaguchi H, Takeda T, Kawada N, Seki S, Shiomi S. Chemiluminescence enzyme immunoassay for monitoring hepatitis C virus core protein during interferon-alpha2b and ribavirin therapy in patients with genotype 1 and high viral loads. J Med Virol. 2005; 77:77–82.
13. Hayashi K, Hasuike S, Kusumoto K, Ido A, Uto H, Kenji N, Kohara M, Stuver SO, Tsubouchi H. Usefulness of a new immuno-radiometric assay to detect hepatitis C core antigen in a community-based population. J Viral Hepat. 2005; 12:106–110.
14. Park Y, Lee JH, Kim BS, Kim DY, Han KH, Kim HS. New automated hepatitis C virus (HCV) core antigen assay as an alternative to real-time PCR for HCV RNA quantification. J Clin Microbiol. 2010; 48:2253–2256.
15. Aoyagi K, Ohue C, Iida K, Kimura T, Tanaka E, Kiyosawa K, Yagi S. Development of a simple and highly sensitive enzyme immunoassay for hepatitis C virus core antigen. J Clin Microbiol. 1999; 37:1802–1808.
16. Laperche S, Le Marrec N, Girault A, Bouchardeau F, Servant-Delmas A, Maniez-Montreuil M, Gallian P, Levayer T, Morel P, Simon N. Simultaneous detection of hepatitis C virus (HCV) core antigen and anti-HCV antibodies improves the early detection of HCV infection. J Clin Microbiol. 2005; 43:3877–3883.
17. Soffredini R, Rumi MG, Parravicini ML, Ronchi G, Del Ninno E, Russo A, Colombo M. Serum levels of hepatitis C virus core antigen as a marker of infection and response to therapy. Am J Gastroenterol. 2004; 99:1738–1743.
18. Yokosuka O, Kawai S, Suzuki Y, Fukai K, Imazeki F, Kanda T, Tada M, Mikata R, Hata A, Saisho H. Evaluation of clinical usefulness of second-generation HCV core antigen assay: comparison with COBAS AMPLICOR HCV MONITOR assay version 2.0. Liver Int. 2005; 25:1136–1141.
19. Morota K, Fujinami R, Kinukawa H, Machida T, Ohno K, Saegusa H, Takeda K. A new sensitive and automated chemiluminescent microparticle immunoassay for quantitative determination of hepatitis C virus core antigen. J Virol Methods. 2009; 157:8–14.
20. Ross RS, Viazov S, Salloum S, Hilgard P, Gerken G, Roggendorf M. Analytical performance characteristics and clinical utility of a novel assay for total hepatitis C virus core antigen quantification. J Clin Microbiol. 2010; 48:1161–1168.
21. Moscato GA, Giannelli G, Grandi B, Pieri D, Marsi O, Guarducci I, Batini I, Altomare E, Antonaci S, Capria A, et al. Quantitative determination of hepatitis C core antigen in therapy monitoring for chronic hepatitis C. Intervirology. 2011; 54:61–65.
22. Medici MC, Furlini G, Rodella A, Fuertes A, Monachetti A, Calderaro A, Galli S, Terlenghi L, Olivares M, Bagnarelli P, et al. Hepatitis C virus core antigen: analytical performances, correlation with viremia and potential applications of a quantitative, automated immunoassay. J Clin Virol. 2011; 51:264–269.
23. Vermehren J, Susser S, Berger A, Perner D, Peiffer KH, Allwinn R, Zeuzem S, Sarrazin C. Clinical utility of the ARCHITECT HCV Ag assay for early treatment monitoring in patients with chronic hepatitis C genotype 1 infection. J Clin Virol. 2012; 55:17–22.
24. Alsiö A, Jannesson A, Langeland N, Pedersen C, Färkkilä M, Buhl MR, Mørch K, Westin J, Hellstrand K, Norkrans G, et al. Early quantification of HCV core antigen may help to determine the duration of therapy for chronic genotype 2 or 3 HCV infection. Eur J Clin Microbiol Infect Dis. 2012; 31:1631–1635.
25. Mederacke I, Wedemeyer H, Ciesek S, Steinmann E, Raupach R, Wursthorn K, Manns MP, Tillmann HL. Performance and clinical utility of a novel fully automated quantitative HCV-core antigen assay. J Clin Virol. 2009; 46:210–215.
26. Ferenci P, Fried MW, Shiffman ML, Smith CI, Marinos G, Gonçales FL Jr, Häussinger D, Diago M, Carosi G, Dhumeaux D, et al. Predicting sustained virological responses in chronic hepatitis C patients treated with peginterferon alfa-2a (40 KD)/ribavirin. J Hepatol. 2005; 43:425–433.
27. Jensen DM, Morgan TR, Marcellin P, Pockros PJ, Reddy KR, Hadziyannis SJ, Ferenci P, Ackrill AM, Willems B. Early identification of HCV genotype 1 patients responding to 24 weeks peginterferon alpha-2a (40 kd)/ribavirin therapy. Hepatology. 2006; 43:954–960.
28. Ferenci P, Laferl H, Scherzer TM, Gschwantler M, Maieron A, Brunner H, Stauber R, Bischof M, Bauer B, Datz C, et al. Peginterferon alfa-2a and ribavirin for 24 weeks in hepatitis C type 1 and 4 patients with rapid virological response. Gastroenterology. 2008; 135:451–458.
29. Jacobson IM, McHutchison JG, Dusheiko G, Di Bisceglie AM, Reddy KR, Bzowej NH, Marcellin P, Muir AJ, Ferenci P, Flisiak R, et al. Telaprevir for previously untreated chronic hepatitis C virus infection. N Engl J Med. 2011; 364:2405–2416.
30. Poynard T, Marcellin P, Lee SS, Niederau C, Minuk GS, Ideo G, Bain V, Heathcote J, Zeuzem S, Trepo C, et al. Randomised trial of interferon alpha2b plus ribavirin for 48 weeks or for 24 weeks versus interferon alpha2b plus placebo for 48 weeks for treatment of chronic infection with hepatitis C virus. International Hepatitis Interventional Therapy Group (IHIT). Lancet. 1998; 352:1426–1432.
31. Asselah T, Marcellin P. Interferon free therapy with direct acting antivirals for HCV. Liver Int. 2013; 33:Suppl 1. 93–104.
32. Schorr GS, Falcone EA, Moretti DJ, Andrews RD. First long-term behavioral records from Cuvier’s beaked whales (Ziphius cavirostris) reveal record-breaking dives. PLoS One. 2014; 9:e92633.
33. Aghemo A, Degasperi E, De Nicola S, Bono P, Orlandi A, D’Ambrosio R, Soffredini R, Perbellini R, Lunghi G, Colombo M. Quantification of core antigen monitors efficacy of direct-acting antiviral agents in patients with chronic hepatitis C virus infection. Clin Gastroenterol Hepatol. Forthcoming. 2016.
34. Pischke S, Polywka S, Proske VM, Lang M, Jordan S, Nashan B, Lohse AW, Sterneck M. Course of hepatitis C virus (HCV) RNA and HCV core antigen testing are predictors for reaching sustained virologic response in liver transplant recipients undergoing sofosbuvir treatment in a real-life setting. Transpl Infect Dis. 2016; 18:141–145.
35. Garbuglia AR, Lionetti R, Lapa D, Taibi C, Visco-Comandini U, Montalbano M, D’Offizi G, Castiglione F, Capobianchi MR, Paci P. The clinical significance of HCV core antigen detection during Telaprevir/Peg-Interferon/Ribavirin therapy in patients with HCV 1 genotype infection. J Clin Virol. 2015; 69:68–73.
36. Tillmann HL. Hepatitis C virus core antigen testing: role in diagnosis, disease monitoring and treatment. World J Gastroenterol. 2014; 20:6701–6706.
TOOLS
ORCID iDs

Mi Na Kim
https://orcid.org/http://orcid.org/0000-0001-5381-230X

Hyon-Suk Kim
https://orcid.org/http://orcid.org/0000-0001-5662-7740

Ja Kyung Kim
https://orcid.org/http://orcid.org/0000-0001-5025-6846

Beom Kyung Kim
https://orcid.org/http://orcid.org/0000-0002-5363-2496

Seung Up Kim
https://orcid.org/http://orcid.org/0000-0002-9658-8050

Jun Yong Park
https://orcid.org/http://orcid.org/0000-0001-6324-2224

Do Young Kim
https://orcid.org/http://orcid.org/0000-0002-8327-3439

Sang Hoon Ahn
https://orcid.org/http://orcid.org/0000-0002-3629-4624

Kwang-Hyub Han
https://orcid.org/http://orcid.org/0000-0003-3960-6539

Similar articles