

 PDF
PDF ePub
ePub Citation
 Print
Print


INTRODUCTION
Pulmonary fibrosis is a chronic, progressive, and irreversible condition that occurs in many clinical situations. Fibrosis-induced destruction of the lung parenchyma can be fatal (12). Pulmonary fibrosis is induced by a strong inflammatory response to lung injury. The inflammation is initiated by various immune cells—including neutrophils and eosinophils—that infiltrate lung tissue. Subsequently, the deposition of epithelial-mesenchymal transition proteins (collagen and fibronectin) and secretion of fibrotic cytokines (transforming growth factor-β [TGF-β] and insulin-like growth factor-1) increases. As a result, there is an increase in the number of fibroblasts and myofibroblasts, and these fibroblastic foci secrete extracellular matrix (ECM) components that destroy the lung parenchyma.
Bleomycin (BLM) is widely used to induce pulmonary fibrosis in animal models. The intratracheal instillation of BLM induces significant inflammatory and fibrotic reactions in murine lungs. Induction of pulmonary fibrosis by BLM is easy to perform and highly reproducible, and therefore meets the conditions for a good animal model (3). Metformin is an oral anti-diabetic drug that has exhibited a number of cardioprotective and liver protective properties. While recent studies showed that metformin had anti-inflammatory and anti-tissue remodeling effects, there are only a few studies about the effects of metformin on pulmonary fibrosis (4). In the current study, we investigated the inhibitory effect of metformin on BLM-induced pulmonary fibrosis.
MATERIALS AND METHODS
Mice
6- to 8-week-old female C57BL/6 mice were purchased from OrientBio (Gapyeong, Korea) and maintained under specific pathogen-free conditions. They were housed in an air-conditioned animal room (23°C ± 1°C; relative humidity 50% ± 10%), fed according to a laboratory diet, and given distilled water.
Study flow
Sixty-two mice were divided into 5 groups—a control group (n = 10), a metformin-only group (n = 10), a BLM-only group (n = 14), a BLM group with a low dose (50 mg/kg) of metformin (n = 14), and a BLM group with a high dose (100 mg/kg) of metformin (n = 14). Half the mice were sacrificed on day 10, and the remainder were sacrificed on day 21 (Fig. 1).
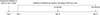 | Fig. 1Experimental protocol of our study.
Female C57BL/6 mice were treated with intratracheal instillation of bleomycin (BLM) or saline on day 0. Metformin (50 mg/kg or 100 mg/kg, according to group assignment) or PBS was administered orally once a day from day 1 onward. Half the mice were sacrificed on day 10 and the remaining mice were sacrificed on day 21.
|
Metformin treatment
Metformin was purchased from Sigma-Aldrich (St. Louis, MO, USA) and dissolved in 100 µL of phosphate-buffered saline (PBS). According to the group assignment, a high dose of metformin (100 mg/kg), a low dose of metformin (50 mg/kg), or 100 µL of PBS was administered orally, once a day from day 1 onward.
Generation of a murine BLM-induced lung fibrosis model
On day 0, mice in the BLM-only, BLM with low dose of metformin, and BLM with high dose of metformin groups were anesthetized with isoflurane and then treated with an intratracheal instillation of 0.2 units of BLM (Nippon Kayaku, Takasaki, Japan) dissolved in 100 µL of saline solution. Mice in the control and metformin-only groups received 100 µL of saline intratracheally on the same day.
Analysis of bronchoalveolar lavage fluid
To evaluate the effect of metformin on the BLM-induced recruitment of inflammatory cells, we measured the total number of cells and the number of macrophages, eosinophils, neutrophils, and lymphocytes in the bronchoalveolar lavage fluid (BALF). Bronchoalveolar lavage was performed in the left lungs with 2 sequential instillations of 1 mL of PBS using a 22-gauge catheter after the sacrifice on days 10 and 21, and the BALF was collected. The BALF was centrifuged at 1,500 rpm at 4°C for 10 minutes and the pellets were resuspended in PBS to measure the total and differential BALF cell counts. The total cell count was measured using a hemocytometer. To determine the differential cell count, the BALF was centrifuged at 1,000 rpm at room temperature for 2 minutes using cyto-centrifugation (Cytopro 7620, Wescor, Logan, UT, USA), followed by staining using a Diff-Quik stain (Sysmex, Chuo-ku, Kobe, Japan), and fixation on slides. At least 200 cells were identified as macrophages, eosinophils, neutrophils, or lymphocytes.
Histologic analysis
The right lungs were fixed in 4% paraformaldehyde solution (USB, Cleveland, OH, USA), embedded in paraffin, and sectioned into 4-µm-thick slides. The slices were stained with hematoxylin and eosin (H&E) and Masson’s trichrome (MT) to examine the extent of the inflammation and peribronchial collagen deposition. The degree of fibrosis of the lungs was assessed by an independent pathologist using the Ashcroft scoring system (5).
Isolation of RNA and real-time polymerase chain reaction (RT-PCR)
RNA was extracted from the homogenized left lung tissue using the TRIzol reagent (Ambion, Austin, TX, USA) according to the manufacturer’s protocol. The total RNA level was quantified using a NanoDrop spectrophotometer (Thermo Fisher Scientific, Wilmington, DE, USA). The target genes were identified using a Power SYBR Green PCR Master Mix (Applied Biosystems, Warrington, UK). The primer sequences used were as follows: mouse GAPDH sense: 5′-TCCCTCAAGATTGTCAGCAATG-3′ and anti-sense: 5′-AGATCCACAACGGATACATTGG-3′, Procollagen sense: 5′-TGCCGTGACCTCAAGATGTGCC-3′ and anti-sense: 5′-CATCCACAAGCGTGCTGTAGGTG-3′, Collagen-1 sense: 5′-CCTCCTGACGCATGGCCAAGA-3′ and anti-sense: 5′-TGCACGTCATCGCACACAGCC-3′, Fibronectin sense: 5′-ACCGTGTCAGGCTTCCGGGT-3′ and anti-sense: 5′-ACGGAAGTGGCCGTGCTTGG-3′, TGF-β sense: 5'-CACCGGAGAGCCCTGGATA-3' and anti-sense: 5'-TGTACAGCTGCCGCACACA-3'. The levels of mRNA were normalized to GAPDH transcripts using the 2-ddCT method.
RESULTS
Metformin reduced BLM-induced recruitment of inflammatory cells in the lungs
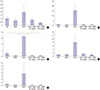
Fig. 2 shows the effect of metformin treatment on the total number of cells and inflammatory cells in BALF. The BLM treatment induced a significant increase in the total cell counts and the high metformin dosage treatment led to a significantly greater reduction in the total cell count compared with the BLM-only treatment on days 10 (Fig. 2A) and 21 (Fig. 2C) (P = 0.046 and P < 0.001, respectively). The BLM treatment significantly increased the proportion of inflammatory cells in the BALF on days 10 (Fig. 2B) and 21 (Fig. 2D), while the proportion of macrophages in the BALF decreased in the BLM-treated group compared with the control group (P < 0.001). Metformin treatment (50 mg/kg and 100 mg/kg) significantly reduced the number of eosinophils and neutrophils in the BALF on days 10 (Fig. 2B) and 21 (Fig. 2D) compared with the BLM-only treatment group.
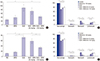 | Fig. 2Effect of metformin treatment on the total and differential cell counts in the bronchoalveolar fluid.
The total and differential cell counts in the bronchoalveolar fluid were determined on days 10 and 21 after the instillation of bleomycin (BLM). Metformin (MFM) was administered orally to mice once a day from day 1 to either day 10 or 21. Data are shown as mean ± SEM. *
P < 0.05.
(A) Total cell count on day 10. (B) Number of inflammatory cells on day 10. (C) Total cell count on day 21. (D) Number of inflammatory cells on day 21. Day 10: control, MFM, n = 5; BLM, BLM + MFM 50 mg/kg, n = 7; BLM + MFM 100 mg/kg, n = 6 (1 dead). Day 21: control, MFM-only, n = 5; BLM-only, n = 2 (5 dead); BLM + MFM 50 mg/kg, n = 4 (3 dead); BLM + MFM 100 mg/kg, n = 6 (1 dead).
|
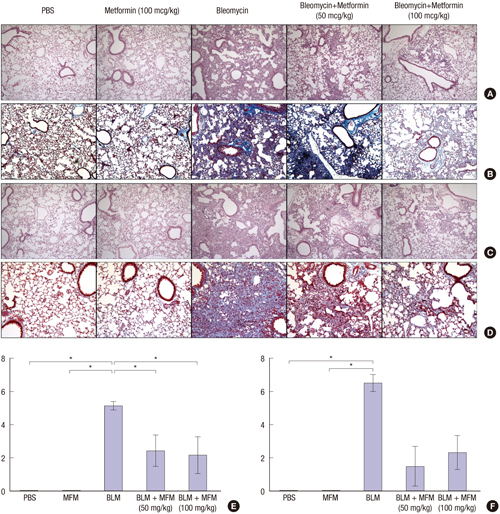
Metformin decreased BLM-induced inflammation, fibrosis, and collagen deposition in lung tissue
The lung sections of the mice in the BLM-only treatment group showed increased inflammation and fibrosis associated with the destruction of normal lung structures, compared with the control and metformin-only treatment groups. The histological analysis with the H&E stain of the sections from the metformin-treated mice showed decreased infiltration by the inflammatory cells compared with that in the sections from the BLM-treated mice. Furthermore, the analysis with the MT stain revealed significantly reduced deposition of collagen and fibrosis in sections from the metformin-treated mice on days 10 and 21 (Fig. 3). Under the Ashcroft scoring system for the degree of fibrosis, the mice in the BLM with metformin groups (50 mg/kg and 100 mg/kg) showed lower scores than the mice in the BLM-only treatment group on days 10 (Fig. 3E) and 21 (Fig. 3F). Although the difference in the Ashcroft scores between the BLM-only and the BLM with metformin groups was only statistically significant on day 10 (P =0.043), the trend was similar on day 21 (BLM-only vs. BLM with metformin [50 mg/kg], P = 0.051; BLM-only vs. BLM with metformin [100 mg/kg], P = 0.069).
 | Fig. 3Effect of metformin on the infiltration of inflammatory cells and collagen deposition in the lungs of BLM-treated mice.
(A) Histologic findings with hematoxylin & eosin (H & E) staining on day 10. (B) Histologic findings with Masson’s trichrome staining on day 10. (C) Histologic findings with H & E staining on day 21. (D) Histologic findings with Masson’s trichrome staining on day 21. (E) Ashcroft fibrosis scores on day 10. (F) Ashcroft fibrosis score on day 21. Representative magnification, × 200.
|
Measurement of mRNA levels in the lungs
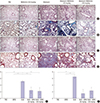
We examined the effects of metformin on the expression of the genes for collagen, collagen-1, procollagen, fibronectin, and TGF-β in the lung tissue using quantitative RT-PCR on day 21. The BLM treatment significantly increased the mRNA levels of collagen, collagen-1, procollagen, fibronectin, and TGF-β compared with the negative control on day 21. The metformin treatment decreased the mRNA levels of collagen, collagen-1, procollagen, fibronectin, and TGF-β in the lung tissue compared with the BLM treatment; however, this decrease was not statistically significant—except for procollagen—due to the small number of live mice in the BLM-only treatment group (Fig. 4).
 | Fig. 4mRNA levels of collagen, collagen-1, procollagen, fibronectin, and TGF-β in lung tissue on day 21.
(A) Collagen, (B) collagen-1, (C) procollagen, (D) fibronectin, (E) TGF-β. Day 21: control, MFM, n = 5; BLM, n = 2 (5 dead); BLM + MFM 50 mg/kg, n = 4 (3 dead); BLM + MFM 100 mg/kg, n = 6 (1 dead). *P < 0.05.
|
DISCUSSION
In our study, we have shown that metformin reduces the degree of lung inflammation and pulmonary fibrosis in a murine model of BLM-induced pulmonary fibrosis. Pulmonary fibrosis is characterized by excessive deposition of ECM proteins synthesized by fibroblasts. Collagens are the predominant ECM proteins and fibronectins are multifunctional glycoproteins found in the ECM. Metformin is a drug used for treating type 2 diabetes mellitus. It has various other effects in addition to its anti-diabetic effect. One such effect is the anti-fibrotic effect on several organ systems. A previous study reported that metformin inhibited cardiac fibrosis and collagen synthesis in cardiac fibroblasts via inhibition of the TGF-β1 and Smad3 signaling pathways (6). Another recent study demonstrated that metformin has an inhibitory effect on angiotensin II-induced myofibroblast differentiation (7), which is a critical process in cardiac fibrosis that leads to cardiac remodeling (8). Recently, it was reported that metformin reduced renal fibrosis by the activation of adenosine monophosphate-activated protein kinase (AMPK) (9). The beneficial effect of metformin in patients with liver cirrhosis was demonstrated in another study (10). The authors of that study suggested that metformin might slow the progression of liver fibrosis by attenuating steatohepatitis; there is evidence from several other studies to show that metformin prevents and reverses inflammation in a mouse model of non-alcoholic steatohepatitis (111213). However, the data on the anti-fibrotic effect of metformin in pulmonary fibrosis to date have been sparse. Therefore, we performed the present study with a murine model of BLM-induced pulmonary fibrosis to investigate whether metformin has anti-fibrotic effects in pulmonary fibrosis.
BLM-induced pulmonary fibrosis is widely used as an experimental model for research on pulmonary fibrosis. BLM induces an acute inflammatory response during the early phase (7 to 10 days) (14). Subsequently, the inflammation decreases and fibrotic changes occur and persist throughout the late phase (3 to 4 weeks) following the BLM instillation (15). Therefore, we sacrificed mice on days 10 and 21 to investigate the effect of metformin on BLM-induced inflammation and fibrosis, respectively.
In our present study, the total cell count in the BALF, which was obtained from the mice in the BLM-only treatment group, was significantly greater than the total cell count in the negative control and metformin-only treatment groups (Fig. 2A). The proportion of macrophages, a major cell type in the BALF of normal lungs, was lower in the BLM-only mice. On the other hand, the proportions of eosinophils, neutrophils, and lymphocytes in the BALF were higher in the BLM-only mice compared with those in the control and metformin-only groups. When metformin was given daily to mice in the BLM groups, the neutrophil count was significantly lower than that in the BLM-only mice on days 10 and 21 (P < 0.001). Similar results were observed in the counts of eosinophils and lymphocytes, although statistical significance was found only on day 21.
To examine the effect of metformin on fibrosis, we analyzed the expression of profibrotic genes, including collagen, collagen-1, procollagen, fibronectin, and TGF-β, using quantitative RT-PCR on day 21. As expected, the BLM treatment significantly increased the mRNA levels of collagen, collagen-1, procollagen, fibronectin, and TGF-β compared with the negative control. Both the high and low doses of metformin treatment caused marked reductions in the mRNA levels of collagen, collagen-1, procollagen, fibronectin, and TGF-β compared with the BLM treatment. However, the decrease was not statistically significant—except for procollagen—due to the small number of live mice in the BLM-only treatment group on day 21 (Fig. 4).
Although we did not evaluate the intracellular mechanism of metformin in the murine model of pulmonary fibrosis, a previous study suggested that the anti-inflammatory and anti-fibrotic effects of metformin might involve AMPK activation, which in turn may regulate tissue fibrosis. As previously reported, AMPK is activated by drugs such as metformin in addition to various cellular processes. AMPK detects the cellular energy status and oxidative stress, plays a role in cell proliferation and protein synthesis, and suppresses nicotinamide adenine dinucleotide phosphate-oxidase, which causes oxidative stress in the cardiovascular system (16). A previous study on the effect of metformin on airway inflammation and remodeling showed that the inflammation and gene expression of fibronectin and collagen-1 was higher in BLM-treated AMPKα1-deficient mice in comparison with wild-type mice (4). This study also showed that an AMPKα1 inhibitor restored the inhibitory effect of metformin on TGF-β1-induced fibronectin production and expression in AMPKα1-knockdown human bronchial fibroblast cell lines.
There were several limitations in the present study. First, we only investigated the effect of metformin treatment on BLM-induced inflammation and fibrosis without further evaluation of the underlying mechanism. Second, since only 2 mice were alive in the BLM-only treatment group on day 21, the result of the metformin treatment cannot be generalized, and we did not detect a statistically significant effect on pulmonary fibrosis. Third, the effect of metformin in our study might be more preventive as opposed to therapeutic. This is because we administered metformin from day 1, before the fibrosis occurred.
In conclusion, metformin decreases the airway inflammation and tissue fibrosis in BLM-induced pulmonary fibrosis in a murine model. Therefore, metformin might be a candidate for the treatment of a part of pulmonary fibrosis. Further investigation is needed to evaluate the intracellular mechanisms of metformin in pulmonary fibrosis and its clinical applications.
 XML Download