Journal List > J Korean Med Sci > v.31(1) > 1023071

Park, Ahn, Shin, Cha, and Ro: The Effect of Emergency Medical Service Use and Inter-hospital Transfer on Prehospital Delay among Ischemic Stroke Patients: A Multicenter Observational Study

Abstract

The time between symptom onset and arrival at an emergency department (ED) (S2D) is a crucial time for optimal intravenous reperfusion care for ischemic stroke. We aimed to analyze the effect of emergency medical services (EMS) utilization and inter-hospital transfer on S2D in Korea. Ischemic stroke patients were prospectively enrolled from November 2007 to December 2012 in 23 tertiary and teaching hospital EDs in Korea. Of 31,443 adult ischemic stroke patients, 20,780 were categorized into 4 groups based on modes of EMS utilization and inter-hospital transfer: direct transport to destination ED by EMS (EMS direct; n=6,257, 30.1%), transfer after transport to another ED by EMS (EMS indirect; n=754, 3.6%), direct transport to the ED without using EMS (non-EMS direct; n=8,928, 43.0%), and transfer after visiting another hospital without using EMS (non-EMS indirect; n=4,841, 23.3%). Our primary outcome variable was of S2D within 2 hr (S2D ≤2 hr) and found that 30.8% of all patients and 52.3%, 16.4%, 25.9%, and 13.9% of EMS direct, EMS indirect, non-EMS direct, and non-EMS indirect, respectively, achieved S2D ≤2 hr. Adjusted odds ratio for S2D ≤2 hr were 6.56 (95% confidence interval [CI], 5.94-7.24), 2.27 (95% CI, 2.06-2.50), and 1.07 (95% CI, 0.87-1.33) for EMS direct, non-EMS direct, and EMS indirect, respectively. Patients directly transported to destination hospitals by the EMS show the highest proportion of therapeutic time window for optimal care in ischemic stroke.

Graphical Abstract

jkms-31-139-abf001

INTRODUCTION

Stroke occurs in approximately 15 million people every year throughout the world, 5 million of whom die and 5 million of whom live with a permanent disability (1). In the United States, 795,000 stroke patients are newly diagnosed each year, and according to a survey in 2009, 1 in 19 people died due to stroke (2). In Korea, mortality from cerebrovascular disease in 2013 was 50.3 per 100,000 population, which was lower compared with 51.1 per 100,000 in 2012, but it still accounted for the second most common cause of death after cancer.
Treatment guidelines for stroke patients recommend administration of recombinant tissue plasminogen activator (rtPA) within a therapeutic time window and direct transportation to a specialized stroke center (345). However, the therapeutic rate of cerebral infarct patients is only 1.6% to 18%. Prehospital delay is a major factor associated with a low therapeutic rate (678910). In previous studies, patients who arrived at the hospital within a therapeutic window of time more frequently arrived by ambulance (11). It has been reported that the rate of treatment with rtPA increased from 10% for patients with standard priority to 24% for patients who were transported directly to a specialized stroke center with level 1 priority care (12). Several studies of inter-hospital transfer of stroke patients demonstrated factors associated with prehospital delay, such as specialized neuroimaging at the referring hospital (131415). Emergency medical service (EMS) use and inter-hospital transfer are important factors in prehospital delay, although with opposite direction of association, in ischemic stroke patients. In-depth studies of the interactive effect of EMS use and inter-hospital transfer are rare, and we found no studies considering whether patients were transferred to the referred hospital via EMS.
We analyzed the effects of EMS use on prehospital delay, including tracking the mode of transport to the referred hospital. Interaction between visit routes (direct visit or transferred from another hospital) and EMS use on prehospital delay was also analyzed using a nationwide, multicenter registry.

MATERIALS AND METHODS

Study setting

The EMS is a public transportation system operated by a single call number, 1-1-9, and provides services for free to anyone in Korea. They offer single-tiered basic life support service (16). The 1-1-9 prehospital emergency care protocols for presumed stroke patients were established in 2012 by the National Emergency Management Agency. These protocols included a prehospital stroke screening tool and direct transport to hospitals that had the capacity to manage ischemic stroke, including intravenous thrombolysis. Administration of intravenous thrombolysis before hospital arrival is not allowed in Korea (17).
The Ministry of Health and Welfare in Korea has created programs for developing regional centers for cardiovascular disease and successfully established 11 regional cardiovascular centers between 2008 and 2012.

Study subjects

The Cardiovascular Disease Surveillance (CAVAS) project was a nationwide prospective stroke registry sponsored by the Korea Centers for Disease Control and Prevention. The objectives of the program were to identify the epidemiologic patterns, including the risk factors, for cardiovascular disease and to collect data on the characteristics and quality of medical care before and after hospitalization for such patients. These data were collected from detailed hospital medical records of 29 emergency departments (EDs) across the country. During the study period (November 1, 2007, to December 31, 2012), patients diagnosed with acute stroke were enrolled. Ischemic stroke was diagnosed based on brain imaging and clinical assessment in the ED, and for final analysis, we included adult (age over 18 yr) ischemic stroke patients with ICD-10 code I63.0-I63.9 when they were discharged from the ED. Only patients who arrived at the first ED within 24 hr of onset were included (18). Patients were excluded if there was no information about the time of stroke onset or arrival at the final hospital, EMS use, and route of visit (direct or transferred). We also excluded patients who were administered thrombolysis before inter-hospital transfer.

Data collection and variables

Trained study coordinators collected basic information for each variable using a structured case report registry. The monthly data quality management process provided feedback to each participating hospital. For patient information, demographic data (age and sex), socioeconomic data (insurance status and level of urbanization), and clinical information (chief complaints at presentation and past medical history) were collected. Time data such as time of symptom onset and arrival at referred or final hospital were collected. Mode of visit (EMS use or not) and route of visit (direct or transferred) were also collected. We also presented death and neurologic outcomes at discharge. Neurologic outcomes were divided as favorable or poor according to the Modified Rankin Score (MRS). Favorable is equivalent to MRS 0 to 3, and poor is equivalent to MRS 4 to 6. The first medical contact time was defined as the time that the 1-1-9 call was accepted for patients who used EMS and the time that the patient arrived at the first or final hospital for patients who did not use EMS.
Patients were categorized into 4 groups according to EMS use and inter-hospital transfer: directly transported to the final ED by EMS (EMS direct), transferred to the final ED after being transported to a referred hospital by EMS (EMS indirect), directly visited final ED without using EMS (non-EMS direct), and transferred to final ED after visit to referred hospital without using EMS (non-EMS indirect).

Outcomes

Our primary outcome was symptom onset (S) to definitive care hospital (D) within 2 hr (S2D ≤2 hr), and our secondary outcome was symptom onset to definitive care hospital within 1 hr (S2D ≤1 hr). Symptom onset time was defined as the time of symptom recognition or the last time that the patient felt normal. The American Heart Association/American College of Cardiology guidelines for the treatment of ischemic stroke recommend intravenous thrombolysis for patients who arrive at the hospital within 3 hr of symptom onset and for this treatment to be administered within 90 min of arrival at the hospital (19). We chose our outcome variables based on practical considerations and recommended guidelines.

Statistical analysis

The continuous variables, including times, are presented as medians with interquartile ranges and were compared using the Kruskal-Wallis or Wilcoxon rank-sum test. The categorical variables are presented as numbers with proportions and were compared using the chi-square test. A multivariate logistic regression analysis was carried out between the 4 patient groups and S2D ≤2 hr. We considered demographic variables, socioeconomic variables, past medical history, and chief complaints at arrival as covariates. We also calculated adjusted odds ratios (AORs) and 95% confidence intervals (95% CIs) with the same covariates and S2D ≤1 hr. A P value <0.05 was defined as statistically significant.

Ethics statement

The institutional review board at Seoul National University Hospital approved the data collection for this study. The need for informed consent was waived by the board (IRB number; 1012-134-346).

RESULTS

Of 31,443 adult ischemic stroke patients, 9,002 patients were excluded because their symptom onset to hospital arrival time was over 24 hr. The 836 patients with unknown symptom onset to hospital arrival time were also excluded as were patients whose information about EMS use or route of visit was not recorded. In addition, 302 patients with thrombolysis before transfer were excluded. Therefore, 20,780 patients were included in the final analysis. Only 34% (7,011) had used the EMS; 26.9% (5,595) underwent inter-hospital transfer, and among the transferred patients, 13.5% (754) were transported via EMS to a referred hospital (Fig. 1).
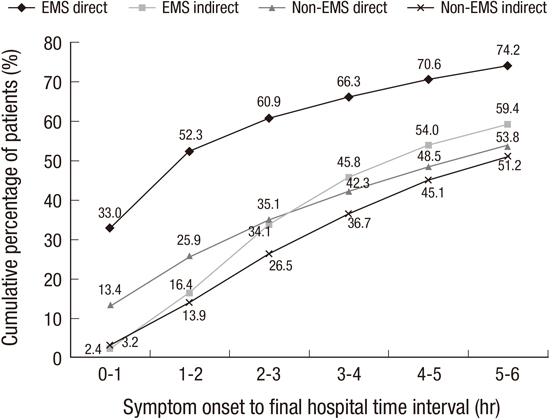
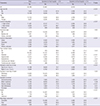
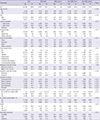
Table 1 shows the characteristics of the patients in the study. A majority of patients (63.3%) were over 65 yr old, and 41.5% were women. The highest proportion of patients (61.5%) presented with motor weakness as their primary symptom. In the S2D ≤2 hr group, the highest proportion of patients presented with unconsciousness (42.5%). In the EMS direct group, 52.3% of patients arrived within 2 hr, whereas in the non-EMS direct, EMS indirect, and non-EMS indirect groups, only 25.9%, 16.4%, and 13.9%, respectively, arrived within 2 hr (Fig. 2).
The patients who used EMS were significantly older than those who did not. The symptoms at presentation also differed significantly among the 4 groups; in particular, there was a higher proportion presenting with unconsciousness in the EMS group, especially in the EMS indirect group (36.2% vs. 24.5% in the EMS direct group, 19.1% in the non-EMS indirect group, and 7.2% in the non-EMS direct group) (Table 2).
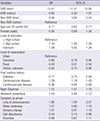
Multivariate analysis was conducted between the 4 groups and S2D ≤2 hr and S2D ≤1 hr (Tables 3 and 4). The adjusted covariates for multivariate logistic regression were the variables that showed significant differences among the 4 groups (P<0.01). AORs (95% CIs) for arrival within the therapeutic time window (S2D ≤2 hr and S2D ≤1 hr) were 6.56 (5.94-7.24) for the EMS direct group compared with the non-EMS indirect group (reference). AORs (95% CIs) for S2D ≤2 hr were 1.07 (0.87-1.33) for the EMS indirect group and 2.27 (2.06-2.50) for the non-EMS direct group (Table 3).

DISCUSSION

This was a multicenter nationwide prospective study to characterize in detail ischemic stroke patients who arrive at the final hospital within the therapeutic time window according to visit mode and route of visit. Only 40% of patients in Korea arrived at the final hospital within 2 hr of symptom onset. EMS use was associated with arrival within the time window, but inter-hospital transfer showed a negative effect. Specifically, even with EMS use, the proportion of transferred patients who arrived at the final hospital within 2 hr was approximately 16%.
After analyzing data from the Get With the Guidelines-Stroke database, a data-collecting system including 905 hospitals in the United States, Saver et al. (11) reported in 2010 that 60% of direct visit patients arrived at the hospital within 3 hr of onset and 28% arrived within 1 hr, which is higher than what we found in our study. In our study, the proportion of direct visit patients in the S2D≤2 hr group was 40.0% (8,319) regardless of EMS use. Differences in the rate of EMS use may explain the difference. In our study, only 33.7% (7,011) of the study subjects activated the EMS, which is lower than the 47.6% in the Paul Coverdell National Acute Stroke Registry Surveillance covering 4 states from 2005 to 2007 in the United States (20) and other countries (21222324). In a previous nationwide survey about stroke awareness in Korea, only 33% had some knowledge of the proper action (to call EMS) (25). Also, time intervals from symptom onset to a call for EMS were significantly different between patients who arrived within 2 hr or not. Therefore, we need to adopt a new strategy to educate the public in recognition of symptoms suggestive of stroke and early medical contact.
The cumulative percentage of patients who arrived within 2 hr after symptom onset was highest in the groups who used EMS and were directly transported to the destination hospital. However, slightly higher proportions of patients in the non-EMS direct group arrived within 2 hr compared with those in the EMS indirect group (25.9% vs. 16.4%; Table 2). Approximately 23% of patients who did not use EMS arrived at the final hospital via other hospitals, but only 3.6% of those who used EMS arrived via other hospitals. This result suggests that even when patients recognize symptoms early, there is a greater chance of choosing the wrong hospital if the patient decides to not use EMS. Thus, using EMS if someone has symptoms suggestive of stroke should be emphasized in public education.
In the transferred groups, only 16.4% (EMS group) and 13.9% (non-EMS group) of the patients arrived at the final ED within 2 hr after onset (Fig. 2). Delivering the acute ischemic stroke patient to a comprehensive stroke center is important to increase the rate of intravenous rtPA administration. Symptom onset to definitive care after the treatment window due to transfer delay is also a common cause of exclusion for intra-arterial thrombolysis (26). For direct transportation to a comprehensive stroke center, EMS providers should be trained to screen for presumed stroke in the field. Prehospital stroke screening (PHSS) tools have been developed and are widely used in many EMS agencies in developed countries (272829). In Korea, results of a study to validate the PHSS performed by 1-1-9 EMS providers were comparable with previous studies (30). Another consideration to encourage direct transportation to a comprehensive stroke center is that information for a hospital's capacity for thrombolysis for ischemic stroke patients should be provided to EMS providers. Through an emergency information center in Korea, real-time monitoring of the thrombolysis capacity of emergency centers is available to citizens via the internet (30). Improving the quality of this information and encouraging active use of this information by EMS providers might increase the rate of direct transportation to comprehensive stroke centers.
Inter-hospital transportation is sometimes unavoidable, especially in geographically vulnerable areas, but efforts for reducing unnecessary delay during inter-hospital transport are essential for regionalization of the process of care for stroke patients. Several studies have focused on factors associated with delays during inter-hospital transfer of stroke patients (313233). Brain imaging studies, especially magnetic resonance imaging or perfusion computed tomography, at the referring hospitals were pointed out as one reason for delay. Regional cardiovascular centers established by the Ministry of Health and Welfare in Korea were comparable with comprehensive stroke centers in the United States, but primary stroke care centers that refer patients to comprehensive stroke centers have not been established in Korea. This weak point of regionalization in Korea is one possible explanation for our result that inter-hospital transfer attenuated the effects on arrival within the therapeutic time window through EMS use. For regionalization and reducing delay during inter-hospital transfer, a supporting program for referring hospitals, including development of a protocol for transfer and quality control, is needed.
Our study has several limitations. First, all hospitals in our study were academic teaching hospitals. The CAVAS program was an observational study that involved hospitals that volunteered to participate in the program, and these tended to be larger and more specialized than nonparticipating hospitals. Second, our analysis did not include the severity of the strokes at presentation, for example, as assessed by the National Institutes of Health Stroke Scale (NIHSS), because this was not recorded in the CAVAS registry. Severity of symptoms is one of the factors associated with prehospital delay and an important determinant of EMS use (34353637). Instead of NIHSS, we used symptoms at arrival such as loss of consciousness and motor weakness as surrogates of severity for adjustment in multivariate logistic regression (Tables 3 and 4).
In conclusion, the patients who are directly transported to the destination hospitals by the EMS show the highest proportion of arriving within the therapeutic time window for optimal care for ischemic stroke. Owing to the time-dependent properties of stroke treatment, a system of stroke care comprising the community, the EMS, and hospitals should be strengthened.

Figures and Tables

Fig. 1

Patient flow. EMS, Emergency medical services; Direct, arrived final hospital directly; Indirect, arrived final hospital via other hospital.

jkms-31-139-g001
Fig. 2

Cumulative percentage of patients according to time interval to final hospital arrival from symptom onset. EMS, Emergency medical services; Direct, arrived final hospital directly; Indirect, arrived final hospital via other hospital.

jkms-31-139-g002
Table 1

Demographics between patient who arrived final hospital within 2 hours or not after symptom onset

jkms-31-139-i001
Parameters Total Symptom to final hospital >2 hr Symptom to final hospital ≤2 hr P value
No. No. % No. %
All 20,780 12,461 8,319
Age over 65 < 0.01
 No 7,622 5,164 67.8 2,458 32.2
 Yes 13,158 9,226 70.1 3,932 29.9
Sex 0.11
 Male 12,153 8,364 68.8 3,789 31.2
 Female 8,627 6,026 69.9 2,601 30.1
Level of education < 0.01
 < High school 11,401 8,107 71.1 3,294 28.9
 ≥ High school 8,005 5,337 66.7 2,668 33.3
 Unknown 1,374 946 68.9 428 31.1
Insurance type 0.62
 NHI 19,579 13,544 69.2 6,035 30.8
 Medical aid 1,001 707 70.6 294 29.4
 Others, unknown 200 139 69.5 61 30.5
Level of urbanization < 0.01
 Urban 7,076 4,582 64.8 2,494 35.2
 Suburban 5,004 3,539 70.7 1,465 29.3
 Rural 2,393 1,873 78.3 520 21.7
 Others, unknown 6,307 4,396 69.7 1,911 30.3
Past medical history
 No 325 223 68.6 102 31.4 0.43
 Yes 20,455 14,167 69.3 6,288 30.7
 Diabetes 5,377 3,927 73.0 1,450 27.0 < 0.01
 Hypertension 12,072 8,393 69.5 3,679 30.5 0.11
 Dyslipidemia 1,527 1,060 69.4 467 30.6 0.24
 Cardiovascular disease 3,904 2,422 62.0 1,482 38.0 < 0.01
 Cerebrovascular disease 862 588 68.2 274 31.8 0.03
Symptom onset hour of day < 0.01
 Day (6 a.m.-6 p.m.) 12,196 8,628 70.7 3,568 29.3
 Night (7 p.m.-5 a.m.) 8,584 5,762 67.1 2,822 32.9
Symptom onset day of week 0.05
 Weekdays 14,825 10,324 69.6 4,501 30.4
 Weekend 5,955 4,066 68.3 1,889 31.7
Symptom at arrival 0.05
 Unconsciousness 3,375 1,940 57.5 1,435 42.5 < 0.01
 Motor weakness 12,784 8,856 69.3 3,928 30.7 0.38
 Sensory change 5,423 3,847 70.9 1,576 29.1 < 0.01
 Gait disturbance 2,630 1,884 71.6 746 28.4 0.01
 Dizziness 2,763 1,970 71.3 793 28.7 0.02
Death < 0.01
 No 17,718 12,367 69.8 5,351 30.2
 Yes 776 443 57.1 333 42.9
 Unknown 2,286 1,580 69.1 706 30.9
Neurologic outcomes* < 0.01
 Favorable 14,964 10,496 70.1 4,468 29.9
 Poor 4,887 3,265 66.8 1,622 33.2
 Unknown 929 629 67.7 300 32.3

Favorable is equivalent to MRS 0 to 3 and poor is equivalent to MRS 4 to 6. *Neurologic outcomes at discharge were divided as favorable or poor according to Modified Rankin Score (MRS). NHI, national health insurance.

Table 2

Demographics between patient using EMS and transferred from other hospitals

jkms-31-139-i002
Parameters Total EMS direct EMS indirect Non-EMS direct Non-EMS indirect P value
No. % No. % No. % No. % No. %
All 20,780 100.0 6,257 30.1 754 3.6 8,928 43.0 4,841 23.3
Age over 65 < 0.01
 No 7,622 36.7 1,915 30.6 249 33.0 3,733 41.8 1,725 35.6
 Yes 13,158 63.3 4,342 69.4 505 67.0 5,195 58.2 3,116 64.4
Sex < 0.01
 Male 12,153 58.5 3,545 56.7 427 56.6 5,431 60.8 2,750 56.8
 Female 8,627 41.5 2,712 43.3 327 43.4 3,497 39.2 2,091 43.2
Level of education < 0.01
 < High school 11,401 54.9 3,480 55.6 497 65.9 4,491 50.3 2,933 60.6
 ≥ High school 8,005 38.5 2,378 38.0 222 29.4 3,907 43.8 1,498 30.9
 Unknown 1,374 6.6 399 6.4 35 4.6 530 5.9 410 8.5
Insurance type < 0.01
 NHI 19,579 94.2 5,839 93.3 692 91.8 8,525 95.5 4,523 93.4
 Medical aid 1,001 4.8 360 5.8 49 6.5 332 3.7 260 5.4
 Others, unknown 200 1.0 58 0.9 13 1.7 71 0.8 58 1.2
Level of urbanization < 0.01
 Urban 7,076 34.1 2,618 41.8 114 15.1 3,257 36.5 1,087 22.5
 Suburban 5,004 24.1 1,315 21.0 187 24.8 2,102 23.5 1,400 28.9
 Rural 2,393 11.5 372 5.9 160 21.2 801 9.0 1,060 21.9
 Others, unknown 6,307 30.4 1,952 31.2 293 38.9 2,768 31.0 1,294 26.7
Past medical history < 0.01
 No 325 1.6 119 1.9 17 2.3 144 1.6 45 0.9
 Yes 20,455 98.4 6,138 98.1 737 97.7 8,784 98.4 4,796 99.1
 Diabetes 5,377 25.9 1,606 25.7 159 21.1 2,431 27.2 1,181 24.4 < 0.01
 Hypertension 12,072 58.1 3,820 61.1 414 54.9 5,125 57.4 2,713 56.0 < 0.01
 Dyslipidemia 1,527 7.3 455 7.3 46 6.1 709 7.9 317 6.5 0.07
 Cardiovascular disease 3,904 18.8 1,466 23.4 180 23.9 1,447 16.2 811 16.8 < 0.01
 Cerebrovascular disease 4,200 20.2 1,363 21.8 137 18.2 1,949 21.8 751 15.5 < 0.01
Symptom onset hour of day 0.05
 Day (6 a.m.-6 p.m.) 12,196 58.7 3,607 57.6 421 55.8 5,310 59.5 2,858 59.0
 Night (7 p.m.-5 a.m.) 8,584 41.3 2,650 42.4 333 44.2 3,618 40.5 1,983 41.0
Symptom onset day of week < 0.01
 Weekdays 14,825 71.3 4,450 71.1 518 68.7 6,271 70.2 3,586 74.1
 Weekend 5,955 28.7 1,807 28.9 236 31.3 2,657 29.8 1,255 25.9
Symptom at arrival
 Unconsciousness 3,375 16.2 1,531 24.5 273 36.2 645 7.2 926 19.1 < 0.01
 Motor weakness 12,784 61.5 3,915 62.6 510 67.6 5,322 59.6 3,037 62.7 < 0.01
 Sensory change 5,423 26.1 1,330 21.3 147 19.5 2,566 28.7 1,380 28.5 < 0.01
 Gait disturbance 2,630 12.7 752 12.0 111 14.7 1,034 11.6 733 15.1 < 0.01
 Dizziness 2,763 13.3 819 13.1 78 10.3 1,197 13.4 669 13.8 < 0.01
Symptom onset to arrival within 2 hr < 0.01
 Sx. to FMC (hr), median (IQR) 3.1 0.9-9.4 1.3 0.3-5.9 0.3 0.1-2.5 5.3 2.0-12.2 1.5 0.5-5.4 < 0.01
 No 14,390 69.2 2,982 47.7 630 83.6 6,612 74.1 4,166 86.1
 Yes 6,390 30.8 3,275 52.3 124 16.4 2,316 25.9 675 13.9
Sx. onset to arrival within 1 hr < 0.01
 No 17,348 83.5 4,195 67.0 736 97.6 7,733 86.6 4,684 96.8
 Yes 3,432 16.5 2,062 33.0 18 2.4 1,195 13.4 157 3.2
Death < 0.01
 No 17,718 85.3 5,113 81.7 597 79.2 7,846 87.9 4,162 86.0
 Yes 776 3.7 394 6.3 53 7.0 162 1.8 167 3.4
 Unknown 2,286 11.0 750 12.0 104 13.8 920 10.3 512 10.6
Neurologic outcomes* < 0.01
 Favorable 14,964 72.0 3,935 62.9 414 54.9 7,320 82.0 3,295 68.1
 Poor 4,887 23.5 1,979 31.6 299 39.7 1,269 14.2 1,340 27.7
 Unknown 929 4.5 343 5.5 41 5.4 339 3.8 206 4.3

*Neurologic outcomes at discharge were divided as favorable or poor according to Modified Rankin Score (MRS). Favorable is equivalent to MRS 0 to 3 and poor is equivalent to MRS 4 to 6. Only 17,030 patients were used for analysis. The P value was obtained from Kruskal-Wallis test. EMS, emergency medical services; Direct, arrived final hospital directly; Indirect, arrived final hospital via other hospital; NHI, national health insurance; Sx., symptom, FMC, first medical contact.

Table 3

Multivariate logistic regression models for association between 4 groups and symptom to final hospital within 2 hr

jkms-31-139-i003
Variables OR 95% CI
EMS direct 6.56 5.94-7.24
EMS indirect 1.07 0.87- 1.33
Non-EMS direct 2.27 2.06-2.50
Non-EMS indirect Reference
Age over 65 yr (under 65) 0.79 0.74-0.85
Female (male) 0.97 0.90-1.04
Level of education
 <High school Reference
 ≥ High school 1.14 1.06-1.23
 Unknown 1.13 0.99-1.28
Level of urbanization
 Urban Reference
 Suburban 0.93 0.86-1.01
 Rural 0.82 0.72-0.92
 Others, unknown 0.88 0.81-0.95
Past medical history
 Diabetes 0.75 0.70-0.81
 Cardiovascular disease 1.39 1.29-1.51
 Cerebrovascular disease 0.97 0.90-1.05
Night (Daytime) 1.19 1.11-1.26
Weekend (weekdays) 1.05 0.98-1.13
Symptom at arrival
 Loss of consciousness 1.84 1.69-2.02
 Motor weakness 1.11 1.03-1.18
 Sensory change 1.06 0.98-1.14
 Gait disturbance 0.91 0.83-1.01
 Dizziness 0.97 0.88-1.07

Adjusted for age over 65 yr, sex, education level, level of urbanization, past medical history (diabetes, cardiovascular disease, cerebrovascular disease), symptom onset hour of day, symptom onset day of week, and presentation symptoms at arrival. OR, Odds ratio; 95% CI, 95% confidence interval; EMS, Emergency medical services; Direct, arrived final hospital directly; Indirect, arrived final hospital via other hospital. Reference values are shown in parentheses.

Table 4

Multivariable logistic regression models for association between 4 groups and symptom to final hospital within 1 hr

jkms-31-139-i004
Variables OR 95% CI
EMS direct 13.41 11.31 15.90
EMS indirect 0.65 0.40 1.07
Non-EMS direct 4.56 3.84 5.43
Non-EMS indirect Reference
Age over 65 (under 65) 0.71 0.65 0.77
Female (male) 0.95 0.88 1.04
Level of education
 <High school Reference
 ≥ High school 1.18 1.08 1.29
 Unknown 1.08 0.92 1.28
Level of urbanization
 Urban Reference
 Suburban 0.86 0.78 0.96
 Rural 0.49 0.41 0.58
 Others, unknown 0.82 0.75 0.90
Past medical history
 Diabetes 0.77 0.70 0.84
 Cardiovascular disease 1.29 1.18 1.43
 Cerebrovascular disease 0.88 0.80 0.98
Night (Daytime) 1.10 1.01 1.19
Weekend (weekdays) 1.03 0.94 1.12
Symptom at arrival
 Loss of consciousness 1.86 1.68 2.07
 Motor weakness 1.07 0.98 1.16
 Sensory change 1.07 0.97 1.18
 Gait disturbance 0.84 0.74 0.96
 Dizziness 0.98 0.87 1.11

Adjusted for age over 65, sex, education level, level of urbanization, past medical history (diabetes, cardiovascular disease, cerebrovascular disease), symptom onset hour of day, symptom onset day of week, and presentation symptoms at arrival. OR, Odds ratio; 95% CI, 95% confidence interval, EMS, Emergency medical services; Direct, arrived final hospital directly; Indirect, arrived final hospital via other hospital. Reference values are presented in parentheses.

Notes

Funding The current study was financially supported by the Korea Centers for Disease Control and Prevention (2008-2011).

DISCLOSURE The authors have no conflicts of interest to disclose.

AUTHOR CONTRIBUTION Study conception and design: Park HA. Data acquisition: Shin SD. Analysis and interpretation of data: Cha WC, Young SR. Writing: Park HA. Critical review and revision: Ahn KO. Supervision of the study: Ahn KO.

References

1. WHO publishes definitive atlas on global heart disease and stroke epidemic. Indian J Med Sci. 2004; 58:405–406.
2. Go AS, Mozaffarian D, Roger VL, Benjamin EJ, Berry JD, Borden WB, Bravata DM, Dai S, Ford ES, Fox CS, et al. Heart disease and stroke statistics--2013 update: a report from the American Heart Association. Circulation. 2013; 127:e6–e245.
3. Tissue plasminogen activator for acute ischemic stroke. The National Institute of Neurological Disorders and Stroke rt-PA Stroke Study Group. N Engl J Med. 1995; 333:1581–1588.
4. How do stroke units improve patient outcomes? A collaborative systematic review of the randomized trials Stroke Unit Trialists Collaboration. Stroke. 1997; 28:2139–2144.
5. Marler JR, Tilley BC, Lu M, Brott TG, Lyden PC, Grotta JC, Broderick JP, Levine SR, Frankel MP, Horowitz SH, et al. Early stroke treatment associated with better outcome: the NINDS rt-PA stroke study. Neurology. 2000; 55:1649–1655.
6. Barber PA, Zhang J, Demchuk AM, Hill MD, Buchan AM. Why are stroke patients excluded from TPA therapy? An analysis of patient eligibility. Neurology. 2001; 56:1015–1020.
7. Demaerschalk BM, Bobrow BJ, Paulsen M. Development of a metropolitan matrix of primary stroke centers: the Phoenix experience. Stroke. 2008; 39:1246–1253.
8. Johnston SC, Fung LH, Gillum LA, Smith WS, Brass LM, Lichtman JH, Brown AN, Wang DZ. Utilization of intravenous tissue-type plasminogen activator for ischemic stroke at academic medical centers: the influence of ethnicity. Stroke. 2001; 32:1061–1068.
9. Reed SD, Cramer SC, Blough DK, Meyer K, Jarvik JG, Wang DZ. Treatment with tissue plasminogen activator and inpatient mortality rates for patients with ischemic stroke treated in community hospitals. Stroke. 2001; 32:1832–1840.
10. Rudd AG, Hoffman A, Grant R, Campbell JT, Lowe D. Stroke thrombolysis in England, Wales and Northern Ireland: how much do we do and how much do we need? J Neurol Neurosurg Psychiatry. 2011; 82:14–19.
11. Saver JL, Smith EE, Fonarow GC, Reeves MJ, Zhao X, Olson DM, Schwamm LH. GWTG-Stroke Steering Committee and Investigators. The "golden hour" and acute brain ischemia: presenting features and lytic therapy in >30,000 patients arriving within 60 minutes of stroke onset. Stroke. 2010; 41:1431–1439.
12. Berglund A, Svensson L, Sjostrand C, von Arbin M, von Euler M, Wahlgren N, Engerstrom L, Hojeberg B, Kall TB, Mjornheim S, et al. Higher prehospital priority level of stroke improves thrombolysis frequency and time to stroke unit: the Hyper Acute STroke Alarm (HASTA) study. Stroke. 2012; 43:2666–2670.
13. Kim HJ, Ahn JH, Kim SH, Hong ES. Factors associated with prehospital delay for acute stroke in Ulsan, Korea. J Emerg Med. 2011; 41:59–63.
14. Kim YS, Park SS, Bae HJ, Cho AH, Cho YJ, Han MK, Heo JH, Kang K, Kim DE, Kim HY, et al. Stroke awareness decreases prehospital delay after acute ischemic stroke in Korea. BMC Neurol. 2011; 11:2.
15. Sun CH, Nogueira RG, Glenn BA, Connelly K, Zimmermann S, Anda K, Camp D, Frankel MR, Belagaje SR, Anderson AM, et al. "Picture to puncture": a novel time metric to enhance outcomes in patients transferred for endovascular reperfusion in acute ischemic stroke. Circulation. 2013; 127:1139–1148.
16. Ahn KO, Shin SD, Suh GJ, Cha WC, Song KJ, Kim SJ, Lee EJ, Ong ME. Epidemiology and outcomes from non-traumatic out-of-hospital cardiac arrest in Korea: A nationwide observational study. Resuscitation. 2010; 81:974–981.
17. Ministry of Public Safety and Security. The standard protocols for 119 emergency medical service providers. accessed on 5 December 2015. Available at http://www.prism.go.kr/homepage/researchCommon/retrieveResearchDetailPopup.do?research_id=1660000-201200020.
18. Morris DL, Rosamond W, Madden K, Schultz C, Hamilton S. Prehospital and Emergency Department Delays After Acute Stroke: The Genentech Stroke Presentation Survey. Stroke. 2000; 31:2585–2590.
19. Jauch EC, Saver JL, Adams HP Jr, Bruno A, Connors JJ, Demaerschalk BM, Khatri P, McMullan PW Jr, Qureshi AI, Rosenfield K, et al. American Heart Association Stroke C, Council on Cardiovascular N, Council on Peripheral Vascular D, Council on Clinical C. Guidelines for the early management of patients with acute ischemic stroke: a guideline for healthcare professionals from the American Heart Association/American Stroke Association. Stroke. 2013; 44:870–947.
20. George MG, Tong X, McGruder H, Yoon P, Rosamond W, Winquist A, Hinchey J, Wall HK, Pandey DK. Centers for Disease C, Prevention. Paul Coverdell National Acute Stroke Registry Surveillance - four states, 2005-2007. MMWR Surveill Summ. 2009; 58:1–23.
21. Kwan J, Hand P, Sandercock P. A systematic review of barriers to delivery of thrombolysis for acute stroke. Age Ageing. 2004; 33:116–121.
22. Harraf F, Sharma AK, Brown MM, Lees KR, Vass RI, Kalra L. A multicentre observational study of presentation and early assessment of acute stroke. BMJ. 2002; 325:17.
23. Lacy CR, Suh DC, Bueno M, Kostis JB. Delay in presentation and evaluation for acute stroke: Stroke Time Registry for Outcomes Knowledge and Epidemiology (S.T.R.O.K.E.). Stroke. 2001; 32:63–69.
24. Wein TH, Staub L, Felberg R, Hickenbottom SL, Chan W, Grotta JC, Demchuk AM, Groff J, Bartholomew LK, Morgenstern LB. Activation of emergency medical services for acute stroke in a nonurban population: the T.L.L. Temple Foundation Stroke Project. Stroke. 2000; 31:1925–1928.
25. Kim YS, Park SS, Bae HJ, Heo JH, Kwon SU, Lee BC, Lee SH, Oh CW, Yoon BW. Public awareness of stroke in Korea: a population-based national survey. Stroke. 2012; 43:1146–1149.
26. Prabhakaran S, Ward E, John S, Lopes DK, Chen M, Temes RE, Mohammad Y, Lee VH, Bleck TP. Transfer delay is a major factor limiting the use of intra-arterial treatment in acute ischemic stroke. Stroke. 2011; 42:1626–1630.
27. Kidwell CS, Starkman S, Eckstein M, Weems K, Saver JL. Identifying stroke in the field. Prospective validation of the Los Angeles prehospital stroke screen (LAPSS). Stroke. 2000; 31:71–76.
28. Brandler ES, Sharma M, Sinert RH, Levine SR. Prehospital stroke scales in urban environments: a systematic review. Neurology. 2014; 82:2241–2249.
29. Studnek JR, Asimos A, Dodds J, Swanson D. Assessing the validity of the Cincinnati prehospital stroke scale and the medic prehospital assessment for code stroke in an urban emergency medical services agency. Prehosp Emerg Care. 2013; 17:348–353.
30. Ahn KO, Shin SD, Park CB, Song KJ, Hong KJ, Lee SC, Moon S, Cha WC. Validation of pre-hospital stroke screens by ambulance service personnel: A prospective observation study. J Korean Soc Emerg Med. 2013; 24:272–278.
31. Nedeltchev K, Arnold M, Brekenfeld C, Isenegger J, Remonda L, Schroth G, Mattle HP. Pre- and in-hospital delays from stroke onset to intra-arterial thrombolysis. Stroke. 2003; 34:1230–1234.
32. Lim CD, Ryoo HW, Hwang YH, Lee MJ, Shin SJ, Ahn JY, Kim JK, Park JB, Seo KS. Urban-rural gap in the prehospital delay of acute stroke patients. J Korean Soc Emerg Med. 2013; 24:664–673.
33. Lee D, Ahn KO, Shin SD, Park HA, Roa YS, Cha WC, Lee SC. Impacts of urbanization on delay in transferred ischemic stroke patients. J Korean Soc Emerg Med. 2014; 25:392–400.
34. Schroeder EB, Rosamond WD, Morris DL, Evenson KR, Hinn AR. Determinants of use of emergency medical services in a population with stroke symptoms: the Second Delay in Accessing Stroke Healthcare (DASH II) Study. Stroke. 2000; 31:2591–2596.
35. Rosamond WD, Gorton RA, Hinn AR, Hohenhaus SM, Morris DL. Rapid response to stroke symptoms: the Delay in Accessing Stroke Healthcare (DASH) study. Acad Emerg Med. 1998; 5:45–51.
36. Jin H, Zhu S, Wei JW, Wang J, Liu M, Wu Y, Wong LK, Cheng Y, Xu E, Yang Q, et al. Factors associated with prehospital delays in the presentation of acute stroke in urban China. Stroke. 2012; 43:362–370.
37. Jorgensen HS, Nakayama H, Reith J, Raaschou HO, Olsen TS. Factors delaying hospital admission in acute stroke: the Copenhagen Stroke Study. Neurology. 1996; 47:383–387.
TOOLS
ORCID iDs

Hang A Park
https://orcid.org/http://orcid.org/0000-0002-8714-0828

Ki Ok Ahn
https://orcid.org/http://orcid.org/0000-0002-8446-3269

Sang Do Shin
https://orcid.org/http://orcid.org/0000-0003-4953-2916

Won Chul Cha
https://orcid.org/http://orcid.org/0000-0002-2778-2992

Young Sun Ro
https://orcid.org/http://orcid.org/0000-0003-3634-9573

Similar articles