

 PDF
PDF ePub
ePub Citation
 Print
Print


INTRODUCTION
Intermittent hemodialysis influences cerebral hemodynamics through several mechanisms in patients with end-stage renal disease (ESRD). Ultrafiltration, defined as the elimination of intravascular fluid during hemodialysis, leads to hemoconcentration and a consequent rise in blood viscosity and hematocrit (12). Intradialytic hypotension, which is caused by volume reduction, is a well-known factor that decreases cerebral perfusion pressure during hemodialysis (34). These mechanisms ultimately affect cerebral blood flow (CBF), which can result in a cerebrovascular event (5). Alterations in cerebral oxygenation and endothelial activation in hemodialysis patients have also been suggested as alternative mechanisms influencing hemodynamic changes (6).
Transcranial Doppler (TCD) is a simple, noninvasive, bedside test that provides information on changes in intracranial blood flow and has been used to evaluate hemodynamic changes in hemodialysis patients (678910). However, reliable use of TCD in hemodialysis patients is limited by inadequacy of the temporal window, examiner inexperience, and inaccurate measurement of flow velocity. Additionally, flow volume cannot be measured by TCD.
In contrast to TCD, carotid duplex sonography (CDU) provides more detailed information regarding the anatomy of vessels and flow hemodynamics, including flow velocity and flow volume. To date, the use of CDU during hemodialysis has not been well studied. Additionally, the effects of the location of the arteriovenous (AV) access and the flow volume via the access during hemodialysis on cerebral hemodynamics have yet to be comprehensively evaluated. Only a few case reports have described vertebral blood flow steal caused by high flow through the AV access (1112). Therefore, the first aim of our study was to evaluate hemodynamic changes in extracranial blood vessels, which directly connect with intracranial cerebral vessels, during hemodialysis using CDU measurements of flow velocity and volume. The second aim was to evaluate the relationship between the measured changes in these hemodynamic variables and hemodialysis-specific parameters, including the location of and flow through the AV access and changes in systemic blood pressure during hemodialysis.
MATERIALS AND METHODS
Participants
Participants were prospectively recruited into the study from among ESRD patients attending the artificial kidney unit at Chungnam National University Hospital between October 2013 and March 2014. Prospective patients were screened on the following inclusion criteria: age over 18 years, hemodialysis via AV access for more than 3 months, use of a radiocephalic or brachiocephalic AV access, stable vital signs, willing to undergo repeated CDU measurements before and after hemodialysis, and competency to provide consent. Based on these inclusion criteria, patients on emergent hemodialysis or with unstable vital signs, severe heart failure, or valvular heart disease were excluded. Patients with an AV access malfunction due to infection, thrombus formation, stenosis, or hematoma were also excluded.
Clinical data
Baseline characteristics of the patients were collected by review of the medical records. Descriptive data collected included cardiovascular risk factors, such as diabetes, hypertension, smoking, previous history of stroke or coronary heart disease, and the duration of hemodialysis via the AV access. Systolic and diastolic blood pressure (BP) values were obtained before and during hemodialysis. Patients were asked to report dizziness before and during hemodialysis, with the severity of dizziness graded between ‘0' and ‘10' using the verbal analogue scale (13).
CDU evaluation
Hemodynamic evaluations were performed using a CDU with a standard 7 MHz linear transducer (ACUSON X300™, Siemens, Erlangen, Germany). CDU evaluations were completed at two time points for each patient, just before the start of hemodialysis and at 1 hour into the treatment, to minimize influence of systemic hypovolemia and hypotension, which usually occurred during the last half of the hemodialysis session. At each time point, the bilateral peak systolic velocities (PSV) and blood flow volumes (FV) were measured for the common carotid arteries (CCA) and vertebral arteries (VA). At the CCA, hemodynamic variables were measured at a segment located 2 cm proximal to the bifurcation of the CCA; at the VA, variables were measured at the arterial segment between the transverse processes of the 4th and 5th cervical vertebrae in the sagittal plane (14). The diameter of the vessels at each location was measured at each evaluation. CBF volume was automatically calculated, using diameter and FV values measured on the same side as the AV access, with the following formula: Q = (Tmax/2)*area, where area= (d/2)2*π (15). Total CBF was calculated as the sum of the bilateral FVs in the CCAs and VAs.
FV through the AV access was measured during hemodialysis using AV access flow surveillance and the ultrasound dilution method (HD03 Hemodialysis Monitor®). FV was measured during the first 1.5 hours of hemodialysis, as per the guidelines of the Kidney Disease Outcomes Quality Initiative (16).
Statistical analysis
Differences in hemodynamic variables (BP, PSV, and FV) at the two time points (before and during hemodialysis) were measured separately for each site (CCA and VA) and evaluated relative to the side of the AV access. Differences in the calculated total FV were also evaluated at the two time points. Paired sample t-tests were used to determine the level of significance of the changes in systemic BP, PSV, and FV for each artery, as well as the total FV, before and during hemodialysis. Independent t-tests were used to compare the change (ΔHD-baseline) in PSV and FV for the AV access side and the opposite side.
The influence of access flow on cerebral hemodynamics was evaluated by correlation analysis of the combined hemodynamic variables measured at the vessels and flow via the AV access. Hemodynamic variables were also analyzed according to the presence of dizziness during hemodialysis. Our final analysis focused on identification of factors influencing hemodynamic variables. Values of change in total CBF (Δ total CBF) were rank ordered, and participants in the highest and lowest quartiles were selected. Group differences were evaluated using the Mann-Whitney U test or Fisher's exact test, as appropriate, for the following variables: age, presence of vascular risk factors, change in systolic blood pressure during hemodialysis, location and duration of AV access, and flow via the AV access during hemodialysis. Multiple logistic regression analysis was used to search for independent variables. Statistical analyses were performed using SPSS (v19.0; IBM, Chicago, IL, USA). The level of significance was set at P < 0.05.
RESULTS
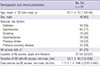
Of the 158 patients undergoing hemodialysis in our artificial kidney unit during the study period, 62 hospitalized patients and 7 patients who had begun treatment less than 3 months ago were excluded. Of the remaining 89 patients who agreed to participate in our study, the data from 8 patients were excluded from the analysis due to poor VA insonation (n = 4) and insufficient AV access for hemodialysis (n = 4). Relevant characteristics of the patients forming our study group are listed in Table 1. Our study group consisted of 81 patients, including 49 men with a mean ± SD age of 61.1 ± 10.7 years. Of these, 45 patients had diabetes (56%), 62 hypertension (77%), 18 a history of stroke (22%), and 29 a history of coronary heart disease (77%). AV access was located in the left arm for 75% of patients and forearm for 67%. The mean duration of hemodialysis with AV access was 52.1 ± 40.2 months (range, 3-226 months). The mean flow via the AV access during hemodialysis was 1,111.1 ± 598.3 mL/min (range, 230–3,340 mL/min).
Table 1
Clinical characteristics of included participants
![]()
Hemodynamic changes during hemodialysis
The changes in hemodynamic variables, measured at the bilateral CCAs and VAs, are reported in Table 2. Systolic BP was significantly decreased during hemodialysis from 146.2 ± 21.9 before hemodialysis to 136.1 ± 24.6 during (P < 0.001). Similarly, the PSV and FV in the CCA were significantly decreased during hemodialysis on both the AV access side and the opposite side: PSV, same side, 71.2 ± 19.4 (before) vs. 64.4 ± 20.0 (during), P < 0.001; PSV, opposite side, 64.5 ± 21.7 (before) vs. 61.5 ± 21.5 (during), P = 0.041; FV, same side, 527.9 ± 183.2 (before) vs. 431.7 ± 158.8 (during), P < 0.001; FV, opposite side; 465.9 ± 167.5 (before) vs. 412.6 ± 138.5 (during), P < 0.001.
Table 2
Systemic and extracranial hemodynamic changes measured before and during hemodialysis
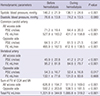
Values are mean ± standard deviation.
AVF, arteriovenous fistula; PSV, peak systolic velocity; FV, flow volume.
![]()
The PSVs in the VAs were also significantly decreased during hemodialysis on both sides: same side, 45.9 ± 22.8 (before) vs. 41.2 ± 21.2 (during), P < 0.001; opposite side, 54.3 ± 16.7 (before) vs. 52.4 ± 16.8 (during), P = 0.017. In contrast, FVs in the VAs were decreased only on the AV access side during hemodialysis: 95.2 ± 81.8 (before) vs. 84.6 ± 79.7 (during), P < 0.001.
The sum of the FVs in the CCAs and the VAs was also decreased during hemodialysis on both sides: same side, 626.8 ± 194.7 (before) vs. 511.0 ± 169.0 (during), P < 0.001; opposite side (before), 592.2 ± 203.8 vs. 538.5 ± 181.5 (during), P < 0.001. Additionally, the total CBF was significantly decreased during hemodialysis: 1,221.9 ± 344.9 (before) vs. 1,085.8 ± 319.2 (during), P < 0.001.
Comparison of hemodynamic variables according to the AV access side
Between-side comparisons of changes in hemodynamic variables, measured before and during hemodialysis, are reported in Table 3. For all variables, the magnitude of change was significantly larger on the AV access side compared to the opposite side. In the CCAs, the PSV on the AV access side was -6.7 ± 10.2 compared to -3.0 ± 12.9 on the opposite side (P = 0.012). Similarly in the VAs, between-side PSV values were -4.2 ± 6.7 and -1.7 ± 6.7 for the AV access and opposite side, respectively (P = 0.009). For FVs, changes of -94.3 ± 109.7 and -52.6 ± 119.1 were measured on the AV access and opposite sides, respectively, in the CCA (P = 0.007) and changes of -11.9 ± 23.1 and -1.3 ± 23.1, respectively, in the VA (P = 0.002). Similar between-side effects were identified for the sum of the FVs in the CCAs and the VAs, with Δ HD-baseline values of -105.7 ± -115.5 on the AV side compared to -53.7 ± 123.5 on the opposite side (P = 0.001). The magnitude of change in the FV expressed as a function of the flow via the AV access is shown for the CCAs and the VAs in Fig. 1A and 1B, respectively. FV decreased during hemodialysis at all flow volumes via the AV access, with the magnitude of change showing a tendency to increase as the access flow volume increased, both in the CCA (r = -0.277, r
2 = 0.077; P = 0.015; Fig. 1A) and the VA (r = -0.239, r
2= 0.057; P = 0.034; Fig. 1B).
Table 3
Side-to-side comparison of extracranial hemodynamic variables, measured before and during hemodialysis

Values are mean ± standard deviation; Δ means change of variable during hemodialysis to compare with before hemodialysis.
HD, hemodialysis; AVF, arteriovenous fistula; PSV, peak systolic velocity; FV, flow volume.
![]()
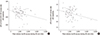 | Fig. 1Correlation between flow volume (FV) on the arteriovenous (AV) access side and the access flow during hemodialysis. (A) The change in combined FV in the common carotid arteries (CCAs) and vertebral arteries (VAs) on AV access side tends to increase as the amount of AV access flow increases (r = -0.277, r
2 = 0.077; P = 0.015). (B) The change in FV in the VAs on the AV access side also tended to increase as the amount of AV access flow increased (r = -0.239, r
2 = 0.057; P = 0.034).
|
Hemodynamic change and dizziness
During hemodialysis, 14 patients complained of either an acute onset of dizziness or an aggravation of pre-existing dizziness. Two patients who could not respond to the dizziness questionnaire were excluded in this analysis. Age, sex, vascular risk factors, AV access side and location, and duration of hemodialysis with AV access were not significantly different between patients with dizziness (n = 14) and patients without dizziness (n = 65). As well, changes in systolic and diastolic BP during hemodialysis were not different between the groups. However, flow via the AV access was higher in patients with dizziness compared to those without, with flow volumes of 1,466.2 ± 862.3 and 1,040.8 ± 494.4, respectively (P = 0.055). There was also a significantly greater decrease in total CBF during hemodialysis in patients with dizziness compared to those without, with changes of -202.4 ± 164.0 and -122.2 ± 217.7, respectively (P = 0.071); these results are shown in Supplementary Table 1.
Influencing factors of hemodynamic change before and during hemodialysis
Patients in the highest quartile of Δ Total CBF were younger than patients in the lowest quartile, with age of 58.1 ± 12.4 and 64.9 ± 7.8, respectively (P = 0.012, Table 4). Interestingly, in terms of vascular risk factors, the prevalence of diabetes was higher in the group of patients in the lowest quartile, with a rate of 70% compared to 35% for patients in the highest quartile (P = 0.028, Table 4). However, the groups did not differ in terms of prevalence of hypertension and smoking; there were also no between-group differences in AV access-related factors (location of AV access, type of AV access, and duration of dialysis with AV access). However, intradialytic hypotension was more frequently observed in highest quartile group (P = 0.095), and the flow volume via the AV access was larger in patients with a larger decrease in total CBF, with flow values of 1,252.2 ± 673.9 and 909.0 ± 434.0 for patients in the highest and lowest quartiles, respectively (P = 0.048, Table 4). Multiple logistic regression analysis indicated that older age (odds ratio [OR] 1.186, 95% confidence interval (CI) 1.016-1.384; P = 0.031) and the presence of diabetes (OR 0.007, 95% CI 0.000-0.305; P = 0.010) predicted a lower probability of hemodynamic changes. The occurrence of IDH was also independently related to the change in CBF (OR 22.684, 95% CI 1.035-495.0; P = 0.047) (Table 4).
Table 4
Factors related to change in total cerebral blood flow (Δ Total CBF) during hemodialysis

Δ means change in blood pressure, which was checked during hemodialysis to compare with before hemodialysis.
![]()
DISCUSSION
In this study, we used CDU to quantify changes in the hemodynamics of extracranial vessels, namely the CCAs and the VAs. We provided evidence for a significant decrease in hemodynamic variables of the bilateral CCAs and VAs, as well as the total CBF, during hemodialysis. This decrease in total CBF can result from a number of factors, including a decrease in intravascular volume by ultrafiltration, hemoconcentration, and intradialytic hypotension (1234). A number of studies have evaluated changes in cerebral hemodynamics during dialysis in patients with ESRD. Using TCD, these studies reported lower baseline CBF in patients with ESRD compared to healthy controls, with a further decrease in CBF after hemodialysis (678910).
While TCD is useful as a bedside assessment of hemodynamics, the temporal window is typically not sufficient for real-time evaluation of the dynamics of CBF, specifically in older Asian women. In addition, FV is not a measured hemodynamic variable in routine TCD evaluations. In contrast, FV is readily measured with CDU. Using CDU, we demonstrated a significant decrease in PSVs and FVs in the bilateral CCAs and VAs, as well as the total CBF, during hemodialysis. Therefore, while our findings of a general decrease in hemodynamic variables during hemodialysis is comparable to findings from previous studies, use of the CDU allowed us to estimate the total CBF by measuring the FV in the arteries of the neck.
In the present study, the PSV and FV of the CCAs and VAs were more decreased in the vessels located on the same side as the AV access than the opposite side. This effect of AV access on the FV in ipsilateral vessels was explained by the flow volume via the AV access (Fig. 1). To date, the effects of flow volume via the AV access on cerebral hemodynamics have not been evaluated in prospective studies of hemodialysis patients. Two case reports have described a relationship between high flow through the AV access in the arm and reversal of flow in the ipsilateral VA in a patient who presented with ataxia and vertigo associated with hemodialysis; the flow through the AV access, and the clinical symptoms, were corrected by surgical reduction of the AV fistula (1112). The reversal of flow in the VA, and the associated clinical symptoms, can be explained by a subclavian artery steal syndrome from the VA due to high flow via the AV access.
Dizziness is an unpleasant side effect of hemodialysis. In our study group, dizziness was predicted by younger age, higher flow volume via the AV access and a greater magnitude of decrease in the total CBF volume during hemodialysis. Due to the relatively low number of patients with dizziness (i.e., 18%), the predictive value of these factors could not be evaluated. As dizziness was prevalent in patients with higher flow volumes via their AV access, we propose that high flow volume causes a vertebral-to-subclavian artery steal syndrome, which lowers CBF sufficiently to induce clinical symptoms of vertebrobasilar artery insufficiency.
The effect of decreased CBF during hemodialysis on clinical outcomes has not been well studied. According to the previous research of Hata et al. (8), there was a significant decrease in the mean flow velocity of the basal cerebral arteries after hemodialysis, and there was an inverse correlation between the % mean flow velocity and both the weight loss and the increase in hematocrit produced by hemodialysis. One explanation is that the reduced circulating volume during hemodialysis causes a resultant increase in the hematocrit and oxygen delivery capacity, leading to a decrease in MFV and a reduction in CBF. Moreover, hemodialysis can be a harmful procedure because of a high prevalence of cardiovascular disease in patients receiving regular hemodialysis. In this study, we suggest that the decrease in CBF during hemodialysis is one of the possible causes of dizziness in patients on regular hemodialysis. A more precisely designed, prospective long-term follow-up study is needed to evaluate the correlation between hemodynamic changes and cardiovascular outcomes.
Age, presence of diabetes, and occurrence of intradialysis hypotension were highly related to the change in total CBF during hemodialysis. Interestingly, greater effects from hemodialysis were observed in younger and non-diabetic patients. This unexpected result can partially be explained by cerebral vascular reactivity (VR). Although the influence of age on cerebral VR remains controversial, cerebral VR has been shown to decline with increasing age (17). Impairment in VR due to the partial pressure of CO2 and changes in BP have been reported in elderly patients and patients with diabetes (181920).
To explain the unusual finding that △CBF was lower in patients with both diabetes mellitus (DM) and ESRD, we also considered some possible biases. Among the factors, age was significantly lower in non-diabetic patients (DM, 63.5 ± 7.6 vs. non-DM, 58.0 ± 13.6; P = 0.028). Additionally, the flow volume via AV access was significantly higher in non-diabetic patients (DM, 1,325.6 ± 607.8 vs. non-DM, 939.6 ± 537.9 mL/min; P = 0.003). Other AV access related factors and the occurrence of IDH were not associated with the presence of DM. Interestingly, age negatively influenced the relationship of DM and △CBF; thus, both factors affect independently of the change in CBF. Larger FVs via AV access during HD in non-diabetic patients possibly contributed to the significant decrease in CBF, which was greater in non-diabetic patients than in DM patients, as well as the decreased vasoreactivity in diabetic patients.
Intradialytic hypotension has been known to be the main cause of hemodynamic instability during hemodialysis (34). Because IDH is more frequently observed in the latter stages of the hemodialysis sessions (21), we conducted our hemodynamic evaluations and BP measurements just 1 hour after the start of hemodialysis to minimize influences of systemic hypotension on measured hemodynamic variables. However, in the present study, between the extreme 2 groups, the highest quartile group and lowest quartile group of Δ Total CBF, CBF was related to the systemic BP change at 1 hour after dialysis initiation; thus, IDH caused by decreased vascular volume can cause decreased cerebral blood flow, even in an early stage of hemodialysis.
Limitations of our study need to be acknowledged in the evaluation of our outcomes. We used CCA volume, rather than internal carotid artery (ICA) volume, to calculate total CBF. Strictly, ICA volume would provide a more specific calculation of total CBF. However, to avoid inaccurate measurement of FV due to stenosis of the proximal ICA, which is frequently observed in ESRD patients, we selected to obtain our measures from the CCA. Additionally, we did not consider blood viscosity, blood gas, or other influencing metabolic factors. More comprehensive studies designed to evaluate the relationship between changes in hemodynamic variables and metabolic and hemodynamic factors are needed.
In summary, the extracranial blood flow decreased during the hemodialysis session, and the decrease was larger in vessels on the same side as the AV access. The main factors influencing the change in CBF were age, presence of diabetes, and decrease in systemic blood pressure. Outcomes of our study provide insight into the hemodynamic changes in extracranial vessels that are closely related to changes in intracranial cerebral blood flow with hemodialysis.
 XML Download