

 PDF
PDF ePub
ePub Citation
 Print
Print


INTRODUCTION
Hepatocellular carcinoma (HCC) is one of the most common malignancies worldwide and is globally the third leading cause of cancer-related deaths (12). The 5-year survival rate for patients suffering from HCC is only 7%, and few patients with symptomatic disease survive for > 1 year (3). Since traditional curative therapies, such as surgical resection, transplantation, or percutaneous ablation are only eligible for a minority of patients (4), our improving knowledge of hepatic carcinogenesis and the signaling pathways that control tumor growth and metastasis has led to the identification of several potential therapeutic targets. Numerous signaling pathways, such as extracellular signal regulated kinase/mitogen-activated protein kinase (ERK/MAPK), vascular endothelial growth factor receptor/endothelial growth factor receptor (VEGFR/EGFR), Wingless type (Wnt)/β-catenin, and PI3K/AKT/mTOR, have been suggested to be the potential targets (56). One example is the development of Sorafenib which is a tyrosine kinase inhibitor (TKI) that inhibits VEGFR, platelet-derived growth factor receptor (PDGFR), B-Raf, Fms-related tyrosine kinase (FLT), and c-kit (78). Results from large-scale phase III clinical trials have made Sorafenib the only approved molecular targeted drugs for HCC treatments. Thus, establishment of Sorafenib has driven the development of molecularly targeted therapies and unveiled a new direction for HCC treatments (6).
Orthodenticle homeobox 1 (OTX1) is one of the OTX family (OTX1, OTX2, OTX3, and CRX) that belongs to the homeobox (HB) gene. The OTX1 gene encodes transcription factors that have high-affinity binding to TAATCC/T elements on target genes (9), which are involved in brain regionalization, corticogenesis, and organ sense development during embryogenesis (10). The OTX1 gene is also fundamentally important in the development of early human fetal retina (11) and mammary gland (12). Recently, discoveries of the deregulated OTX1 gene for postnatal carcinogenesis have implied that expression of OTX1 is not limited to embryonic period, but also during carcinogenesis. It has been reported that OTX1 is overexpressed in a subset of normal germinal-center B Cells and in aggressive non-Hodgkin lymphoma (13). Overexpression of OTX1 was also observed in neural tumors, such as medulloblastomas (14), especially the specific nodular⁄desmoplasmic subtype (15). Further findings of the overexpression and cancer-promotion effects of OTX1 in breast cancer (16) and colorectal cancer (17) have collectively suggested that OTX1 might be widely implicated in the development and progression of human carcinogenesis.
In view of these findings, we sought to determine the expression of OTX1 in human HCC tissues, and explore the functional effects of OTX1 silencing on HCC progression in vitro and in vivo. The possible mechanisms that are involved in OTX1-related hepatic carcinogenesis will also be examined in this study.
MATERIALS AND METHODS
Cell lines and cell culture
Human HCC cell lines Hep G2 and SMMC-7221 were purchased from the Cell Bank of Type Culture Collection of Chinese Academy of Sciences (Shanghai, China). Both cell lines were maintained in Rosewell Park Memorial Institute 1640 (RPMI-1640) medium (Gibco, Grand Island, NY, USA) supplemented with 10% fetal bovine serum (FBS, Gibco). Culture medium was refreshed every two days. Cell culture was maintained in an incubator at 37°C in a humidified atmosphere with 5% CO2.
Reagents
Primary antibodies against OTX1 and β-actin were purchased from Cell Signaling Technology (Boston, MA, USA). Antibodies against MEK, ERK, MAPK, and JNK and the corresponding antibodies against their phosphorylation were purchased from Santa Cruz Biotechnology (Dallas, TX, USA). The cell counting kit-8 (CCK-8) was purchased from Donjindo (Japan). For knockdown of OTX1, its specific shRNA was purchased from Santa Cruz (Dallas, TX, USA). The negative control shRNA (NC) was also used for control.
HCC tissues and immunohistochemistry (IHC) analysis
A total of 128 cases of human HCC and the paired adjacent non-cancerous tissues were collected. The clinicopathological information was provided for research purposes. Samples were paraffin-embedded and sliced. Slides were then subjected to deparaffinization/rehydration, followed by the antigen retrieval in a microwave at 100°C for 10 minutes in 0.1 mol/L citric acid buffer (PH 6.0). Slides were thereafter blocked by 5% skim milk for 1 hour at room temperature, and later incubated with the corresponding primary antibodies at 4°C overnight. After PBS washes, slides were incubated with secondary antibodies at room temperature for 1 hour. Signals for each slide were developed in pre-made 0.05% diaminobenzidine (DAB) containing 0.01% hydrogen peroxidise (H2O2). Slides were mounted for imaging under a light microscopy (Olympus, Japan).
Western blot analysis
Cells were harvested 48 hours after culture. The total protein was extracted and quantified using a BCA kit. An equal amount of 30 ng protein was loaded to each lane in a 12% SDS-PAGE gel. The gel was then transferred to a nitrocellulose (NC) membrane for 1.5 hours under a voltage of 100v. The membrane was preceded to antigen blocking with 5% skim milk for 1 hour, and incubated with primary antibody at 4°C overnight. After the overnight incubation with primary antibody, membrane was washed with TBST, and incubated with secondary antibody for 1 hour at room temperature. The immunoreactivity was detected with enhanced chemoluminescent autoradiography (ECL kit, Amersham, Pittsburgh, PA, USA) according to the manufacturer’s instruction. The β-actin was synchronously detected for loading control.
Quantitative real-time PCR (qRT-PCR)
Total RNA was extracted using Trizol solution (Invitrogen, Shanghai, China) and immediately reversely transcribed into cDNA using the PrimeScript RT Master Mix Perfect Real Time (TaKaRa, Shiga, Japan). The cDNA was then subjected to amplification in an ABI prism-7500 real-time system with the procedure described in a previous report (18). Primer sequences were as follows:
OTX1, forward: 5’-CTGCTCTTCCTCAATCAATGG-3’;
reverse: 5’-ACCCTGACTTGTCTGTTTCC-3’;
GAPDH, forward: 5’-TGCACCACCAACTGCTTAGC-3’;
reverse: 5’- GGCATGGACTGTGGTCATGAG-3’.
GAPDH gene was amplified as an internal control. qPCR products were detected with SYBR Green on BioRad Connet Real-Time PCR platform. Relative quantitation was analyzed by 2-ΔΔCT method.
Cell viability assay
The CCK-8 kit was used to assess cell viability in a consecutive of 5 days. Cells transfected with shOTX1 (shRNA group) or the negative control shRNA (NC group) were seeded in triplicate in a 96-well plate at an initial density of 4 × 10³/well. Cells without any transfection (control group) were also synchronously plated. Cell viability is reflected by cell numbers which depends on the absorbance after addition of 10 μL cck-8 solution into each well. Cells were further incubated for 2 hours after the addition of cck-8 in the incubator at 37˚C. Subsequently, the absorbance value for each well was measured using a synergy 2 multi-mode microplate reader (Bio Tek Instruments, Winooski, VT, USA) at 450 nm. All experiments were repeated at least three times.
Colony formation assay
Hep G2 and SMMC-7221 cells were evenly seeded into 6-well plates, respectively, at an initial density of 1 × 10³ cells/well. Cells were then transfected with specific shOTX1 (shRNA group) or the negative control shRNA (NC group) or without any transfection (control group) with lipofectamine 2000. After 48 hours growth, the supernatant was removed and cells were allowed to growth under normal conditions with the medium refreshed every two days. Ten days later, the cells from each group were allowed to form colonies and were fixed using 4% paraformaldehyde prior to staining with 0.1% crystal violet (Sigma-Aldrich, Shanghai, China). After washing, the plates were air-dried, and stained colonies were photographed using a microscope (Leica, Wetzlar, Germany). Colonies were also counted and quantified.
Cell cycle analysis
After transfecting the cells with shOTX1 or scrambled shRNAs for 48 hours, the cells from each group were detached using trypsin, and re-suspended using the culture medium. Cells were then counted and a total of 1 × 10⁶ cells were fixed with 70% (v/v) ethanol overnight at 4°C. After washing twice with PBS, the cells were then stained with a solution that contained 50 µg/mL of Prodium Iodide (PI) and 100 µg/mL RNase A for 30 minutes in the dark at room temperature. The stained cells were analyzed by flow cytometry (Beckman Coulter, Epics XL, Brea, CA, USA).
Cell migration assay
Briefly, 100 μL of Hep G2 and SMMC-7221 cells (9 × 10⁴ for each) (48 hours post-transfection) in serum-free medium were placed into the upper chambers (8 µm pore size, Millipore) which were later placed into 24-well plates. Medium containing 10% FBS was added to the lower chamber. After incubation at 37°C for 12 hours, cells on the under- surface of the membrane were fixed with 4% paraformaldehyde, followed by 0.1% crystal violet staining for 30 minutes. Five random fields were photographed for each group of cells at 200 × magnification. The migrated cell numbers for each group were then counted and averaged from the five selected images. Each experiment was performed in triplicate.
Mouse xenograft HCC models
Twelve six-week-old female athymic nude mice (BALB/cnu/nu) were purchased from Chinese Academy of Sciences (Shanghai, China). Mice were randomized and equally assigned into the NC group or shRNA group (n = 6 for each group). A total of 1 × 10⁶ Hep G2 cells were subcutaneously injected into the left flank of each mouse. Tumor diameters were periodically measured (twice a week) and tumor volumes (TV) were calculated using the formula TV = L × W2/2 (L denotes the longer dimension, W denotes the smaller dimension). On day 25 after tumor cell injection, one mouse from the shRNA group sacrificed. By day 27, all mice were dislocated to death and the excised tumor tissues were weighed. All efforts were made to minimize suffering.
Statistical analysis
All data were expressed as the means ± standard error (SEM). An independent Student’s t test was used to compare the difference between groups. A P value < 0.05 was considered of statistical significance. All statistical analyses were performed using SPSS 16.0 (SPSS Inc, Chicago, IL, USA).
RESULTS
OTX1 is highly expressed in clinical HCC tissues
To determine the expression level of OTX1 in human HCC tissues, we initially performed qRT-PCR analysis of OTX1 mRNA level in 10 samples from HCC and the paired adjacent tissues. The result showed that the average mRNA level in the tumor tissues were significantly higher than that in the adjacent tissues (P = 0.008). mRNA level of OTX1 in tumors were approximately two-fold increased compared with the non-cancerous tissues (Fig. 1A). The protein level of OTX1 was further assessed by IHC analysis in a subset of 128 cases of HCC tissues and the paired adjacent tissues. Expression of OTX1 was graded as negative (−), weakly positive (+), moderate positive (++), and strongly positive (+++) by experienced pathologists according to the stain density. Representative images showing the staining results of OTX1 in distinct tissues were presented in Fig. 1B. Our results showed that the protein level of OTX1 was markedly higher in the tumor tissues than the non-cancerous tissues (Fig. 1B). While OTX1 was barely expressed in the normal tissues, it was intensely stained and showed to be mainly located in the membrane and cytoplasm (Fig. 1B). These results suggest that OTX1 is overexpressed in the HCC tissues at both mRNA and protein levels.
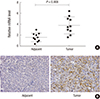 | Fig. 1OTX1 is highly expressed in clinical HCC tissues. (A) qRT-PCR analysis showed that the average mRNA level of OTX1 in the tumor tissues were approximately two-fold increased compared with the paired non-cancerous tissues (P = 0.008). (B) Protein level of OTX1 was analyzed by IHC in a subset of 128 HCC tissues and the paired adjacent non-cancerous tissues. Staining result for each slide was graded as negative (−), weakly positive (+), moderate positive (++), and strongly positive (+++) according to the stain density. OTX1 was shown to be mainly located in the membrane and cytoplasm. The representative images that showed the markedly higher level of OTX1 in tumor tissues than non-cancerous tissues were provided. Magnification 400 ×.
|
Expression of OTX1 is positively correlated with metastasis status and TNM staging
To determine whether expression of OTX1 was associated with the clinicopathological variables, we carried out Spearman correlation analysis to determine the association between OTX1 expression and the common clinicopathological parameters in the 128 cases of HCC tissues (Table 1). Statistics revealed that expression of OTX1 were not significantly different in tumor and non-cancerous tissues with respect to the onset age (P = 0.070), gender (P = 0.856), tumor size (P = 0.642), and tumor differentiation (P = 0.613). However, expression of OTX1 was observed to be positively correlated with the nodal metastasis (P = 0.009, Χ
2 =6.79) and TNM staging (P = 0.010, Χ
2 = 6.59). These data indicate that expression of OTX1 in HCC may be associated with HCC progression, particularly with metastasis status and TNM staging.
Table 1
Correlation between the expression of OTX1 and clinicopathological variables in hepatocellular carcinoma (n = 128)
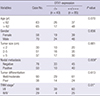
*P < 0.05; †TNM staging is a classification of malignant tumor in which T describes the size of primary tumor, N describes nearby lymph nodes that are involved, and M describes distant metastasis.
![]()
Knockdown of OTX1 inhibits cell proliferation and colony formation in vitro
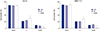
In light of the results above, we further investigated whether OTX1 played any functional role in HCC progression. To this end, we adopted shRNA against OTX1 (shOTX1) to knock down the expression of OTX1 in HCC cell lines Hep G2 and SMMC-7221. Effects of OTX1 knockdown on cell viability and colony formation were then assessed. Initially, the knockdown efficiency of shRNA was assessed (Fig. 2). mRNA level of OTX1 in Hep G2 cells was approximately 80% ablated (Fig. 2A), while approximately 70% of mRNA level of OTX1 were ablated in SMMC-7221 cells (Fig. 2B). Consistently, the protein level of OTX1 was significantly decreased in response to shOTX1 transfection irrespective of Hep G2 cells or SMMC-7221 cells (Fig. 2C). Transfection of negative control shRNA, as expected, caused no effect to OTX1 expression in both two cell lines (Fig. 2A-2C). These results suggest that our synthesized shRNA against OTX1 works efficiently to target OTX1 in vitro. Next, we monitored cell viability of both shOTX1-transfected Hep G2 cells and SMMC-7221 cells in a consecutive of 5 days. It was observed that Hep G2 cells began to exhibit a slower proliferation rate since day 3. By day 5, the total cell numbers in shOTX1-transfected Hep G2 cells were only half of that in the control cells (Fig. 3A). Comparable results were also observed in the SMMC-7221 cells (Fig. 3B). Colony formation ability was also impaired after knockdown of shOTX1. Transfection of shOTX1 with Hep G2 cells and SMMC-7221 cells caused visually significantly fewer colonies in the plates (Fig. 4A). Quantification data showed that only average 30 colonies were formed in shOTX1-transfected Hep G2 cells (15% of the controls), and about 50 colonies were formed in shOTX1-transfected SMMC-7221 cells, accounting for only 19% of the controls (Fig. 4B). Combined, these data suggest that knockdown of OTX1 strongly impaired cell growth ability in both Hep G2 cells and in SMMC-7221 cells.
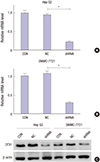 | Fig. 2Knockdown efficiency of OTX1 shRNA was assessed in vitro. Initially, effects of transfection of the shRNA against OTX1 (shOTX1) on mRNA level of OTX1 were assessed in Hep G2 cells (A) and SMMC-7221 cells (B). shOTX1, instead of the scrambled shRNA significantly knocked the mRNA level of OTX1 down in both cell lines. The protein level of OTX1 was accordingly decreased after transfection of shOTX1 in both cell lines (C). *
P < 0.01.
|
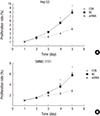 | Fig. 3Effects of OTX1 knockdown on cell viability. Knockdown of OTX1 by shRNA caused significantly lower proliferation rate in both Hep G2 cells (A) and SMMC-7221 cells (B). The proliferation rate was approximately half of the control cells by day 5. *
P < 0.01.
|
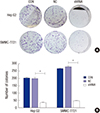 | Fig. 4Knockdown of OTX1 impairs the colony formation ability in vitro. (A) Fewer colonies were visually observed in shOTX1-transfected Hep G2 cells and SMMC-7221 cells. (B) Quantification of the colony numbers showed that only average 30 colonies were formed in shOTX1-transfected Hep G2 cells (15% of the controls). About 50 colonies were formed in shOTX1-transfected SMMC-7221 cells, accounting for only 19% of the controls. *
P < 0.01.
|
Knockdown of OTX1 induces cell cycle arrest in S phase
To explain the cell growth retardation by shOTX1, the flow cytometry was employed to analyze the cell cycle distribution. As shown in Fig. 5, the cell proportion in G0/G1 phase was similar among the three groups. However, cell proportion in S phase was significantly higher, whereas the proportion in G2/M phase was lower in both shOTX1-transfected Hep G2 cells and SMMC-7221 cells. In shOTX1-transfected Hep G2 cells, the cell percentage in S phase was approximately 28% relative to 21% for control cells. Accordingly, the cell percentage in G2/M phase was less than 2% relative to approximately 8% for control cells. This was also basically true in SMMC-7221 cells. It could be concluded that the cell growth retardation by shOTX1 was due to cell cycle arrest in S phase in both Hep G2 cells and SMMC-7221 cells.
 | Fig. 5Knockdown of OTX1 induces cell cycle arrest in S phase. Flow cytometry was employed to analyze the cell cycle distribution. Cell proportion in S phase was significantly increased, whereas cell proportion in G2/M phase was significantly decreased in shOTX1-transfected Hep G2 cells and SMMC-7221 cells. *
P < 0.01.
|
Knockdown of OTX1 inhibits tumor growth in a xenograft mouse model
To assess the effects of OTX1 knockdown on hepatic tumor growth in vivo, Hep G2 cells that were transfected with shOTX1 in advance (shRNA group) were used to be subcutaneously injected to the left flank of each mouse. Negative control shRNA-transfected Hep G2 cells were synchronously injected as control (NC group). Tumor nodules were visible 8 days after injection and tumor dimensions were periodically monitored in both groups since then. Basically, tumor volumes in shRNA group were smaller than the control group, and were only 25% of it by day 27 when all mice from two groups were sacrificed (Fig. 6A). Tumor from each mouse was dissected (Fig. 6B) and weighed. The average weight of tumors from shRNA group was approximately 0.25 grams, whereas it was approximately 0.75 in the control group (Fig. 6C). Conclusively, the smaller volume in size and less weight in mass strongly suggest that knockdown of OTX1 in Hep G2 cells impaired the tumorigenic ability in vivo.
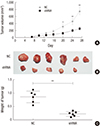 | Fig. 6Knockdown of OTX1 inhibits tumor growth in a xenograft mouse model. A mouse model bearing the hepatic cancer was initially established using shOTX1-transfected Hep G2 cells (shRNA group) or negative control shRNA-transfected Hep G2 cells (NC group). (A) Periodic monitor of tumor dimensions in both the NC group and shRNA group. Average tumor volume from shRNA group was only 25% of control group by day 27. (B) Tumors were dissected and presented on day 27. (C) All tumor weights were determined and averaged for each group. The average tumor weight from the shRNA group was approximately 33% of the control group. *
P < 0.05, †
P < 0.01.
|
Knockdown of OTX1 inhibits cell migration ability in vitro
Table 1 indicated that expression of OTX1 was positively correlated with nodal metastasis. Hence, we further examined the role of OTX1 in HCC cell migration. Both Hep G2 and SMMC-7221 cells were transfected with the specific shOTX1 (shRNA group) or with scrambled shRNA (NC group). Cells without any transfection were co-cultured. The staining with crystal violet showed that cells migrating to the under-surface of upper chamber were less in shRNA group than the control groups (Fig. 7A). Quantification of the migrated cell numbers further showed that shOTX1-transfected cells exhibited significantly lower migration ability in both cell lines. Migration ability was decreased by shOTX1 by up to 78% after 12 hours culture in both Hep G2 and SMMC-7221 cells (Fig. 7B). These data confirm the relationship between expression of OTX1 and metastasis status, and suggest the critical role of OTX1 in HCC cell migration.
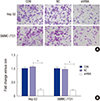 | Fig. 7Knockdown of OTX1 inhibits cell migration ability in vitro. Both Hep G2 cells and SMMC-7221 cells with distinct treatments were allowed to migrate in the upper chamber of a transwell for 12 hours. (A) After 12 hours, the under-surface of the upper chamber was stained with crystal violet. The stained cells were observed and photographed under a light microscopy. (B) Quantification of the migrated cell numbers showed that shOTX1-transfected cells exhibited significantly lower migration ability in both cell lines. Approximately 78% migration ability was decreased after knockdown of OTX1 in both Hep G2 and SMMC-7221 cells. *
P < 0.01.
|
Deregulation of ERK/MAPK pathway is associated with silencing of OTX1
The ERK/MAPK pathway is constitutively expressed in HCC tissues (19), and closely associated with hepatic carcinogenesis and progression (2021). The biological activity of ERK/MAPK pathway is activated by kinases which phosphorylate the cascade signaling. To assess whether the role of OTX1 in HCC was associated with the ERK/MAPK pathway, we detected the key components of ERK/MAPK pathway (ERK, MAPK, JNK and MEK) and their phosphorylation levels. As shown in Fig. 8, phosphorylated MEK, ERK, MAPK, and JNK were consistently decreased after knockdown of OTX1 in both Hep G2 cells and SMMC-7221 cells. Knockdown of OTX1 had no effects on the expression level of total MEK, ERK, MAPK, and JNK. These results indicated that ERK/MAPK pathway was modulated by OTX1 in vitro.
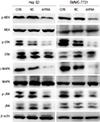 | Fig. 8Deregulation of ERK/MAPK pathway is associated with knockdown of OTX1. Knockdown of OTX1 caused the according decreases of phosphorylated MEK, ERK, MAPK and JNK without affecting the total MEK, ERK MAPK and JNK levels. ERK, extracellular signal regulated kinase. MAPK, mitogen-activated protein kinase. MEK, a MAPK kinase, also known as MAP2K, or dual-specificity mitogen-activated protein kinase kinase. JNK, c-Jun N-terminal kinase.
|
DISCUSSION
Featured by rapid tumor growth, early vascular invasion, and high chemoresistance, HCC claimed approximately 600,000 deaths per year worldwide (22). In clinic, approximately 80% of HCC patients present with an advanced stage that is not amenable to surgical resection or liver transplantation (23). Recently, the multikinase inhibitor Sorafenib has been verified to have clinical benefits in advanced HCC patients due to its potent activity against VEGFR, PDGFR, B-RAF and c-kit et al. Treatment of Sorafenib prolonged the median survival time of HCC patients from 7.9 to 10.7 months in the randomized phase III clinical trial (24). This exiting result makes Sorafenib the only approved molecular targeted drug for HCC treatment and has largely facilitated the identification of novel molecules for the development of molecular targeted therapies.
OTX1belongs to the homeobox (HB) gene and encodes transcription factors that have high-affinity binding to TAATCC⁄T elements on target genes (9). OTX1 was previously only implicated in the embryonic development, including brain regionalization, corticogenesis, organ sense,retina and normal mammary gland development (101125). The recent findings of OTX1 in human carcinogenesis extended its normal function (13151617). OTX1 was considered one of the neuroectodermal markers previously (26), and has only been recently found re-expressed in breast cancer, colorectal cancer and specific type of medulloblastoma, indicating the potential role of OTX1 beyond neuroectodermal activity. In our study, it was observed that OTX1 was highly expressed in HCC tissues. Knockdown of OTX1 in Hep G2 and SMMC-7221 cells significantly caused cell growth retardation and induced cell cycle arrest in S phase. The in vivo tumorgenic ability was also impaired by knockdown of OTX1 in Hep G2 cells. Migration is a characteristic of malignant tumor. The blunted cell migration by knockdown of OTX1 strongly suggested that OTX1 was a critical contributor to HCC development and progression. These observations altogether concluded that OTX1 promoted HCC progression in vitro and in vivo.
HCC has a complicated molecular tumorigenesis in which MAPK pathway may be one of the major pathways (1920). MAPKs, (also known as ERKs), act as an integration point for multiple biochemical signals, and are involved in a wide variety of cellular processes such as proliferation, differentiation, transcription regulation and development (27). The activation of this signaling requires its step-by-step phosphorylation by kinases. The mammalian MAPK family consists of ERK, p38, and c-Jun N-terminal kinase (JNK) with each of these enzymes consisting of at least three layers-an MAPK kinase kinase (also known as MAP3K, serine/threonine-specific protein kinase (RAF), and MEKK), an MAPK kinase (also known as MAP2K, dual-specificity mitogen-activated protein kinase kinase [MEK], and MKK), and an MAPK. The MAPK signaling is primarily involved in cell growth and survival and regulates cell differentiation. This pathway has been widely implicated in the advanced stage HCC (2829). The deregulation of MAPK signaling by silencing OTX1 in the present study would suggest a possible mechanism that OTX1 promotes HCC progression by regulation of MAPK signaling. Supporting evidence was that OTX1 induced cell cycle arrest in S phase and meanwhile modulated the MAPK pathway (Fig. 5 and 8). The close linkage between deregulation of MAPK pathway and cell cycle arrest is well recognized (particularly in S phase) (303132), and would reinforce our hypothesis that the critical role of OTX1 in HCC is accomplished by modulation of the MAPK pathway. However, more work needs to be further done.
Identification of OTX1 as one potent mediator of HCC progression is of biological significance. Development of molecular therapy towards HCC has been progressing relatively slow regarding the approved drug(s). Management of HCC has been always calling for more work beyond Sorafenib(6). Our findings will hopefully provide novel clues for developments of molecular therapeutic strategies towards HCC. On the other hand, OTX1 was mainly implicated in the development (i.e. brain and retina) during embryogenesis. Its behavior has only been extended beyond the neuroectoderm recently. The identification of OTX1 as a mediator of tumor progression may advance our understanding of carcinogenesis.
In all, we studied the expression level and role of OTX1 in HCC. The critical role of OTX1 in HCC progression was examined in vitro and in vivo. In addition, OTX1 contributes to HCC progression possibly by regulation of ERK/MAPK pathway. The identification of OTX1 as a critical mediator of HCC progression may provide evidence for developments of novel molecular therapies towards HCC treatments.
 XML Download