Journal List > J Korean Med Sci > v.30(Suppl 1) > 1022983

Subramanian and Subramanyam: Limits to Economic Growth: Why Direct Investments Are Needed to Address Child Undernutrition in India

Abstract

About two of every five undernourished young children of the world live in India. These high levels of child undernutrition have persisted in India for several years, even in its relatively well-developed states. Moreover, this pattern was observed during a period of rapid economic growth. Evidence from India and other developing countries suggests that economic growth has little to no impact on reducing child undernutrition. We argue that a growth-mediated strategy is unlikely to be effective in tackling child undernutrition unless growth is pro-poor and leads to investment in programs addressing the root causes of this persistent challenge.

India has the dubious distinction of having the highest prevalence of underweight and ranks 7th in stunting prevalence among children below five years (1). According to the 2005-2006 National Family Health Survey (NFHS) of India (2) (no national survey has reported results since then) the prevalence of childhood stunting and underweight was 48% and 42.5%, respectively. India accounts for 38% of the global burden of stunting with more than 61 million children having abnormally low height-for-age (3).
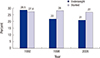
A pertinent characteristic of the levels of child undernutrition in India has been its persistence. While prevalence of underweight among children aged 0 to 35 months decreased from 49% to 40% between 1992 and 2005, the decrease in stunting was only 7 percentage points over the same period (4). This aspect of persistence is particularly borne out when we examine Kerala (Fig. 1), a state that has received considerable appreciation for remarkable accomplishments on social and health indicators (5). While Kerala compares favorably on a number of key population health indicators (Table 1) with the member countries of the Organization for Economic Cooperation and Development (OECD) (which are approximately 11 times richer in terms of per capita gross domestic product [GDP]), it fails considerably on measures of child nutritional status, as captured through anthropometric measures (67). Childhood underweight and stunting are virtually absent in OECD countries, however, about a quarter of children in Kerala are either underweight or stunted. In fact, prevalence of stunting remained unchanged in Kerala between 1992 and 2005, while underweight prevalence dropped by a mere 8 percentage points over that 13-yr period.
The sluggish decline in child undernutrition in India, ironically, was accompanied by a period of bullish and sustained economic growth. India experienced growth rates greater than 7% between 1994 and 1997 and about 8% or greater rate in 2004 and 2005 (8). It is not an exaggeration to state that in countries with low levels of per capita income, such as India, increasing the rate of economic growth is often justified as a key policy instrument to improving population health and nutrition (910).
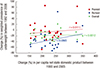
Although increased economic growth could play a role in reducing child undernutrition, unfortunately there is no compelling evidence to support that. On the contrary, in a recent study that comprehensively examined the role of economic growth in explaining even the small decline in child undernutrition in India, the correlation was close to zero (11). The essentially null association between increases in state economic growth and reductions in child undernutrition was, by and large, true across all socioeconomic groups (11) and particularly evident among the poorest wealth group (Fig. 2) (12).
The evidence from India that macroeconomic growth at the state level did not contribute to the (slow) reduction in child undernutrition has also been corroborated at the global level. In an analysis of 121 Demographic and Health Surveys in 36 low- and middle-income countries, the association between macroeconomic growth and reductions in childhood measures of anthropometric failure was zero to quantitatively very weak (1314). This finding was found to be consistent across a wide range of statistical specifications (14).
If policies to address child undernutrition are to be based on "evidence", it is clear that a "growth-mediated" strategy is unlikely to yield desirable results, at least in the short run. Indeed, upon reflection, it is not at all surprising that macroeconomic growth over the last couple of decades has not translated into substantial improvements in children's nutritional status in India. For instance, it is now largely agreed that the benefits of economic growth did not "trickle down" to the poor, let alone the poor being participants of such growth (15). Interestingly, the very widespread use of the phrase "trickle down" implies that even in the best case scenario one can expect only a "trickle" and not a "flood." Thus, even if it were the case that economic growth led to increases in incomes of individuals, and especially those of the poor (where the majority of the burden of child undernutrition exists) (4), this would still impact very few of the proximal risk factors that causally affect undernutrition, such as access to sufficient food and micronutrients. Indeed, in India, where food inflation has been rampant, there is no evidence that income improvements have vastly outstripped the food inflation, especially for the poor (16). In fact, the evidence suggests a decline in calorie consumption in India (17). Importantly, reduction in child undernutrition is dependent on other risk factors that are unlikely to automatically improve as a consequence of increases in household incomes. These include access to clean water and sanitation, as well as to treatments that reduce recurring morbidities and prevention of infection through immunization. Improvements in these conditions are influenced by robust public investments, which often depend more on the policy and political priorities than on the availability of resources. And if not evaluated rigorously these public investments can present an erroneous picture of success. For example, even though India appears to have met the Millenium Development Goal on access to water, a recent analysis found alarmingly high contamination rates of water from the "improved" water sources in India (18). In addition to these proximal risk factors, it is well known that there are social and intergenerational factors that influence child undernutrition, critical ones being paternal and maternal height (19202122).
In conclusion, before advocates of growth-mediated strategy extol the role of macroeconomic growth as a policy instrument to reducing child undernutrition it is critical to first recognize the etiology and mechanistic connections. If economic growth is actually "pro-poor" and the increased public revenue as a consequence of such growth is invested in mitigating the proximal and distal risk factors that matter for child undernutrition, such growth can have an impact on child undernutrition. Sadly, the evidence thus far appears to be the contrary.

Figures and Tables

Fig. 1

Prevalence of childhood underweight and stunting in Kerala for 1992-1993 (<48 months), 1998-1999 (<36 months), and 2005-2006 (<36 months) (from NFHS-1, -2, and -3 respectively).

jkms-30-S131-g001
Fig. 2

Association of state-level economic growth (change in per capita net state domestic product) and change in state-level prevalence of childhood (<36 months) underweight in India for children from the poorest and richest quintile of household wealth as well as all children, during the 1992 to 2005 period. Each point in the scatter plot denotes change in prevalence of underweight for a state in India. The data are stratified by household wealth of the population, with red squares representing children from the poorest households (lowest quintile of wealth), blue rhomboids children from the richest households (top wealth quintile) and the green triangles children from all households. The Y axis depicts percentage change in prevalence per year. It was calculated using the formula: [(prevalence weighted for sampling design in 2005-2006 minus weighted prevalence in 1992) divided by weighted prevalence in 1992] multiplied by 100. The X axis depicts percentage change in per capita net state domestic product (PCNSDP), calculated using the formula: [(PCNSDP in 2005 minus PCNSDP in 1993) divided by PCNSDP in 1993] multiplied by 100. Data for underweight are from NFHS-1, -2, and -3 (http://www.rchiips.org/nfhs/index.shtml). Data for PCNSDP are from the 2008 Handbook of statistics on Indian economy published by the Reserve Bank of India (http://www.rbi.org.in/scripts/AnnualPublications.aspx?head=Handbook%20of%20Statistics%20on%20Indian%20Economy). P values for the correlations of percent change in PCNSDP and percent change in weighted prevalence are P=0.6 (poorest), 0.2 (richest), and 0.9 (overall).

jkms-30-S131-g002
Table 1

Comparison of selected health and well-being indicators among OECD countries and the Indian state of Kerala*

jkms-30-S131-i001
Parameters OECD Kerala
Total fertility rate 1.7% 1.7%
Complete immunization 95% 84%
School enrollment 100% 96.90%
Literacy rate 98.50% 90.90%
Human development index 0.87 0.77
Life expectancy (male) 77.0 yr 73.7 yr
Life expectancy (female) 82.5 yr 75.5 yr
Infant mortality rate 6.8 per 1,000 live births 14 per 1,000 live births
Underweight (prevalence) 0- < 1% 23.50%
Stunting (prevalence) 0- < 1% 26.80%

*Source of data: The Planning Commission of India, State Plan for Kerala (6) and the database on health statistics for OECD countries (7).

Notes

AUTHOR CONTRIBUTION Study conception: Subramanian SV, Subramanyam MA. Data collection, analysis, writing: Subramanian SV, Subramanyam MA. Approval of final manuscript and submission: Subramanian SV, Subramanyam MA.

References

1. UNICEF. State of the word's children report. accessed on 15 December 2014. Available at http://www.data.unicef.org/resources/the-state-of-the-world-s-children-report-2015-statistical-tables.
2. International Institute for Population Sciences and Macro International. National family health survey, 2005-06: India, nutrition and anemia. Mumbai: 2007. accessed on 15 December 2014. Available at http://www.rchiips.org/nfhs/NFHS-3%20Data/VOL-1/Chapter%2010%20-%20Nutrition%20and%20Anaemia%20(608K).pdf.
3. UNICEF. Improving child nutrition: the achievable imperative for global progress. New York: United Nations Children's Fund;2013.
4. Subramanyam MA, Kawachi I, Berkman LF, Subramanian SV. Socioeconomic inequalities in childhood undernutrition in India: analyzing trends between 1992 and 2005. PLoS One. 2010; 5:e11392.
5. Dreze J SA. Hunger and public action. Oxford: Clarenden Press;1989.
6. Thiruvananthapuram. State planning board government of Kerala. accessed on 15 December 2014. Available at http://planningcommission.nic.in/plans/stateplan/sdr_pdf/shdr_kerala05.pdf.
7. Organization for Economic Co-operation and Development. StatExtracts: health status. Paris, France: OECD;2014. accessed on 15 December 2014. Available at http://stats.oecd.org/Index.aspx?DataSetCode=HEALTH_STAT).
8. Basu K, Maertens A. The pattern and causes of economic growth in India. Oxf Rev Econ Policy. 2007; 23:143–167.
9. Pritchett L, Summers LH. Wealthier is healthier. J Hum Resour. 1996; 31:841–868.
10. Smith LC, Haddad L. How potent is economic growth in reducing undernutrition? What are the pathways of impact? New cross-country evidence. Econ Dev Cult Change. 2002; 51:55–76.
11. Subramanyam MA, Kawachi I, Berkman LF, Subramanian SV. Is economic growth associated with reduction in child undernutrition in India? PLoS Med. 2011; 8:e1000424.
12. Subramanian SV, Subramanyam MA. Economic growth & health of poor children in India. Indian J Med Res. 2011; 133:685–686.
13. Vollmer S, Harttgen K, Subramanyam MA, Finlay J, Klasen S, Subramanian SV. Association between economic growth and early childhood undernutrition: evidence from 121 Demographic and Health Surveys from 36 low-income and middle-income countries. Lancet Glob Health. 2014; 2:e225–e234.
14. Vollmer S, Harttgen K, Subramanyam MA, Finlay J, Klasen S, Subramanian SV. Association between economic growth and early childhood nutrition--authors' reply. Lancet Glob Health. 2015; 3:e81.
15. Dev SM, Ravi C. Poverty and Inequality: All-India and States, 1983-2005. Econ Polit Wkly. 2007; 42:509–521.
16. Sen A. The rich get hungrier. The New York Times. 2008. 28.
17. Deaton A, Drèze J. Food and nutrition in India: facts and interpretations. Econ Polit Wkly. 2009; 42–65.
18. Johri M, Chandra D, Subramanian SV, Sylvestre MP, Pahwa S. MDG 7c for safe drinking water in India: an illusive achievement. Lancet. 2014; 383:1379.
19. Subramanian SV, Ackerson LK, Davey Smith G, John NA. Association of maternal height with child mortality, anthropometric failure, and anemia in India. JAMA. 2009; 301:1691–1701.
20. Ozaltin E, Subramanian SV. Why we need to rethink the strategy and time frame for achieving health-related Millennium Development Goals. Int Health. 2011; 3:246–250.
21. Ozaltin E, Hill K, Subramanian SV. Association of maternal stature with offspring mortality, underweight, and stunting in low- to middle-income countries. JAMA. 2010; 303:1507–1516.
22. Subramanian SV, Ozaltin E. Progress towards Millennium Development Goal 4. Lancet. 2012; 379:1193–1194.
TOOLS
ORCID iDs

S V Subramanian
https://orcid.org/http://orcid.org/0000-0003-2365-4165

Malavika A Subramanyam
https://orcid.org/http://orcid.org/0000-0002-2999-5211

Similar articles