

 PDF
PDF Citation
 Print
Print


INTRODUCTION
Since the National Institute of Child Health and Human Development (NICHD) Neonatal Research Network was founded in 1986 to perform multi-center trials and observational studies in neonatal medicine (1), studies led by neonatal research networks have played a crucial role in neonatology. Among several neonatal networks around the world, the Vermont Oxford Network, which is composed of over 1,000 neonatal intensive care units, is the largest neonatal network to date (2). Recently, neonatologists' efforts have also led to the establishment of international research networks, including the iNeo collaboration. The iNeo collaboration is composed of eight national neonatal research networks and aims to analyze the outcomes of very-low-birth-weight and very preterm (<32 weeks gestation) infants with a common protocol (3). In general, the goals of neonatal research networks are to generate a large-scale perinatal and neonatal database and to provide an infrastructure from which the network members can design further studies and quality improvement (QI) activities (4).
Clinical research network usually has a central data-coordinating center that is responsible for data analysis and the confidentiality of the reporting system. Member reports are usually provided annually, either in print or as files (5678). Due to the recent advances in online data registration systems using electronic-case reporting forms (e-CRF) or internet transfer of individual datasets, a few neonatal research networks are operating online reporting systems (59). However, little reports are available on the making process or the structure of electronic reporting system of clinical research networks. The Korean Neonatal Network (KNN), has constructed and now operate a real-time DDS that provides the basic statistical analyses of the registered data. The aim of the present report is to describe the structure of the DDS of the KNN and how to build such a DDS, with the hope that this will help other research networks build their own DDS.
MATERIALS AND METHODS
A subcommittee in charge of generating a web-page and DDS for the KNN was formed in April 2013. It consisted of three executive KNN members (Lee BS, Chang YS, and Park EA). Mebixon® was selected to be in charge of the development of the program. A program manager (Moon WH) maintained regular contact with the executive members and staff of the internet-based Clinical Research and Trial management (iCReaT) system (see later) via face-to-face meetings, conference calls, and e-mails. The statistics on the "in-hospital data" were launched in September 2013 after a 3 month test by using retrospective data of about 400 cases that were kindly provided by six participating tertiary neonatal centers (Ajou University Hospital, Asan Medical Center, Korea University Ansan Hospital, Samsung Medical Center, Seoul National University Children's Hospital and Seoul National University Bundang Hospital, listed in alphabetical order) of the KNN. Since December 2014, the statistics on the "follow-up data" were prospectively generated.
RESULTS
Data flow of the data display system
The DDS of the KNN is located on the members' page of the KNN website (www.knn.or.kr). In principle, DDS is secured and only allows access to the principal investigator (PI) of each participating center, the members of executive committee, and the web-page operators. The identification number and password are the same as those used to access the KNN e-CRFs of the iCReaT system (http://icreat.nih.go.kr). The iCReaT system is a web-based clinical research and management system which aims to facilitate nationwide clinical trials by providing services including e-CRF and data management program. It is being operated by the server center of the Korea National Institute of Health (K-NIH). To ensure that the original database of KNN and other clinical researches remains secure and stable, the DDS of the KNN was not allowed to be operated by the central server of K-NIH, instead, it was operated separately by a remote server (previously in Mebixon®, now in Bethesda Soft®).
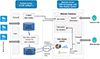
The flow of data display is summarized as follows (Fig. 1). The data for the DDS are selectively extracted from the KNN central database by an automatic scheduler program. Thus, a virtual database for the DDS is newly generated and stored in the server at regular interval. After verification on the KNN member's site, certified users can find a list of "report name" corresponding to the variables of interest in the web page of "Data Statistics". Once a variable is clicked (data field), a chart program in the remote server requests the basic statistics of the variable that meets the conditions defined by users (see later). Data exchange between the central server and the remote server is done with a JavaScript Objective Notation (JSON) format, a lightweight data-interchange format. Our chart application, which was developed on the basis of the HyperText Markup Language (HTML) 5-Chart Application (Highchart®), is to render graphics and tables across commonly-used web browsers, including Internet Explorer, Chrome, Safari, and Firefox. It can support line, spline, area, areaspline, column, bar, pie, and scatter chart types.
System structure of DDS
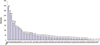
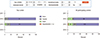
For the DDS, we selected 90 "in-hospital" data variables and 54 "follow-up" variables from the entire set of variables in the e-CRF of the KNN (Table 1). In particular, the hospital ranking of 11 principal outcome variables are displayed on the first page of data statistics' window. The ranked data are displayed as vertical bar chart with shoulder numbers that depict a specific value (stacked numbers or average percent), and each center can only identify their own ranking while being blinded to those of other participating centers (Fig. 2). As for other variables, participating hospitals can compare their performance in terms of each specific variable to those of the entire KNN cohort in the same window.
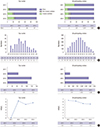
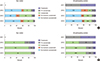
The type of charts used varies depending on the characteristics of the outcome variables. The most common type of chart is the horizontal percentage stacked bars. This shows the percentage that each category contributes to the total for a variable of interest. The vertical axis shows the year of birth of the registered cases which allows users to track the data over time. Infrequently, quantitative data are expressed as horizontal number bar, vertical bar, broken line, or stacked number graphs (Fig. 3). For categorical variables, if a user inactivates or reactivates one or multiple categories by using the toggle function, the data of the remaining categories are proportionally reorganized (Fig. 4). A few quantitative variables in the e-CRF can be converted to categorical variables for chart display. For example, the variable corresponding to the height at 18 months of corrected age is recorded in centimeter, but it can be displayed as the percentage of the corresponding percentile range. The chart graphs can be downloaded as jpeg or pdf file format or can be printed for further use.
The most distinctive feature of the DDS of the KNN that can be discriminated from other reporting systems is the basic statistics function defined by specific conditions (Fig. 5). Four variables, namely, year of birth, gestational week, birth place (inborn/outborn), and birth weight, are assigned as the default conditions. Apart from the year of birth, the user can specify a maximum of three conditions among the variables in the drop-down list of each condition field. Any variable from the 144 outcome variables of the DDS can be selected as the conditions for data filtering. The available conditions include 1) "equal to" or "not equal to" for categorical variables and 2) "equal to", "less than", "greater than", "less than or equal to", "greater than or equal to" or "between" for numerical variables. This function enables the user to create virtually an unlimited combination of conditions that defines a specific outcome variable. For example, in the follow-up data statistics, a user can identify the incidence of cerebral palsy for a group of infants born in 2013-2014 with a gestational age <26 weeks who had maternal chorioamnionitis and presented with a grade 4 of intraventricular hemorrhage.
DISCUSSION
This is the first report on the structure of real-time data reporting system of clinical research network in Korea. We also described here how to make a web-based chart display by using open-source programs. As far as we know, our DDS equipped with the function of conditional search is the world's first one among the neonatal research networks.
The first web-based data reporting system is the Nightingale Internet Reporting System of the Vermont Oxford Network. In that system, the data for reporting system are only available for years up to the recent closed-out year (5). Meanwhile, any uploaded data of the KNN contribute to the data statistics of the DDS once a certified researcher finishes entering a complete set of e-CRF (the status of "data input completed"). If any errors in these "completed data" are found, of course, they will be corrected after confirmation by the PIs of each center and the data coordinating center (the status of "data lock"). This change will be reflected in the data display of the DDS in real-time. Accordingly, the strength of our system is to provide reporting that contains most recently registered data, but the weakness is the risk of inaccuracy in the data statistics, since reporting can be performed before "data lock".
As the clinical outcomes of premature infants are influenced by demographic factors and the quality of hospital care, the ideal reporting system should provide risk-adjusted outcome variables. For example, the mortality data of very-low-birth-weight infants in the annual report of Neonatal Research Network Japan are expressed as standardized mortality rates after multivariate analyses that include the demographic data, common morbidities, and treatments of the infants (10). By using a multivariate risk adjustment model, the Vermont Oxford Network also provides standardized mortality and morbidity ratio or observed-expected differences with 95% upper and lower margins (5). Currently, the risk adjustment is not applied to the first version of our DDS but is only available in the annual report of KNN for locked data. Instead, by specifying up to three conditions that might influence major clinical outcomes such as mortality and major neonatal morbidities, users can generate virtually an unlimited number of cohorts comprised of the cases that belong to the specified conditions. For example, if a center has a policy of resuscitation even in extremely premature infants with gestational age <23 weeks, the mortality rate of the center would rank relatively higher compared to the centers that resuscitate more mature babies. However, the performance evaluation of that center should be done in the selected cohort that is defined by the same range of gestational age. Evaluation could be conducted more objectively if additional variables that may affect neonatal mortality would be defined as conditions. These include maternal antenatal steroid therapy and the policy of early surfactant treatment etc.
A promising potential benefit of our DDS is to support QI initiatives in each participating center. In most neonatal networks, the potential source of center-specific QI are risk factors and practices that are associated with a specific disease and these data are usually derived from the annual report of the entire cohort (11). Compared with annual report, our DDS can provide a more convenient and less time consuming tools for evidence reviews that can be easily performed by clinicians. Besides the diseases and clinical practices, the data on the hospital resources such as workload of doctors or nurses, equipment, medical cost and facilities can be important topics of QI activities (12). Through KNN web-page, the members are obliged to enter data on hospital resources annually and these are stored in the same server that operates the DDS. The data link between the data on resources and the DDS of KNN will enable the users to widen the area of QI activity.
In conclusion, the DDS of the KNN is a real-time data display system that enables researchers to retrieve basic data statistics that can be used for further studies and QI activities. The introduction of conditional filtering tools has provided additional insights that are useful for further in-depth data analyses. Further collaborations are required to upgrade the system to allow a more sophisticated data analyses and to provide a more user-friendly interface.
 XML Download