

 PDF
PDF ePub
ePub Citation
 Print
Print


INTRODUCTION
Neoadjuvant chemotherapy (NAC) has been accepted as the standard treatment for patients with locally advanced breast cancer. Currently, NAC is increasingly used in the early stages of breast cancer to enable breast-conserving surgery by reducing the size of the tumor. NAC for breast cancer was shown to be equally effective as adjuvant chemotherapy in terms of disease-free and overall survival (1). The achievement of a pathological complete response (pCR) or minimal residual disease is the best predictor of a favorable long-term outcome (2). However, a pCR is only achieved by a minority of patients (up to 30%) after the completion of NAC (3). The reliable assessment of both residual disease extent and pCR after NAC is crucial for decision making, surgical planning and the prediction of final outcomes.
The various imaging techniques have led to great progress in the detection, diagnosis, efficacy monitoring and prognosis of breast cancer. Dynamic contrast-enhanced magnetic resonance imaging (DCE-MRI) has been known to be an accurate imaging modality for response evaluation in breast cancer (4, 5). Traditionally, tumor response has been assessed via size measurement applying RECIST criteria during the course of treatment (6). However, rapidly advancing and new functional imaging techniques also raised questions regarding the accuracy of RECIST criteria for response monitoring. Recently, a commercially available computer-aided detection (CAD) program can provide information about both the volume and enhancement parameters of tumor by automated processing and analysis functions. The use of CAD analysis of DCE-MRI is expected to increase both the efficiency and accuracy of tumor response evaluation. Among the promising functional imaging techniques, the use of diffusion weighted MRI (DWI) and positron emission tomography/computed tomography (PET/CT) is also commonly used in clinical oncology imaging and plays a specific role in the assessment of tumor responses to cancer therapy. Accordingly, several studies have been conducted to evaluate the capability of these functional imaging parameters to monitor the response to chemotherapy. However, to the best of our knowledge, no study has yet been published that compares the ability of the imaging parameters of 1) DCE-MRI using CAD analysis, 2) DWI, and 3) PET/CT as response parameters. Additionally, there are no studies yet that have investigated the added value of the above mentioned imaging techniques as response parameters in combination. Thus, the purpose of this study was to evaluate the usefulness of the above-mentioned imaging parameters as valuable response markers for predicting the pathologic response and assessing the treatment response.
MATERIALS AND METHODS
Patients
Between January 2010 and April 2012, a total of 20 patients with locally advanced breast cancer and who were treated with NAC followed by surgery were included in this study. The clinicopathological characteristics of the 20 patients are shown in Table 1. The patients ranged from 29 to 69 yr in age with a mean age of 51.6 yr. Most of the patients were treated with anthracycline- and taxane-based chemotherapy.
MRI and PET/CT were performed before and after the planned chemotherapy (baseline and preoperative study). Both DCE-MRI and DWI were performed in all patients. However, preoperative PET/CT was not performed in 4 patients. Within one month of the imaging studies, all of the patients underwent either breast-conserving surgery with axillary nodal dissection and adjuvant radiotherapy or modified radical mastectomy.
MRI and acquisition
The MRI images were acquired with the patient in the prone position in a 3.0 T scanner (Magnetom Verio; Siemens Medical Solutions, Erlangen, Germany) equipped with a breast coil, using the following sequences: 1) an axial, turbo spin-echo T2-weighted imaging sequence (TR/TE 4530/93, flip angle 80°, FOV 320 mm, matrix 576×403, 4 mm slice thickness); 2) an axial DWI with echo-planar imaging (EPI) (b1=0 and b2=750 s/mm2); and 3) a pre- and post-contrast, axial T1-weighted flash three-dimensional VIBE sequence (TR/TE 4.4/1.7, flip angle 10°, 1.2 mm slice thickness with no gap) obtained before and at 7, 67, 127, 187, 247, and 367 sec after a rapid bolus injection of 0.1 mM/kg body weight of Gd-DTPA (Magnevist, Schering, Berlin, Germany).
Computer-aided evaluation program: DCE-MRI parameter analysis
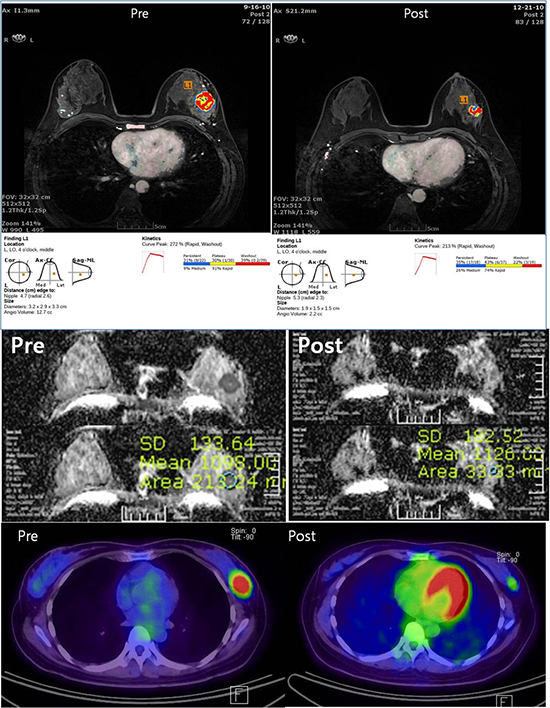
An early first post-contrast series and four late post-contrast image series were transferred to a commercially available MR-CAD (CADSTREAM™ version 4.1.3; Confirma Inc., Kirkland, WA) workstation. A color overlay map was placed on all enhancing lesions at the 50% enhancement threshold level in a pixel-by-pixel comparison across a pre-contrast, early and late post-contrast series. Delayed phase enhancement type after peak enhancement appeared as different colors such as blue for persistent, yellow for plateau and red for washout. The longest diameter (LD), the volume (TV) and contrast peak enhancement (PE) of all enhancing components of the tumor was segmented and calculated automatically (Fig. 1). The response after NAC was assessed using Response Evaluation Criteria in Solid Tumors (RECIST 1.1) (Table 2) (6). Patients with a complete or partial response by the RECIST 1.1 criteria were assigned as responders and patients with stable or progressive disease were assigned as non-responders on DCE-MRI.
DWI and ADC value analysis
DWI was obtained along each of the x-, y-, and z-axes. The apparent diffusion coefficient (ADC) value was calculated according to the formula: ADC=[1/(b2-b1)]ln(S2/S1)], where S1 and S2 are the signal intensities in the regions of interest (ROIs) obtained by two gradient factors, b2 and b1 (b1=0 and b2=750 s/mm2). One radiologist with at least three years of experience in breast MRI manually placed a region of interest (ROI) slightly smaller than the solid portion of the tumor and measured the mean ADC values.
PET/CT acquisition and SUVmax analysis
Images were acquired on combined PET/CT in-line systems, either Biograph Duo or Biograph Truepoint (Siemens Medical Solutions, Knoxville, TN, USA). All the patients fasted for at least 6 hr before the PET/CT examination (blood glucose concentration <130 mg/dL). After 60 min of post-injection of 370 to 550 MBq of 18F-FDG with a saline infusion, PET/CT scan were performed. In supine position, CT scan started at the orbitomeatal line and progressed to the proximal thigh (130 kVp, 80 mA, 5-mm slice thickness; 120 kVp, 50 mA, 5-mm slice thickness) and a PET scan followed immediately over the same body region. The acquired images were reconstructed using a standard ordered-subset expectation maximization (OSEM) algorithm. One radiologist with three years of experience in breast MRI reviewed the medical records and PET/CT report. In the PET/CT report, the maximum value of the standard uptake value (SUVmax) of the breast cancer was measured, and metabolic tumor responses were also evaluated after NAC using PET Response Criteria in Solid Tumor (PERCIST 1.0) (Table 2) (7). Patients with a complete metabolic or partial metabolic response (CMR or PMR) were assigned as responders, and patients with stable metabolic or progressive metabolic disease were assigned as non-responders on PET/CT.
Histological response analysis
The histological response to NAC was assessed by a single pathologist using the residual cancer burden (RCB) index. RCB is a more refined pathologic measurement of residual tumor burden that appears to have better ability than pCR to discriminate response (8). The pathologist reanalyzed pathology reports and images to estimate RCB, a composite pathologic index that considers tumor size, cancer cell density and lymph node involvement. The Web-based MD Anderson RCB calculator was used for the estimation of RCB (http://www3.mdanderson.org/app/medcalc/index.cfm?pagename=jsconvert3). RCB was measured on a continuous scale and was further categorized as 0, I, II or III according to the method described by Symmans et al. (8). Responders were categorized as having an RCB index of 0 or I, while non-responders had an RCB index of II or III.
Data and statistical analysis
First, we evaluated the relationship between the imaging response assessment criteria (RECIST 1.1 and PERCIST 1.0) and pathological response assessment criteria (RCB index) using kappa statistics. A P value was calculated using the McNemar test.
Next, we calculated percent changes with treatment for all of the imaging parameters measured by DCE-MRI with CAD analysis, DWI and PET/CT. The measured imaging response parameters are as follows: 1) LD, TV and PE on DCE-MRI with CAD analysis, 2) ADC value on DWI, and 3) SUVmax value on PET/CT. The differences in the parameters between pathological responders and non-responders were analyzed by the Wilcoxon rank-sum test, and P values were calculated.
Finally, receiver operating curve (ROC) analysis was performed to compare the diagnostic performance of each parameter to predict the pathological response. The best cut-off values of the imaging parameters of DCE-MRI with CAD analysis, DWI and PET/CT were then used to calculate the sensitivity, specificity, positive predictive value (PPV), negative predictive value (NPV) and accuracy for predicting pathological responsiveness. Additionally, the sensitivity, specificity and accuracy were compared between the combined uses of the imaging response parameters among different imaging modalities.
All of the statistical analyses were performed using SAS software (version 9.2; SAS Institute Inc., Cary, NC, USA). A P value less than 0.05 indicated statistical significance.
RESULTS
The reduction in the mean LD was 61.4% (12.41 cm before chemotherapy and 2.27 cm after chemotherapy), and the TV changed from 28.42 mL before chemotherapy to 3.26 mL after chemotherapy with a mean reduction rate of 93%. According to the RECIST 1.1 criteria, 16 patients were responders (80%), and 4 patients were non-responders (20%). Additionally, based on PERCIST 1.0 criteria, 12 patients were responders (75%), and 4 patients were non-responders (25%). pCR was achieved in 3 cases (15%), and 17 patients had residual disease (85%). The strength of agreement was poor between RECIST 1.1 and pathology (κ=0.08, P<0.001) and between PERCIST 1.0 and pathology (κ=0.14, P=0.003) (Table 3).
The percent change of the imaging response parameters measured by DCE-MRI with CAD analysis, DWI and PET/CT based on the pathological response status was compared as shown in Fig. 2 and Table 4. The mean percent change of the imaging parameters measured by DCE-MRI and PET/CT (LD, TV, PE and SUV max) decreased more in responders than in non-responders. By contrast, the mean percent change of ADC value increased more in the responder group. However, the difference was found to be not statistically significant by the two-tailed Wilcoxon rank-sum test.
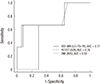
The best pre-treatment cut-off for each parameter to differentiate responders from non-responders with ROC analysis is presented in Fig. 3 and Table 5. The best cut-offs for differentiating pathologic responders from non-responders were a decrease of 87.7% in LD, 99.4% in TV, 57.5% in PE, 80.6% in SUV and an increase of 22.1% in ADC. The AUC values for DCE-MRI, DWI and PET/CT were 0.77 (95% CI=0.28 to 0.89), 0.59 (95% CI= 0.28 to 0.89) and 0.76 (95% CI=0.34 to 1.00), respectively. DCE-MRI analysis using all three CAD parameters resulted in the highest diagnostic performance and accuracy compared with DWI or PET/CT. The sensitivity and PPV of DCE-MRI, DWI and PET/CT were not adequate to predict the pathologic response; however, the specificity and NPV were relatively sufficient.
The results of the response assessment by the combined use of the parameters between different imaging modalities are shown in Table 6. The combined use of 1) LD and SUV, 2) TV and SUV or 3) ADC and SUV showed a trend to improve the specificity and PPV (both specificity and PPV=100%, AUC value=0.67 and accuracy=87.5%) in predicting the pathologic response; additionally, as seen above, the difference was not statistically significant. The overall diagnostic accuracy was lower than the combined use of all three parameters of DCE-MRI analysis using CAD (AUC=0.77, accuracy=90%).
DISCUSSION
In our study, response evaluation using standard RECIST or PERCIST criteria showed moderate correlations with the RCB index. Of the parameters measured by MR-CAD, the use of the longest diameter (LD) and tumor volume (TV) in predicting a pathological response appeared valuable (AUC=0.76), whereas the use of peak enhancement (PE) was insufficient (AUC= 0.69). If all three CAD parameters were used together, DCE-MRI showed the best diagnostic performance and accuracy (AUC= 0.77 and 90%, respectively) in predicting a pathological response compared with DWI (AUC=0.59 and 70%) and PET/CT (AUC= 0.76 and 87.5%). DCE-MRI using CAD analysis and PET/CT showed a similar diagnostic performance. However, the diagnostic performance of DWI was inferior to that of the other two imaging modalities. Among all of the imaging modalities, there was a trend that the sensitivity/PPV was not adequate but that the specificity/NPV was sufficient. Our results showed that the use of SUV on PET/CT in combination with LD or TV on DCE-MRI or the use of SUV in combination with ADC on DWI has the potential to increase its specificity and PPV up to 100% in predicting the pathological response. We thought that the combined use of all three imaging modalities may provide valuable insight to predict treatment response better than each modality alone.
Although the caliper measurement method applying RECIST criteria on DCE-MRI is currently widely used, accurate measurement of the tumor diameter can be challenging in cases of diffusely scattered, irregular, confluent lesions or fragmented or split lesions during NAC. To overcome these limitations, the use of tumor volume measurements as a treatment response parameter has been suggested. Hylton et al. (9) showed that the tumor volume measurements were superior to either clinical assessment or diameter measurement in the prediction of pCR after NAC. However, both the longest diameter (LD) and tumor volume (TV) of the measured parameter by MR-CAD were valuable in predicting a pathological response in our study.
Additionally, several studies have shown the potential of DCE-MRI, DWI and PET/CT or have compared the use of combined imaging modalities to predict an early or a late response in breast cancer during NAC (10, 11, 12, 13, 14, 15, 16, 17). However, the varying results in the separate studies showed that the usefulness of the various imaging parameters was still not clearly defined in predicting the response to NAC in breast cancer. Two recently published meta-analyses (11, 12) showed that DWI had high sensitivity, and DCE-MRI had high specificity to predict a treatment response. The meta-analysis by Wu et al. (10) showed a sensitivity of 68% and 93% on DCE-MRI and DWI, respectively, for predicting pCR to NAC in breast cancer with a specificity of 91% and 82%, respectively. These results suggest that DCE-MRI and DWI could play different roles in response monitoring and could be promising with respect to the evaluation of the pathological response if they are combined. In the study by Lobbes et al. (11), DCE-MRI had a high specificity (50%-97%) and NPV (71%-100%) versus only moderate sensitivity (25%-100%) and PPV (47%-73%) in the prediction for pCR. This meta-analysis included two studies that evaluated the diagnostic accuracies of DWI (12, 13), and the reported sensitivity of DWI was 100% for both, and the specificities were 70% and 91%, respectively. In our study, the sensitivities of both DCE-MRI and DWI were the same (67%) in contrast to previous results (11, 12, 13, 14). However, the specificity of DCE-MRI (94%) was higher than that of DWI (71%) and was similar to previous results (11, 12, 13, 14). In the study that compared DWI with PET/CT for response evaluation by Park et al. (12), DWI showed higher diagnostic performance (AUC=0.91) than PET/CT (AUC=0.87), and the combined use of DWI and PET/CT showed increased diagnostic performance (AUC=0.94) although there was no statistically significant difference. By contrast, our study showed that PET/CT (AUC=0.76, accuracy= 87.5%) was superior to DWI (AUC=0.59, accuracy=70%) for predicting a pathological response. There were several published papers regarding the comparison of DCE-MRI and PET/CT for response evaluation in breast cancer after neoadjuvant chemotherapy (14, 15, 16, 17). In the study that estimated the predictive role of PET CT and DCE-MRI in 45 breast cancer patients by Choi et al. (14), DCE-MRI (AUC=0.91) showed better diagnostic performance than PET/CT (AUC=0.62) for monitoring the effect of NAC. In the study that compared PET/CT and DCE-MRI for the identification of residual tumors in 99 breast cancer patients after NAC by Dose-Schwarz et al. (15), DCE-MRI offered the highest sensitivity and accuracy (97.6% and 91.3%), and PET/CT provided the highest specificity (87.5% at a threshold SUV>2.0). MRI was less accurate in predicting pCR or minimal residual disease with a negative predictive value of 66.7% only. In the study of Park et al. (16), the specificity and PPV for the prediction of pCR were significantly higher on DCE-MRI (95.8% and 83.3%, respectively) than on PET/CT (62.5% and 47.1%, respectively), while the sensitivity and NPV on PET/CT (100% for both) tended to be higher than on MRI (62.5% and 88.5%, respectively). Similar results were observed in the study of Tateishi et al. (17). They compared the parameters of DCE-MRI and PET/CT at baseline and after two cycles of NAC. The sensitivity, specificity, and accuracy to predict pCR were 45.5%, 85.5%, and 82.4%, respectively, with RECIST criteria (on DCE-MRI) and 70.4%, 95.7%, and 90.8%, respectively, with PERCIST criteria (on PET/CT). Of the various predictive imaging parameters of DCE-MRI and PET/CT, they found that the specificities of % SUVmax, % kep, and % AUC90 (96.4%, 92%, and 95.2%, respectively) were high for a stratification of pathological responders in breast cancer. In our study, the diagnostic performance of DCE-MRI (AUC=0.77) was similar to that of PET/CT (AUC=0.76) for the prediction of pCR. Both DCE-MRI and PET/CT showed the same sensitivity for the prediction of pCR (66.7%). However, the specificity and accuracy of DCE-MRI (94.1% and 90.0%, respectively) was higher than those of PET/CT (92.3% and 87.5%, respectively).
As discussed above, the use of imaging parameters as response markers for NAC had shown weak evidence because the separate studies showed varying results. We believed that these discrepancies among previously published data were caused by significant differences in the study designs and data analysis methodologies, the inconsistency of the studied parameter for analysis and underpowered results due to a small number of patients. Further investigation and validation for the use of the imaging parameters should be necessary for its adaptation as established surrogate end points of response.
Our study has some limitations. First, this is a retrospective study with a small sample size. In addition, all of the patients were treated with anthracyclne-based chemotherapy. Therefore, the present study results could not be applied to patients who receive another regimen, including molecular target drugs. Second, PET/CT before surgery was not performed in four patients, and the SUV analysis is missing in these cases. Third, inter- and intraobserver variability and the reproducibility of the ADC and SUV measurements were not evaluated. Considering these limitations, this is the first investigation to compare the usefulness of response parameters of DCE-MRI assessed by CAD, DWI and PET/CT to predict the pathological response and the response evaluation during NAC. Moreover, we used the RCB index as a more refined pathologic measurement to discriminate the pathological response for the comparison with imaging parameters.
In conclusion, DCE-MRI using CAD analysis was found to be superior to the other techniques and may be chosen for the response evaluation and prediction of the pathological response before surgery. The functional parameters of DCE-MRI, PET/CT and DWI may play a possible complementary predictive role in the treatment response assessment. The combined use of the parameters of PET/CT with DCE-MRI or DWI has the potential to improve specificity. Further investigations on a larger number of patients are necessary to ensure and validate the value of the imaging response parameters in the NAC setting.


 XML Download