

 PDF
PDF ePub
ePub Citation
 Print
Print


INTRODUCTION
For several decades schizophrenia has been studied in various aspects including through structural analysis (1, 2), working memory impairment (3), and motor function (4). Consistent sensorimotor (SM) abnormalities in schizophrenics include prolonged reaction times (5, 6), delayed movement initiation, reduced motor steadiness, baseline force maintenance abnormalities, slowed repetitive movements performance, impaired synchrony (6) and impairment of the voluntary preparatory process of motor movements (7). A laterality of the SM deficits, consistent with a hypothesized left cerebral pathology in schizophrenia, has also been reported in studies of unmedicated patients (8, 9).
However, there are contradictory findings regarding activation patterns in the primary and SM cortical regions. Studies have reported primary and supplementary motor cortex activation (8, 10, 11, 12, 13), hyperactivations (10), or similar activations in subjects with schizophrenia compared to controls (9, 14, 15, 16). The most common motor task used is either the dominant or non-dominant hand performing sequential finger-to-thumb movements similar to items from the Heidelberg Neurological Soft Sign (NSS) task (17). Rogowska et al. (12) reported that subjects with schizophrenia showed a significant reduction of signal intensity and laterality in both primary motor and supplementary motor regions. Buckley et al. (15), on the other hand, used a similar finger tapping exercise and observed that the intensity and area of the subjects' activations were indistinguishable from those of controls'. Mager et al. (16) and Braus et al. (14) presented similar results to those reported by Buckley et al. (15), who reported that subjects with schizophrenia showed strong activation around the contralateral central sulcus, but no significant difference from the controls. Barch et al. (18) analyzing the motor responses during a cognitive task also found "intact activation" of the sensorimotor cortex in first episode patients, while prefrontal dysfunction was already evident in their working memory task.
Most of the studies about motor function drew their conclusions from rather small sample sizes, anywhere from 7 to 20 subjects with schizophrenia. The tasks were often self-driven, including motor planning and sequencing requirements along with the motor movement response itself. The purpose of this study was to investigate how the sensorimotor cortex area responds to a slow, visually-driven contingent-response finger tapping task in schizophrenic patients compared to healthy controls. This study analyzed a large multi-site dataset collected during Phase 2 of the Function Biomedical Informatics Research Network (FBIRN). FBIRN was a multi-center initiative designed to provide a collaborative infrastructure for biomedical data collection, storage and analysis. The FBIRN test bed applied multi-site fMRI to investigate the underlying pathology of schizophrenia (19, 20). Multi-center brain imaging allowed FBIRN to assess large, representative samples of individuals with schizophrenia and healthy controls that were unavailable to most single-center fMRI studies.
MATERIALS AND METHODS
Subjects
The FBIRN Phase 2 multi-site dataset had been collected from 253 subjects by fBIRN research group (http://www.birncommunity.org/tag/functionbirn/). A total of 125 healthy volunteers (HV) and 125 subjects with schizophrenia (SZ) aged between 19 and 65 yr old from eight different universities participated in this study excluding three severe noise (Three subjects were removed due to severe artifacts). All subjects had sufficient eyesight to appropriately see the displays. Schizophrenia subjects with a history of major medical illness and healthy subjects with a current or past history of major neurological, psychiatric or major medical illness were excluded. The imaging data from the 85 SZ and 86 HV whose data passed the quality assurance metrics with minimal subject motion and maximal head coverage, were analyzed in this study.
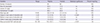
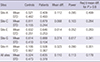
Subjects with schizophrenia met the Diagnostic Standards Manual IV (DSM-IV) criteria for schizophrenia and consisted of 59 males and 26 females, with a mean age of 36.9 (standard deviation=11.6 yr). The healthy volunteers included 51 males, 35 females, mean age of 37.3 yr (standard deviation=12.4 yr). All patients were on stable medication regimens prior to the time of the fMRI examination. Written informed consent, including permission to share data with the wider research community, was obtained from each study participant at his/her site. Subject' demographs are summarized in Table 1.
Image acquisition
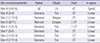
Details of the scanners used in this study are summarized in Table 2. The scanning session included both structural and functional scans. The functional scans were T2*-weighted gradient EPI sequences, with TR=2, TE=30 ms, flip angle 90 deg, acquisition matrix 64×64, 22 cm FOV, 27 slices (all sites except a Site-D which provided only 21 slices), 4 mm thick with 1 mm gap, oblique axial, AC-PC aligned. A brief training session to familiarize the subject with the task paradigm was provided before the scanning session. The stimuli and responses were presented and collected using E-prime software using a SRBox response device. All subjects were scanned according to the same protocol at each site.
The sensorimotor task was a block design with block duration of 16 sec. Each task began with the baseline block, a fixation cross without any finger movements. The subjects were instructed during the active blocks to press a button using the index finger of their right hand in response to an irregularly flashing black and white circular checkerboard. The checkerboard flashed 21 times during each active block, for 200 ms each, with a random interstimulus interval (ISI) ranging from 500-1,000 ms (average ISI=762 ms with a standard deviation of 156 ms). A single run of the task lasted 246 sec. Functional MR images were acquired from two runs of the task during a single visit.
Image analysis
The first three images were discarded in order to allow the signal to stabilize. Then, fMRI analysis was carried out using an fBIRN Image Processing Stream (FIPS), which is an imaging analysis tool for the multi-site fMRI analysis based on FSL (21). Images were motion corrected using MCFLIRT (22). After motion correction, slice-timing correction was applied using Fourier-space time-series phase-shifting. Then the images were skull stripped using the BET tool (23). The extracted brain images were smoothed spatially using a Gaussian kernel of FWHM 8 mm.
Time-series statistical analysis was carried out for each run using a general linear model along with the hemodynamically corrected reference paradigm (24). Each result was registered and normalized to a standard template from the Montreal Neurological Institute (MNI) using 4×4 affine transformations. For each subject cross-run analysis was carried out using a standard weighted fixed effects model. The differences between fixation and stimulation conditions for groups of HV and SZ subjects were statistically evaluated using the random effects model analysis in FSL, including the effects of task, diagnosis, and with the source site of the subjects as a covariate.
Statistical maps of the differences between diagnostic groups were generated on a voxel-by-voxel basis, and thresholded using clusters determined by Z>2.3 and a corrected cluster significance threshold of P≤0.05. Anatomical loci were identified via translation to MNI coordinates and the Talairach Daemon (25) and by agreement on the Brodmann atlas in Mricro (26).
Percent signal change and lateralization quotient
Masks of four regions of interest (ROI) in each hemisphere were constructed to extract percent BOLD signal change compared to baseline from specific cortical areas: the somatosensory area (BA1-3), primary motor area (BA4), their combination as sensorimotor cortex (BA1-4, see Supplemental material B), and the premotor area (BA6). These regions were defined using the WFU_PickAtlas tool (27), dilated by one voxel using a 3D dilation function. Since the mean value over the entire region can be driven by outlier values, we chose to use the individual's 90% percentile value (as defined by the Featquery tool in FSL) as the percent signal change measure for each subject and region.
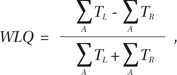
The laterality quotient can be calculated from the number of voxels in each hemisphere's ROI that pass a certain significance threshold. However, a simple ratio of the number of activated voxels in contralateral motor cortex to the number of activated voxels in ipsilateral motor cortex may not reflect global activation fully (28, 29). The weighted lateralization quotient (WLQ) takes into account the sources of individual variability better than the simple counting of activated voxels (28).
The WLQ was computed for each sensorimotor region by first calculating a mean maximum t-value defined as the mean of those top 5% of highest activation voxels. Then, for comparison with the findings of Bertolino et al. (28), the summation of t-values was calculated for the voxels with a t-value exceeding 50% of the mean maximum t-value. The WLQ was calculated by an equation defined as below: where A is the set of activated voxels with 50% of mean t-values, and TL and TR are the t-values of left hemispheric and right hemispheric voxels, respectively.
RESULTS
Voxel-wise analyses
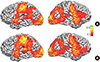
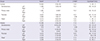
Fig. 1 shows the areas of significant activation for both the HV (1a) and SZ (1b) groups overlaid on a standard brain atlas. The result was thresholded at Z>2.3, with a cluster-wise significance of P≤0.05. Both HV and SZ subjects displayed similar patterns of activations during the sensorimotor task; activations were stronger on the left hemisphere than on the right, and included widespread activation in sensorimotor cortices, visual cortices, and throughout parietal and frontal lobes (see Table 3 for summaries of the results both overall and by ROI).
Our whole-brain, voxel-based analysis of the difference between SZ and HV subjects showed no significant clusters. The effect of diagnosis also showed no significant clusters when restricted to any of the ROIs. All motor cortex ROIs showed a larger number of voxels in left hemisphere, while visual cortex showed a larger number of voxels in right hemisphere. The difference in number of significant voxels (cluster size) between SZ and HV was not significant.
Percent signal change and laterality in primary motor cortex
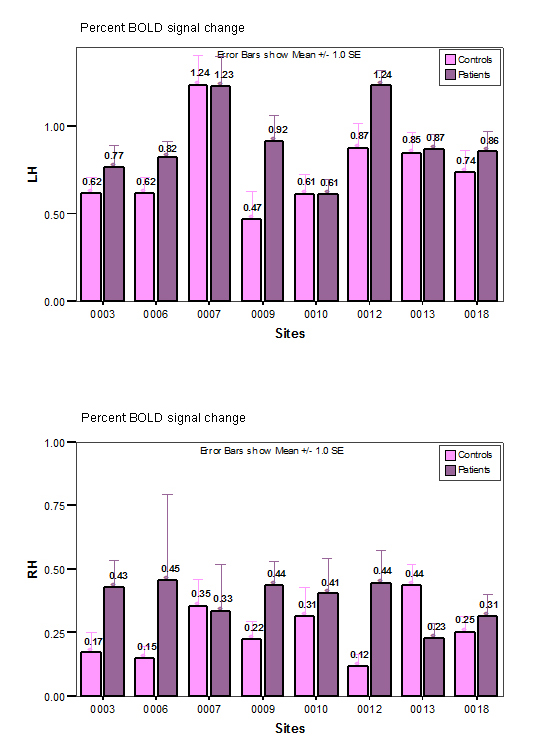
The percent change of the BOLD signal over left and right sensorimotor cortex (BA1-4) of both subject groups at each data collection site is shown in Fig. 2. The measurements in sensorimotor and primary motor cortices (BA1-3 and BA4) were similar to that of sensorimotor cortex, and thus the larger combined sensorimotor ROI (BA 1-4) was used in the remaining analyses. Six out of 8 sites showed a stronger activation in SZ's left sensorimotor region compared to HV, while two sites showed the opposite effect. However, none of these differences were significant.
The percent activation of left combined sensorimotor ROI in these results was 2.66 and 2.40 times higher than that of the right for HV and SZ subjects, respectively, as expected given the right-handed responses. The WLQ from the combined sensorimotor ROI on each subject reflected the stronger activation in left hemisphere (for detailed results see power analysis). The mean WLQ was 0.54 (s.e.=0.05) and 0.64 (s.e.=0.04) for controls and patients, respectively, each of which is significantly different from zero, reflecting that the left hemispheric activation is stronger than right hemispheric activation for both groups. However, there was no significant difference in this lateralization measure between HV and SZ subjects (F[1, 155]=2.24, P=0.14). These results prompted the power analyses discussed below.
Power analysis
Given the lack of significant group differences despite our large sample size of 85 subjects with schizophrenia and 86 healthy volunteers, we calculated effect sizes and performed power analyses, to determine 1) whether we were losing power by combining subjects across sites and 2) the size of the dataset needed to find significant group differences. To determine if we were losing power by pooling data from different sites, we analyzed individual sites' datasets separately. Subjects were selected from sites in which there were ten or more controls and patients, similar to what is seen in the literature. Thus, 136 subjects from only five sites, Site-A, Site-C, Site-E, Site-G, and Site-H were included in the first power analysis.
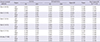
The power of each site's dataset was analyzed to find out what sample sizes would be required to have a significant difference between the subjects with schizophrenia and the controls (30), using the results found in that site's sample from the left combined sensorimotor region (BA 1-4). Table 4 shows the result of the power analysis on the difference in percent signal changes between HV and SZ subjects. For each site, we report the percent signal changes and standard deviation of the ROI in each of the subject groups, the difference between the two groups, and the power found in that analysis. The final column shows the difference in BOLD signal which would be required in that sample for it to be significant with power of 0.8, given the variance in the acquired sample. The power of the combined sample is greater than that of three of the five datasets; the larger sample would be capable of identifying a smaller true difference in BOLD signal measures than any of the separate subsets of the data.
Table 5 shows the similar power analysis of the WLQ. In this case, the minimum detectable difference in the combined dataset is still less than in any of the individual datasets; the combined dataset had improved power over four of the five sites' individual datasets.
DISCUSSION
Our study supports two major results: 1) there is no large, consistent difference in motor cortex activation between healthy controls and schizophrenic patients in this task, and 2) both controls and schizophrenia patients show stronger activation on the left hemisphere for a right finger tapping task.
Our findings contradict some of others (8, 10). These contradictory findings in primary motor and sensorimotor activations may be explained by task differences between studies (31). The tasks in prior sensorimotor studies are similar, but not exactly the same at the one used in this study. While some tasks were simple enough that a subject neither learned nor planned the movement (14, 15), some tasks were complex enough to distinguish any deficiency in motor skill (11). Our simple motor task of slow (1.5 Hz) contingent-response button presses does not require any speed, force, internal timing, motor sequencing or motor learning. Rogowska et al. (12), who found a deficit in SZ motor activation, was using a slow (~1 Hz), regular movement of the thumb to each finger in turn, externally-paced via an auditory cue. This task includes coordination of multiple different movements, simple, yet with multiple components. The FBIRN task was deliberately a single movement-the use of a single finger to press only one button-driven by a slow but irregular external stimulus. The point of this study is to develop a task which the subjects with schizophrenia could perform similarly to healthy subjects, to have a functional baseline against which cognitive dysfunction in other tasks could be validated. The analyses here indicate that this task is one that schizophrenic patients can perform while showing the same BOLD signal changes as healthy subjects.
The large sample size of 171 subjects in this analysis is a much larger dataset than is usually collected to explore schizophrenic dysfunction in fMRI studies, and adds to the robustness of our findings. The power analyses support the validity of our multi-center analyses in terms of statistical power. The power of the combined sites is larger than the power of three to four of the five individual sites (Tables 4 and 5), and the combined dataset would be sensitive to a much smaller group difference than any individual dataset, arguing increasing the number of subjects by pooling data across sites did not decrease the power of the study. Any estimated difference can be found to be "significant" with a large enough sample; however, the power analyses indicate that the difference in percent signal change would be found to be statistically significant with several hundred subjects in each group-this is clearly an effect which is fundamentally smaller than the differences in working memory function or attention that are published in studies of schizophrenia each year with samples of 30 subjects, for example. The power analysis of WLQ, summarized in Table 5, can also be interpreted in a similar manner.
This is one of the few sensorimotor studies that have been conducted with a large sample size collected at multiple sites. The task was designed so that subjects would be able to perform the task regardless of disease status. Both groups showed significant activation in the contra- and ipsilateral sensorimotor and visual cortex during the finger tapping contingent response task. There were no significant differences between the BOLD signal responses in schizophrenics and controls at the voxel-wise level, the region of interest level, or in lateralization. The use of a multi-site dataset gave us the capability to perform immediate replications, through analysis of the datasets from each site individually. This confirmed that the similarity between schizophrenics and controls was seen in each of the independent samples. In conclusion, the fBIRN sensory-motor paradigm may provide a useful active baseline task for the study of physiological dysfunction in schizophrenia.
 XML Download