Journal List > J Korean Med Sci > v.30(12) > 1022825

Lee, Song, Shin, Ro, Kim, and Holmes: The Relationship between Clinical Outcome in Subarachnoidal Hemorrhage Patients with Emergency Medical Service Usage and Interhospital Transfer

Abstract

Prompt diagnosis and appropriate transport of patients with subarachnoid hemorrhage (SAH) is critical. We aimed to study differences in clinical outcomes by emergency medical services (EMS) usage and interhospital transfer in patients with SAH. We analyzed the CAVAS (CArdioVAscular disease Surveillance) database which is an emergency department-based, national cohort of cardiovascular disease in Korea. Eligible patients were adults with non-traumatic SAH diagnosed between January 2007 and December 2012. We excluded those whose EMS use and intershopital transfer data was unknown. The primary and secondary outcomes were mortality and neurologic status at discharge respectively. We compared the outcomes between each group using multivariable logistic regressions, adjusting for sex, age, underlying disease, visit time and social history. Of 5,461 patients with SAH, a total of 2,645 were enrolled. Among those, 258 used EMS and were transferred from another hospital, 686 used EMS only, 1,244 were transferred only, and 457 did not use EMS nor were transferred. In the regression analysis, mortality was higher in patients who used EMS and were transferred (OR 1.40, 95% CI 1.02-1.92), but neurologic disability was not meaningfully different by EMS usage and interhospital transfer. In Korea, SAH patients' mortality is higher in the case of EMS use or receiving interhospital transfer.

Graphical Abstract

jkms-30-1889-abf001

INTRODUCTION

Subarachnoid hemorrhage (SAH) is a critical disease with high mortality despite a relatively low incidence (12). According to the World Health Organization, the age-standardized incidence rates of hemorrhage from a ruptured aneurysm ranges from 2 to 22.5 per 100,000 (3). Furthermore, approximately 10% to 15% of patients with SAH from a ruptured aneurysms die before hospital arrival, and the overall mortality rate is about 40%. Surviving patients of SAH suffer from degradation of long-term cognitive ability and function, resulting in a quality of life of approximately 46% (456).
Various methods to enhance the clinical outcomes of SAH have been studied. Treatment of SAH patients at high-volume hospitals improves outcomes likely due to the availability of specialized equipment and experienced clinicians (789). An important risk factor associated with SAH morbidity and mortality is rebleeding which can occur due to delayed patient transport or blood pressure fluctuations (10). Rebleeding has recently been shown to be more frequent when systolic blood pressure is over 160 mmHg (111213).
Considering the evidences, it is possible that transferring patients with SAH will have an unfavorable effect on clinical outcomes, especially when the transfer delays the delivery of timely treatment.
The objective of this study was to investigate the relationship between patient transfer and clinical outcomes in patients with non-traumatic SAH.

MATERIALS AND METHODS

Study design and setting

This is a retrospective observational study of patients with SAH presenting to the emergency departments of 29 institutions participating in the CArdioVAscular disease Surveillance (CAVAS) network. CAVAS is a national, emergency department-based, cardiovascular surveillance project sponsored by the Korea Centers for Disease Control and Prevention. Data was collected from January 2007 to December 2012.
CAVAS network is composed of 18 secondary and 11 tertiary hospitals in Korea. These hospitals oversee the emergency medical services (EMS) in their regions. These hospitals have the facilities and physician experience to provide care to a variety of serious injuries and illnesses including patients with SAHs.
The Korean EMS system is organized by 16 municipal and provincial governments. This national EMS system provides medical treatment and transfer services at emergencies for the population of 50 million, and basic to intermediate level of medical treatment can be provided.

Study population

The study population included all patients over 18 yr of age with SAHs identified in the emergency departments of the 29 participating hospitals in the CAVAS project. Patients were considered to have a SAH if their ICD-10 code was I60.0-I60.8. The diagnosis of SAH was made by clinical presentation and verified by hemorrhage in the subarachnoid space on computed tomography (CT) or cerebrospinal fluid examination demonstrating RBCs with no clearing of blood in serial tube, or abnormal xanthochromia. All patients were classified into four groups depending on the EMS utilization and interhospital transfer. These four groups included: used EMS and interhospital transferred group, used EMS and not transferred group, not used EMS and interhospital transferred group, not used EMS and not transferred group.

Exclusion

Patients were excluded if any of the following variables were missing: interhospital transfer status, or outcome at hospital discharge. Patients who arrived at the emergency department after 24 hr from symptom onset were excluded.

Data collection

Data was derived from patient records. Interhospital transfer was defined as transfer of a patient to another medical institution for subsequent hospitalization. Additional variables collected included gender, age, normal exercise, associated disease history, smoking history, alcohol consumption, early symptoms, presence of cardiac arrest and clinical severity.

Outcome measurement

The primary outcome was in-hospital mortality. The secondary outcome was disability measured at the time of hospital discharge. Disability was measured by the modified Rankin Scale at the time of hospital discharge. Patients were considered to have disability if his or her modified Rankin Scale was below 3.

Statistical analysis

Continuous variables were reported as median and interquartile range (IQR). Student's t-tests were used to compare normally distributed continues variables and Wilcoxon Rank sum test was used to compare non-normally distributed data. Categorical variables were compare using Fisher's exact test. P values less than 0.05 were defined as statistical significance, and all statistical analyses were performed using SAS (version 9.1).
The impact of interhospital transfer and EMS transport was assessed by a multivariable logistic regression with propensity score matched subsets. The propensity score is the clinical factors of each case related to the prognosis. The matched variables were age, sex, education level, visit time at emergency departments, day of the week, past medical history, health behavior including smoking, alcohol consumption, etc. In addition, we performed an interaction model analysis to test the interhospital transfer effect for each EMS utilization group.

Ethics statement

The study was reviewed and approved by institutional review board in Seoul National University Hospital (IRB No. 1012-134-346).

RESULTS

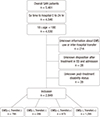
During the 6-yr study period, 5,461 patients diagnosed with SAHs were identified. After eliminating the 2,612 patients with exclusion criteria, 2,849 patients were included in the study sample for analysis (Fig. 1).
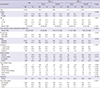
These 2,849 patients were classified into four groups in accordance with EMS utilization and interhospital transfer. Baseline characteristics and demographic distribution of the four groups are provided in Table 1. The average age of patients in the four groups was in the range of 52 to 55 yr. EMS use increased as age increased, however, interhopital transfer did not change based on patient's age. More females than males were identified in this study population, but no statistically significant difference was observed by gender on EMS utilization or interhospital transfer. Rate of EMS utilization was increased in patients with higher educational background. More patients with SAHs presented on weekdays, and a higher proportion of interhospital transfers were performed. 1,105 (38.8%) of all patients had hypertension.
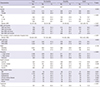
Mortality rates were higher in patients who used EMS or underwent interhospital transfer. Patients who did not use EMS or interhospital transfer had lower rates of disability at discharge (P<0.001). Educational background was also an influential factor such that patients with educational background of high school or higher had lower odds of disability and mortality at discharge (P<0.001). Mortality and disability rates were higher in patients who presented to the emergency department during nighttime hours (P=0.003). Patients who exercise regularly had lower rates of mortality and disability. In patients with underlying diseases such as diabetes, hypertension, heart disease, and stroke, the rates of mortality and disability were higher. Furthermore, a shorter arrival time to the final hospital disposition was associated with a higher mortality rate (P<0.001) (Table 2).
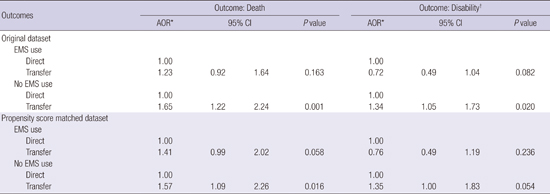
In order to identify the associations of clinical outcomes with EMS utilization and interhospital transfer, propensity score matching and logistic regression analysis were performed. Table 3 shows the demographic findings of the propensity score matched dataset by interhospital transfer. No statistically significant differences were identified. In the multivariate regression analysis, mortality was higher in patients who utilized EMS in both the original and propensity score matched datasets. This result was identified regardless of the patient's interhospital transfer status. In terms of disability, patients who did not use EMS nor underwent interhospital transfer had lower odds of disability (Table 4). Finally, we performed another multivariate regression analysis including an interaction model to identify the effect of interhospital transfer on morbidity and mortality. In this analysis, the presence of interhospital transfer had no effect on disability but mortality was higher especially in the patients who did not use EMS (Table 5).

DISCUSSION

SAH is a critical illness with detrimental outcomes and requires careful, specialized treatment and close neurologic monitoring. Thus, ensuring patients with SAHs are treated at the most appropriate hospital, including the need for interhospital transfer, is regarded as an important factor in the course of treatment for SAH patients. The impact of EMS utilization and interhospital transfer on patient outcomes, however, has not been fully explored.
In terms of patient transfer to more specialized hospitals with larger patient volumes, Bardach et al. (14) studied the cost-effectiveness of interhospital transfer of patients with aneurysmal SAH to large-volume hospitals. They reported a 1.6 times increase in quality-adjusted life year when patients with SAHs were transferred. While this study appeared to recommend interhospital transfer of SAH patients to large-volume hospitals, other studies question this practice as transferred patients required more resources, had a worse prognosis than patients who visited hospitals directly, had delayed boarding time, and had extended treatment period in intensive care units. Therefore, the benefits and decisions to transfer patients to large-volume hospitals require careful consideration (1516171819).
Recent studies have addressed the effects of interhospital transfer of patients with myocardial infarction (2021), and one study reported no significant effects of interhospital transfer in these populations (22). In a previous study of patients with SAHs, interhospital transfer improved clinical outcomes for patients treated at high-volume hospitals, but no analysis on the cost and risk of interhospital transfer have been reported (21).
The current study demonstrates that mortality is higher in patients initially transported to the emergency department via EMS. Initial symptoms in patients with SAHs are highly variable and the utilization of EMS likely increases in patients with severe symptoms. Unfortunately, CAVAS data are not only for SAH but also for whole acute severe cardiovascular diseases, we cannot use the variables like initial symptom or Hunt Hess classification. So, after propensity score matched, this tendency which the higher mortality in EMS used patients is maintained. It means we cannot successfully reach the even distribution containing initial severity by propensity score matching.
When evaluating the effect of interhospital transfer on clinical outcomes the effect is greatest in patients not transported by EMS as mortality was highest in the group. This finding may be due to several reasons. First, the initial hospital may not have the capabilities to treat patients with SAHs. The patient may select a closer hospital, not be aware of the severity of their illness or lack education about the possibility of EMS transport. Second, a resource problem may exist. Smaller emergency departments may not be able to manage patients with SAH after the diagnosis is made. Availability of specialists to treat patients with SAHs in rural and suburban areas especially on the weekend or at night is limited. Finally, the transfer process itself can lead to problems and additional morbidity or mortality. Transfer of patients with SAH should be both swift and safe to minimize possible complications such as rebleeding, but this is not always possible. Further study is required to determine the relationship of EMS use and interhospital transfer on morbidity and mortality in patients with SAH.
This study has certain limitations. It is a retrospective analysis of an existing database and subject to the inherent biases in such a study. The database did not have initial GCS score at the time of emergency department presentation or results of the initial emergency department cranial CT scan. Consequentially, there is insufficiency in severity adjustment.
In conclusion, patients with SAH who use the EMS system have worse clinical outcomes than those who do not. Patients who undergo interhospital transfer without initial EMS transport have higher mortality.

Figures and Tables

Fig. 1

Study population and their group.

jkms-30-1889-g001
Table 1

Baseline characteristics and demographics by eligible patients

jkms-30-1889-i001
Characteristics Total EMS (+) EMS (-) P value
Direct Transfer Direct Transfer
No. % No. % No. % No. % No. %
Total 2,849 795 286 473 1,295
Gender
 Male 1,179 41.4 311 39.1 126 44.1 199 42.1 543 41.9 0.428
 Female 1,670 58.6 484 60.9 160 55.9 274 57.9 752 58.1
Age 0.061
 ≤ 40 402 14.1 98 12.3 37 12.9 76 16.1 191 14.7
 41-60 1,544 54.2 413 51.9 153 53.5 255 53.9 723 55.8
 61- 903 31.7 284 35.7 96 33.6 142 30.0 381 29.4
 Median (IQR) 53 (45-63) 55 (46-66) 54 (46-65) 53 (45-63) 52 (45-62) < 0.001
Time symptom onset to destination hospital (min) < 0.001
 Median (IQR) 135 (60-297) 45 (29-89) 178.5 (119-358) 117 (47-296) 195 (120-385)
ED visit time 0.025
 6PM-6AM 1,297 45.5 356 44.8 146 51.0 191 40.4 604 46.6
 6AM-6PM 1,552 54.5 439 55.2 140 49.0 282 59.6 691 53.4
Week 0.033
 Weekday 2,061 72.3 557 70.1 205 71.7 328 69.3 971 75.0
 Weekend 788 27.7 238 29.9 81 28.3 145 30.7 324 25.0
Education < 0.001
 < High school 1,046 36.7 281 35.3 118 41.3 172 36.4 475 36.7
 ≥ High school 1,419 49.8 429 54.0 141 49.3 256 54.1 593 45.8
 Unknown 384 13.5 85 10.7 27 9.4 45 9.5 227 17.5
Health behavior
 Exercise 547 19.2 155 19.5 54 18.9 82 17.3 256 19.8 0.707
 Current smoker 752 26.4 197 24.8 84 29.4 121 25.6 350 27.0 0.475
 Ex-smoker 174 6.1 46 5.8 19 6.6 36 7.6 73 5.6
 Alcohol 982 34.5 258 32.5 122 42.7 145 30.7 457 35.3 0.004
Past medical history
 DM 220 7.7 68 8.6 24 8.4 42 8.9 86 6.6 0.265
 Hypertension 1,105 38.8 357 44.9 117 40.9 188 39.7 443 34.2 < 0.001
 Dyslipidemia 83 2.9 27 3.4 9 3.1 15 3.2 32 2.5 0.633
 Chronic kidney disease 84 2.9 31 3.9 10 3.5 21 4.4 22 1.7 0.004
 Heart disease 113 4.0 45 5.7 5 1.7 27 5.7 36 2.8 < 0.001
 Stroke 173 6.1 54 6.8 18 6.3 40 8.5 61 4.7 0.022
Treatment 0.119
 Coiling 591 20.7 153 19.2 70 24.5 110 23.3 258 19.9
Post-stroke status < 0.001
 No disability 1,280 44.9 281 35.3 106 37.1 275 58.1 618 47.7
 Disability 807 28.3 210 26.4 58 20.3 133 28.1 406 31.4
 Death 762 26.7 304 38.2 122 42.7 65 13.7 271 20.9

EMS, emergency medical service; ED, emergency department; DM, diabetes mellitus.

Table 2

Demographics of total study population by hospital outcomes

jkms-30-1889-i002
Characteristics Total No disability Disability Death P value
No. No. % No. % No. %
Total 2,849 1,280 807 762
Gender 0.203
 Male 1,179 515 43.7 328 27.8 336 28.5
 Female 1,670 765 45.8 479 28.7 426 25.5
Age < 0.001
 ≤ 40 402 223 55.5 100 24.9 79 19.7
 41-60 1,544 785 50.8 423 27.4 336 21.8
 61- 903 272 30.1 284 31.5 347 38.4
 Median (IQR) 53 (45-63) 50 (44-59) 54 (46-65) 58.5 (48-70) < 0.001
EMS and transfer < 0.001
 EMS and direct 795 281 35.3 210 26.4 304 38.2
 EMS and transfer 286 106 37.1 58 20.3 122 42.7
 Non-EMS and direct 473 275 58.1 133 28.1 65 13.7
 Non-EMS and transfer 1,295 618 47.7 406 31.4 271 20.9
Time symptom onset to destination hospital (min) < 0.001
 Median (IQR) 135 (60-297) 157 (65-360) 144 (65-300) 106.5 (42-208)
ED visit time 0.003
 6PM-6AM 1,297 540 41.6 379 29.2 378 29.1
 6AM-6PM 1,552 740 47.7 428 27.6 384 24.7
Week 0.184
 Weekday 2,061 905 43.9 590 28.6 566 27.5
 Weekend 788 375 47.6 217 27.5 196 24.9
Education < 0.001
 < High school 1,046 408 39.0 311 29.7 327 31.3
 ≥ High school 1,419 744 52.4 385 27.1 290 20.4
 Unknown 384 128 33.3 111 28.9 145 37.8
Health behavior
 Exercise 547 275 50.3 158 28.9 114 20.8 0.001
 Current smoker 752 361 48.0 205 27.3 186 24.7 0.048
 Ex-smoker 174 62 35.6 60 34.5 52 29.9
 Alcohol 982 491 50.0 269 27.4 222 22.6 < 0.001
Past medical history
 DM 220 79 35.9 60 27.3 81 36.8 0.001
 Hypertension 1,105 462 41.8 317 28.7 326 29.5 0.011
 Dyslipidemia 83 41 49.4 22 26.5 20 24.1 0.703
 Chronic kidney disease 84 28 33.3 27 32.1 29 34.5 0.082
 Heart disease 113 35 31.0 29 25.7 49 43.4 < 0.001
 Stroke 173 70 40.5 38 22.0 65 37.6 0.003
Treatment < 0.001
 Coiling 591 358 60.6 157 26.6 76 12.9

EMS, emergency medical service; ED, emergency department; DM, diabetes mellitus.

Table 3

Demographics of propensity score matched dataset by interhospital transfer

jkms-30-1889-i003
Parameters Total Direct Transfer P value
No. % No. % No. %
Total 1,510 755 755
Gender 0.92
 Male 606 40.1 304 40.3 302 40.0
 Female 904 59.9 451 59.7 453 60.0
Age 0.98
 ≤ 40 220 14.6 111 14.7 109 14.4
 41-60 816 54.0 406 53.8 410 54.3
 61- 474 31.4 238 31.5 236 31.3
 Median (IQR) 53 (45-63) 53 (45-63) 53 (45-63) 0.06
ED visit time 0.38
 6PM-6AM 667 44.2 342 45.3 325 43.0
 6AM-6PM 843 55.8 413 54.7 430 57.0
Week 0.73
 Weekday 1,074 71.1 534 70.7 540 71.5
 Weekend 436 28.9 221 29.3 215 28.5
Education 0.91
 < High school 564 37.4 282 37.4 282 37.4
 ≥ High school 793 52.5 394 52.2 399 52.8
 Unknown 153 10.1 79 10.5 74 9.8
Health behavior
 Exercise 280 18.5 137 18.1 143 18.9 0.69
 Current smoker 386 25.6 193 25.6 193 25.6 0.90
 Ex-smoker 86 5.7 41 5.4 45 6.0
 Alcohol 504 33.4 249 33.0 255 33.8 0.74
Past medical history
 DM 135 8.9 69 9.1 66 8.7 0.79
 Hypertension 612 40.5 305 40.4 307 40.7 0.92
 Dyslipidemia 36 2.4 16 2.1 20 2.6 0.50
 Chronic kidney disease 48 3.2 28 3.7 20 2.6 0.24
 Heart disease 62 4.1 30 4.0 32 4.2 0.80
 Stroke 96 6.4 47 6.2 49 6.5 0.83
Treatment 0.42
 Coiling 331 21.9 159 21.1 172 22.8
Post-stroke status 0.02
 No disability 722 47.8 381 50.5 341 45.2
 Disability 411 27.2 208 27.5 203 26.9
 Death 377 25.0 166 22.0 211 27.9

EMS, emergency medical service; ED, emergency department.

Table 4

Logistic regression analysis on outcomes by EMS utilization and interhospital transfer in original and propensity score matched dataset

jkms-30-1889-i004
Outcomes Total Outcome Crude Adjusted*
No. n % OR 95% CI P value OR 95% CI P value
Original dataset
 Outcome: death (n = 2,849)
  EMS and direct 795 304 38.2 1.00 1.00
  EMS and transfer 286 122 42.7 1.20 0.91 1.58 0.163 1.23 0.92 1.64 0.190
  Non-EMS and direct 473 65 13.7 0.26 0.19 0.35 < 0.001 0.24 0.18 0.33 < 0.001
  Non-EMS and transfer 1,295 271 20.9 0.43 0.35 0.52 < 0.001 0.39 0.32 0.49 < 0.001
 Outcome: disability (n = 2,087)
  EMS and direct 491 210 42.8 1.00 1.00
  EMS and transfer 164 58 35.4 0.73 0.51 1.06 0.096 0.72 0.49 1.04 0.082
  Non-EMS and direct 408 133 32.6 0.65 0.49 0.85 0.002 0.62 0.47 0.82 < 0.001
  Non-EMS and transfer 1,024 406 39.6 0.88 0.71 1.09 0.247 0.83 0.66 1.04 0.223
Propensity score matched dataset
 Outcome: death (n = 1,510)
  EMS and direct 287 103 35.9 1.00 1.00
  EMS and transfer 286 122 42.7 1.33 0.95 1.86 0.097 1.41 0.99 2.02 0.058
  Non-EMS and direct 468 63 13.5 0.28 0.19 0.40 < 0.001 0.26 0.18 0.38 < 0.001
  Non-EMS and transfer 469 89 19.0 0.42 0.30 0.58 < 0.001 0.41 0.29 0.58 < 0.001
 Outcome: disability (n = 1,133)
  EMS and direct 184 77 41.8 1.00 1.00
  EMS and transfer 164 58 35.4 0.76 0.49 1.17 0.216 0.76 0.49 1.20 0.236
  Non-EMS and direct 405 131 32.3 0.66 0.46 0.95 0.026 0.65 0.45 0.95 0.024
  Non-EMS and transfer 380 145 38.2 0.86 0.60 1.23 0.401 0.88 0.60 1.27 0.489

*Adjusted for age, sex, ED visit time, weekday, education level, health behavior (exercise, smoking, and alcohol), and past medical history (DM, hypertension, dyslipidemia, chronic kidney disease, heart disease, and stroke); *For disability, the ORs were calculated for alive patients.

Table 5

Interaction model to test transfer effect on outcomes for each EMS use group

jkms-30-1889-i005
Outcomes Outcome: Death Outcome: Disability
AOR* 95% CI P value AOR* 95% CI P value
Original dataset
 EMS use
  Direct 1.00 1.00
  Transfer 1.23 0.92 1.64 0.163 0.72 0.49 1.04 0.082
 No EMS use
  Direct 1.00 1.00
  Transfer 1.65 1.22 2.24 0.001 1.34 1.05 1.73 0.020
Propensity score matched dataset
 EMS use
  Direct 1.00 1.00
  Transfer 1.41 0.99 2.02 0.058 0.76 0.49 1.19 0.236
 No EMS use
  Direct 1.00 1.00
  Transfer 1.57 1.09 2.26 0.016 1.35 1.00 1.83 0.054

*Adjusted for age, sex, ED visit time, weekday, education level, health behavior (exercise, smoking, and alcohol), and past medical history (DM, hypertension, dyslipidemia, chronic kidney disease, heart disease, and stroke); For disability, the ORs were calculated for alive patients.

Notes

Funding Korea Centers for Disease Control and Prevention supported this study financially.

DISCLOSURE The authors have no potential conflicts of interest to disclose.

AUTHOR CONTRIBUTION Conception and design: Song KJ, Lee SH. Performing the experiments: Song KJ, Shin SD. Analysis of data: Ro YS. Writing: Lee SH, Song KJ. English editing: Kim MJ, Holmes JF. Agreeing with manuscript results and conclusions: all authors

References

1. van Gijn J, Rinkel GJ. Subarachnoid haemorrhage: diagnosis, causes and management. Brain. 2001; 124:249–278.
2. Adams HP Jr, Gordon DL. Nonaneurysmal subarachnoid hemorrhage. Ann Neurol. 1991; 29:461–462.
3. Ingall T, Asplund K, Mähönen M, Bonita R. A multinational comparison of subarachnoid hemorrhage epidemiology in the WHO MONICA stroke study. Stroke. 2000; 31:1054–1061.
4. Hop JW, Rinkel GJ, Algra A, van Gijn J. Case-fatality rates and functional outcome after subarachnoid hemorrhage: a systematic review. Stroke. 1997; 28:660–664.
5. Mayer SA, Kreiter KT, Copeland D, Bernardini GL, Bates JE, Peery S, Claassen J, Du YE, Connolly ES Jr. Global and domain-specific cognitive impairment and outcome after subarachnoid hemorrhage. Neurology. 2002; 59:1750–1758.
6. Hackett ML, Anderson CS. The Australian Cooperative Research on Subarachnoid Hemorrhage Study Group. Health outcomes 1 year after subarachnoid hemorrhage: An international population-based study. Neurology. 2000; 55:658–662.
7. Berman MF, Solomon RA, Mayer SA, Johnston SC, Yung PP. Impact of hospital-related factors on outcome after treatment of cerebral aneurysms. Stroke. 2003; 34:2200–2207.
8. Cross DT 3rd, Tirschwell DL, Clark MA, Tuden D, Derdeyn CP, Moran CJ, Dacey RG Jr. Mortality rates after subarachnoid hemorrhage: variations according to hospital case volume in 18 states. J Neurosurg. 2003; 99:810–817.
9. Johnston SC. Effect of endovascular services and hospital volume on cerebral aneurysm treatment outcomes. Stroke. 2000; 31:111–117.
10. Sakaki T, Morimoto T, Hoshida T, Kawaguchi S, Nakase H, Fukuzumi A. Rebleeding during transport of patients with a ruptured intracranial aneurysm. J Stroke Cerebrovasc Dis. 1999; 8:38–41.
11. Inagawa T, Kamiya K, Ogasawara H, Yano T. Rebleeding of ruptured intracranial aneurysms in the acute stage. Surg Neurol. 1987; 28:93–99.
12. Fujii Y, Takeuchi S, Sasaki O, Minakawa T, Koike T, Tanaka R. Ultra-early rebleeding in spontaneous subarachnoid hemorrhage. J Neurosurg. 1996; 84:35–42.
13. Ohkuma H, Tsurutani H, Suzuki S. Incidence and significance of early aneurysmal rebleeding before neurosurgical or neurological management. Stroke. 2001; 32:1176–1180.
14. Bardach NS, Olson SJ, Elkins JS, Smith WS, Lawton MT, Johnston SC. Regionalization of treatment for subarachnoid hemorrhage: a cost-utility analysis. Circulation. 2004; 109:2207–2212.
15. Wilson TJ, Saadeh Y, Stetler WR Jr, Pandey AS, Gemmete JJ, Chaudhary N, Thompson BG, Fletcher JJ. Transfer time to a high-volume center for patients with subarachnoid hemorrhage does not affect outcomes. J Stroke Cerebrovasc Dis. 2015; 24:416–423.
16. Duncan RP. Uncompensated hospital care. Med Care Rev. 1992; 49:265–330.
17. Jencks SF, Bobula JD. Does receiving referral and transfer patients make hospitals expensive? Med Care. 1988; 26:948–958.
18. Borlase BC, Baxter JK, Kenney PR, Forse RA, Benotti PN, Blackburn GL. Elective intrahospital admissions versus acute interhospital transfers to a surgical intensive care unit: cost and outcome prediction. J Trauma. 1991; 31:915–918.
19. Gordon HS, Rosenthal GE. Impact of interhospital transfers on outcomes in an academic medical center. Implications for profiling hospital quality. Med Care. 1996; 34:295–309.
20. Bellingan G, Olivier T, Batson S, Webb A. Comparison of a specialist retrieval team with current United Kingdom practice for the transport of critically ill patients. Intensive Care Med. 2000; 26:740–744.
21. Westfall JM, Kiefe CI, Weissman NW, Goudie A, Centor RM, Williams OD, Allison JJ. Does interhospital transfer improve outcome of acute myocardial infarction? A propensity score analysis from the Cardiovascular Cooperative Project. BMC Cardiovasc Disord. 2008; 8:22.
22. Tokuda Y, Inagawa T, Katoh Y, Kumano K, Ohbayashi N, Yoshioka H. Intracerebral hematoma in patients with ruptured cerebral aneurysms. Surg Neurol. 1995; 43:272–277.
TOOLS
ORCID iDs

Sang Hwa Lee
https://orcid.org/http://orcid.org/0000-0002-7294-0427

Kyoung Jun Song
https://orcid.org/http://orcid.org/0000-0002-0027-6352

Sang Do Shin
https://orcid.org/http://orcid.org/0000-0003-4953-2916

Young Sun Ro
https://orcid.org/http://orcid.org/0000-0003-3634-9573

Min Jung Kim
https://orcid.org/http://orcid.org/0000-0003-3561-9308

James F. Holmes
https://orcid.org/http://orcid.org/0000-0003-3270-2720

Similar articles