Journal List > J Korean Med Sci > v.30(12) > 1022824

Kwak, Ro, Shin, Song, Kim, and Jang: Preventive Effects of Seat Belt on Clinical Outcomes for Road Traffic Injuries

Abstract

Proper seat belt use saves lives; however, the use rate decreased in Korea. This study aimed to measure the magnitude of the preventive effect of seat belt on case-fatality across drivers and passengers. We used the Emergency Department based Injury In-depth Surveillance (EDIIS) database from 17 EDs between 2011 and 2012. All of adult injured patients from road traffic injuries (RTI) in-vehicle of less than 10-seat van were eligible, excluding cases with unknown seat belt use and outcomes. Primary and secondary endpoints were in-hospital mortality and intracranial injury. We calculated adjusted odds ratios (AORs) of seat belt use and driving status for study outcomes adjusting for potential confounders. Among 23,698 eligible patients, 15,304 (64.6%) wore seat belts. Driver, middle aged (30-44 yr), male, daytime injured patients were more likely to use seat belts (all P < 0.001). In terms of clinical outcome, no seat belt group had higher proportions of case-fatality and intracranial injury compared to seat belt group (both P < 0.001). Compared to seat belt group, AORs (95% CIs) of no seat belt group were 10.43 (7.75-14.04) for case-fatality and 2.68 (2.25-3.19) for intracranial injury respectively. In the interaction model, AORs (95% CIs) of no seat belt use for case-fatality were 11.71 (8.45-16.22) in drivers and 5.52 (2.83-14.76) in non-driving passengers, respectively. Wearing seat belt has significantly preventive effects on case-fatality and intracranial injury. Public health efforts to increase seat belt use are needed to reduce health burden from RTIs.

Graphical Abstract

jkms-30-1881-ab001

INTRODUCTION

Road traffic injury (RTI) is one of top five causes of all-cause mortality globally, and the incidence is increasing as the number of vehicles increases (12). In Korea, the mortality rate from RTI was on the rise until the 2000s and started to decrease; however, it still accounted as the second leading cause of death among youth and the ninth in all ages in 2013 (3). RTI is predicted to result in more severe functional impairment as well as higher case-fatality compared to other blunt trauma (4). Even though several strategies to prevent RTI such as public campaign and legislation were implemented, the incidence and mortality of RTIs increased especially in developing countries (5).
Education, enforcement, and engineering are known to be highly effective in preventing injuries including RTI (678910). Seat belt, when properly used, is accounted as one of the most effective modalities to save lives and reduce the extent and number of injuries (789). Proper seat belt use prevents 25%-50% of fatal injuries, 25%-45% of serious injuries, and 20%-25% of minor injuries (11). However, seat belt use remains low at 4% to 72% (121314). According to the 2013 National Health Statistics of Korea, the seat belt use rates for male and female drivers continuously decreased since 2001 from 82.8% to 63.5% and 91.5% to 74.1%, respectively; for male and female front seat passengers, the use rates decreased from 76.3% to 51.7% and 80.5% to 61.5%, respectively (15).
Driving status and passenger seating positions are also associated with case-fatality and severe injury (16). It is known that front seat passengers have higher case-fatality from RTI (17); on the contrary, there is only minimal risk difference when both driver and the front seat passenger are belted (18). Moreover, rear seat passengers are less likely to die compared to front seat passengers; however, unbelted rear seat passengers are not only at increased risk, but also pose harmful effects on belted front seat passengers (16192021).
The seat belt use rates are different among drivers and non-driving passengers, and the clinical outcomes are affected by both of seat belt use and driving status. Studies comparing the preventive effects of seat belt on clinical outcomes between drivers and non-driving passengers are limited. We hypothesize that the preventive effects of seat belt on case-fatality and severe injury would be bigger in magnitude for drivers than for non-driving passengers among injured patients from RTI. This study aimed to describe the seat belt use among patients who sustained RTI, to evaluate the preventive effects of seat belt, and to compare the effects across drivers and non-driving passengers.

MATERIALS AND METHODS

Study design and setting

This is an observational study using the Emergency Department based Injury In-depth Surveillance (EDIIS) database in Korea. The EDIIS is a nationwide, prospective database of injury patients visiting the emergency department (ED), which gathers injury-related information for planning national policy in injury prevention. The EDIIS project was organized and financially supported by the Korea Centers for Disease Control and Prevention (CDC). The Ministry of Health and Welfare designated EDs into three levels according to the resources and functional requirements; level 1 (n=19) and level 2 (n=110) EDs have more resources and better facilities for emergency care and must be staffed by emergency physicians 24 hr a day and 365 days a year.

Data source and collection

The EDIIS was designed based on the core dataset of the International Classification of External Causes of Injuries (ICECI) proposed by the World Health Organization. The database collects patients' demographic information, injury-related information, prehospital emergency medical service records, clinical findings, diagnostic assessment and medical treatment in the ED, ED disposition, and patient outcome after admission if the patient was admitted (22).
Primary surveillance and data collection was performed by general physicians, and most of the recorded information was supervised and corrected by emergency medicine physicians and trained research coordinators on a daily basis. All research coordinators were required to complete training prior to project participation and regularly input surveillance data into a web-based database system of the Korea CDC. The data was reviewed every month by the quality management committee of this project, who provided regular feedback to maintain the data quality.

Study population

The study population was all adult patients who sustained RTI in vehicle (drivers and non-driving passengers) and visited any of the 17 tertiary academic teaching hospitals' EDs (10 level 1 EDs and 7 level 2 EDs) between January 2011 and December 2012, excluding cases resulting from out-of-vehicle RTI, 10-or-more passenger vans, or had unknown information on seat belt use and/or clinical outcomes. Patients who visited EDs for recurrent complications after injury were not included in this study.

Main outcomes

The primary endpoint was in-hospital mortality, defined as death in ED or during initial admission resulting from the injury event regardless of the duration from injury to death, determined at discharge from ED or hospital. The secondary endpoint was intracranial injury, defined as diagnosis of ICD-10 code S06.1-S06.9 as recorded on discharge summary after ED and/or hospital admission. The tertiary endpoint was clinically important injury, defined as admission to general ward or intensive care unit or mortality in ED as results of the injury event, determined at discharge from ED.

Variables and measurements

The main exposure of interest was seat belt use, as detected by the EDIIS registry.
Driving was divided into two classes including drivers and non-driving passengers. We collected information on demographic factors (age, gender, and past medical history), injury-related factors (time of injury, day of injury, alcohol-related injury), prehospital factors (emergency medical services [EMS] use and time from injury to ED arrival), hospital factors (initial vital status and ED disposition), and clinical outcomes.

Statistical analysis

Descriptive analysis was performed to examine the distribution of the study variables; counts and proportions were used for categorical variables, and median and quartile values were used for continuous variables. Continuous variables were compared using the Wilcoxon rank sum test or Kruskal-Wallis test, and categorical variables were compared using the chi-square test.
Adjusted odds ratio (AOR) with 95% confidence intervals (95% CIs) of seat belt use for the study endpoints were calculated using multivariable logistic regression analysis with no seat belt use as reference. The adjusted model controlled for age, gender, past medical history (hypertension and diabetes mellitus), day and time of injury, alcohol use, and driving status.
To calculated the AOR (95% CIs) according to the driving status (driver and non-driving passenger), we developed an interaction model with an interaction term (seat belt use*driving status) as the final multivariable logistic regression model for the outcomes. All statistical analysis was performed using SAS software, version 9.4 (SAS Institute Inc., Cary, NC, USA). P values were based on a two-sided significance level of 0.05.

Ethics statement

The study was reviewed and approved by the institutional review board of Seoul National University Hospital (IRB No. 1103-152-357). Informed consent was waived and patient information was anonymized prior to analysis.

RESULTS

Seat belt use of road traffic injuries

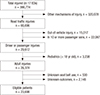
Of 386,774 injured patients, 23,698 (6.1%) patients were eligible for study inclusion, excluding other mechanisms of injury (n=320,078), out-of-vehicle injuries (n=15,017), injuries occurring in 10-or-more passenger vans (n=22,067), pediatric patients (n=3,238), and patients with unknown information of seat belt use (n=530) or clinical outcomes (n=2,146) (Fig. 1).
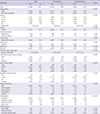
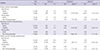
Table 1 shows the demographic characteristics by seat belt use. Among 23,698 eligible patients, 15,304 (64.6%) were wearing seat belts. Driver, middle-aged (30-44 yr old), male, and daytime injury patients were more likely to wear seat belts (all P<0.001). In terms of clinical outcomes, no seat belt group had a higher proportion of case-fatality, intracranial injury, and clinically important injury compared to seat belt group (all P<0.001).
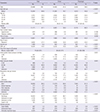
Table 2 shows the demographic characteristics by driving status. From 23,698 eligible patients, 14,465 (61.0%) were drivers. Among drivers, 76.7% (n=11,091) were wearing seat belts, whereas 45.6% (n=4,213) among non-driving passengers used seat belts (P<0.001). In terms of clinical outcome, drivers group had a higher proportion of case-fatality and clinically important injury (both P<0.001).

Multivariable logistic regression analysis

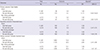
Compared to no seat belt group, the AOR (95% CI) of the seat belt group for case-fatality was 10.43 (7.75-14.04); 2.68 (2.25-3.19) for intracranial injury; and 2.19 (2.04-2.36) for clinical important injury, respectively. In comparison, the AOR (95% CI) of the driver group was 2.95 (2.21-3.94) for case-fatality; 1.34 (1.11-1.62) for intracranial injury; and 1.41 (1.30-1.53) for clinical important injury respectively, in reference to the non-driving passenger group (Table 3).

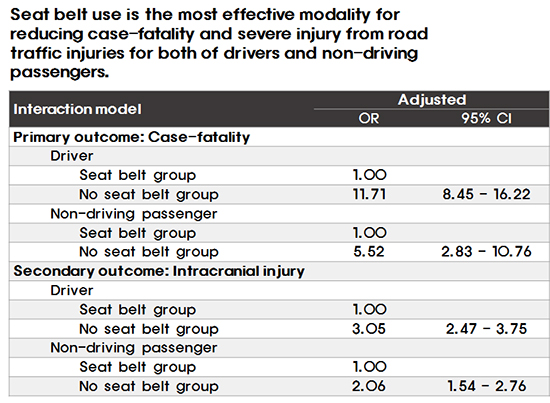
Multivariable logistic regression analysis with interaction term

In the interaction model, AORs (95% CIs) of seat belt use for case-fatality were 11.71 (8.45-16.22) in drivers and 5.52 (2.83-14.76) in non-driving passengers. When a driver did not wear seat belt, the odds for case-fatality was 11.71 times higher relatively to when a driver wore seat belt. Furthermore, when a non-driving passenger did not wear seat belt, the odds were 5.52 times higher compared to the odds of case-fatality in a seat belt-wearing non-driving passenger. In terms of intracranial injury, AORs (95% CIs) comparing the seat belt group and no seat belt group were 3.05 (2.47-3.75) in drivers and 2.06 (1.54-2.76) in non-driving passengers. In terms of clinically important injury, AORs (95% CIs) of seat belt group compared with no seat belt group were 2.64 (2.41-2.90) in drivers and 1.61 (1.43-1.81) in non-driving passengers (Table 4).

DISCUSSION

A nationwide injury surveillance data identified significant preventive effects of seat belt on case-fatalities, intracranial injuries, and clinically important injuries requiring hospital admission. Only two thirds of injured patients from RTI were wearing seat belts, and the case-fatality was high at 2.8% in unbelted and 0.4% in belted respectively. The preventive effects on study outcomes of belted occupants compared to unbelted were higher in drivers than in non-driving passengers.
Seat belt use is the most effective modality for reducing case-fatality and severe injury from RTI, as numerous evidences support the association between seat belt use and reduced occupant case-fatality and health-related cost (789). Seat belt use would be lessen the impact from primary collision and prevent second collision of human body to vehicles. Among patients who sustained RTI in this study, any unbelted vehicle occupants, regardless of driver or passenger, had 10 times higher odds for case-fatality compared to those who were belted, 2.5 times higher for intracranial injury, and 2.2 times higher for hospital admission, respectively. Intracranial injury is one of the most fatal anatomical locations from RTI with 9.5% case-fatality rate, and is known to cause substantial disability and sequelae (23).
In terms of seating positions, we observed stronger preventive effects of seat belt on case-fatality in drivers compared to non-driving passengers (OR, 11.71 vs. 5.52, respectively). The risk is higher in unbelted drivers than in unbelted passengers where the crude case-fatality rate was 5.1% in unbelted drivers and 1.3% in unbelted non-driving passengers. On the contrary, when both the driver and front seat passenger were belted, the risk difference of severe injury between drivers and front seat passengers was diminished (18).
Seat belt legislation has been enforced in many countries including Korea where seat belt use has been made compulsory to all vehicle occupants in the vehicle; however, the seat belt use rate has not increased drastically (12131415). Despite the legislative measures to enforce seat belt use, we observed seat belt use in 76.7% among drivers and only 45.6% among non-driving passengers, which may have led to increased mortality and health burden from RTI. Seat belt legislation has been reported to reduce the severity and sequelae of traumatic brain injuries related to RTI, ultimately reducing the overall health burden (24). Primary enforcement seat belt laws mandate seat belt use and are reported to result in higher seat belt use rates and lower RTI case-fatality rates among youth and adults, compared to secondary enforcement seat belt laws (2526). Such results indicate stronger law enforcement is required for effective regulation of seat belt use.
Evidence-based strategies to increase seat belt use should be developed and implemented to increase seat belt use and reduce preventable mortality from RTIs, including extensive public advocacy and campaign, legislation and strong enforcement of related laws, and engineering and developing of new technology such as smart seat belt reminders (27). Monitoring, assurance, and development of legal remedies are necessary to enhance the seat belt use for not only the drivers, but all vehicle occupants.
This study has several limitations. First, this is an observational study, not an intervention trial. There may a potential confounding issue that exerted an impact. Second, the seat belt use, which was the main exposure variable, was measured by face-to-face interview by general physicians. This is subject to over- or under-estimation, which can result in bias. Third, we only had information on whether the vehicle occupant was the driver or a non-driving passenger, but could not distinguish whether the passenger was seated in front or rear. Injury-related information on the specific seating position, mechanism of collision, the speed at the time of injury, level of blood alcohol level were limited and not fully adjusted.
In conclusion, seat belt use among patients injured from RTI has preventive effects on case-fatality and intracranial injury. The preventive effects were significant both in drivers and passengers. Public health efforts including public campaign, advocacy, and multidisciplinary approaches to increase seat belt use would help reduce health burden from RTIs.

Figures and Tables

Fig. 1

Study population flow. ED, emergency department.

jkms-30-1881-g001
Table 1

Demographic findings and clinical outcomes by seat belt use

jkms-30-1881-i001
Parameters Total Seat belt group No seat belt group P value
No. % No. % No. %
Total 23,698 100 15,304 64.6 8,394 35.4
Driving status <0.001
 Driver 14,465 61.0 11,091 72.5 3,374 40.2
 Non-driving passenger 9,233 39.0 4,213 27.5 5,020 59.8
Age (yr) <0.001
 19-29 5,761 24.3 3,308 21.6 2,453 29.2
 30-44 9,047 38.2 6,208 40.6 2,839 33.8
 45-64 7,259 30.6 4,854 31.7 2,405 28.7
 65- 1,631 6.9 934 6.1 697 8.3
 Median (IQR) 39 (30-51) 38 (28-51) 39 (31-51) <0.001
Gender <0.001
 Female 11,171 47.1 6,998 45.7 4,173 49.7
Past medical history
 Hypertension 679 2.9 398 2.6 281 3.3 0.001
 Diabetes mellitus 338 1.4 197 1.3 141 1.7 0.015
Time of injury <0.001
 Daytime (6 am-6 pm) 12,801 54.0 8,665 56.6 4,136 49.3
Day of injury 0.012
 Weekend 8,856 37.4 5,630 36.8 3,226 38.4
Alcohol use 1,489 6.3 542 3.5 947 11.3 <0.001
EMS use 10,629 44.9 6,084 39.8 4,545 54.1 <0.001
Time from injury to ED arrival <0.001
 Minute, median (IQR) 70 (40-251) 61 (37-240) 77 (41-274)
Initial systolic blood pressure (mmHg) <0.001
 0-89 341 1.4 121 0.8 220 2.6
 90- 18,358 77.5 11,692 76.4 6,666 79.4
 Unknown 4,999 21.1 3,491 22.8 1,508 18.0
Heart rate per minute <0.001
 0-59 488 2.1 268 1.8 220 2.6
 60-99 16,330 68.9 10,486 68.5 5,844 69.6
 100- 1,888 8.0 1,058 6.9 830 9.9
 Unknown 4,992 21.1 3,492 22.8 1,500 17.9
Respiratory rate per minute <0.001
 0-9 145 0.6 57 0.4 88 1.0
 10-29 18,461 77.9 11,714 76.5 6,747 80.4
 30- 72 0.3 35 0.2 37 0.4
 Unknown 5,020 21.2 3,498 22.9 1,522 18.1
Initial mental status <0.001
 Alert 19,083 80.5 12,282 80.3 6,801 81.0
 Verbal response 177 0.7 59 0.4 118 1.4
 Pain response 157 0.7 46 0.3 111 1.3
 Unresponsive 207 0.9 30 0.2 177 2.1
 Unknown 4,074 17.2 2,887 18.9 1,187 14.1
ED disposition <0.001
 Discharge 19,353 81.7 13,088 85.5 6,265 74.6
 Admission to ward 3,130 13.2 1,740 11.4 1,390 16.6
 Admission to ICU 1,028 4.3 444 2.9 584 7.0
 Death in ED 187 0.8 32 0.2 155 1.8
Clinical outcome
 Case-fatality 297 1.3 58 0.4 239 2.8 <0.001
 Intracranial injury 607 2.6 257 1.7 350 4.2 <0.001
 Clinically important injury 4345 18.3 2216 14.5 2,129 25.4 <0.001

IQR, interquartile range; EMS, emergency medical services; ED, emergency department; ICU, intensive care unit.

Table 2

Demographic findings and clinical outcomes by driving status

jkms-30-1881-i002
Parameters Total Driver Passenger P value
No. % No. % No. %
Total 23,698 100 14,465 61.0 9,233 39.0
Seat belt use < 0.001
 Belted 15,304 64.6 11,091 76.7 4,213 45.6
Age (yr) < 0.001
 19-29 5,761 24.3 2,934 20.3 2,827 30.6
 30-44 9,047 38.2 6,107 42.2 2,940 31.8
 45-64 7,259 30.6 4,713 32.6 2,546 27.6
 65- 1,631 6.9 711 4.9 920 10.0
 Median (IQR) 39 (30-51) 39 (31-51) 37 (28-52)
Gender <0.001
 Female 11,171 47.1 5,061 35 6,110 66.2
Past medical history
 Hypertension 679 2.9 398 2.8 281 3.0 0.189
 Diabetes mellitus 338 1.4 225 1.6 113 1.2 0.035
Time of injury 0.036
 Daytime (6 am-6 pm) 12,801 54.0 7,892 54.6 4,909 53.2
Day of injury < 0.001
 Weekend 8,856 37.4 4,886 33.8 3,970 43.0
Alcohol use 1,489 6.3 832 5.8 657 7.1 < 0.001
EMS use 10,629 44.9 6,330 43.8 4,299 46.6 < 0.001
Time from injury to ED arrival < 0.001
 Minute, median (IQR) 70 (40-251) 80 (42-277) 61 (36-239)
Initial systolic blood pressure (mmHg) 0.001
 0-89 341 1.4 238 1.6 103 1.1
 90- 18,358 77.5 11,135 77.0 7,223 78.2
 Unknown 4,999 21.1 3,092 21.4 1,907 20.7
Heart rate per minute 0.041
 0-59 488 2.1 316 2.2 172 1.9
 60-99 16,330 68.9 9,880 68.3 6,450 69.9
 100- 1,888 8.0 1,184 8.2 704 7.6
 Unknown 4,992 21.1 3,085 21.3 1,907 20.7
Respiratory rate per minute 0.007
 0-9 145 0.6 105 0.7 40 0.4
 10-29 18,461 77.9 11,216 77.5 7,245 78.5
 30- 72 0.3 40 0.3 32 0.3
 Unknown 5,020 21.2 3,104 21.5 1,916 20.8
Initial mental status < 0.001
 Alert 19,083 80.5 11,579 80.0 7,504 81.3
 Verbal response 177 0.7 130 0.9 47 0.5
 Pain response 157 0.7 113 0.8 44 0.5
 Unresponsive 207 0.9 151 1.0 56 0.6
 Unknown 4,074 17.2 2,492 17.2 1,582 17.1
ED disposition < 0.001
 Discharge 19,353 81.7 11,677 80.7 7,676 83.1
 Admission to ward 3,130 13.2 1,955 13.5 1,175 12.7
 Admission to ICU 1,028 4.3 220 1.5 338 3.7
 Death in ED 187 0.8 143 1.0 44 0.5
Clinical outcome
 Case-fatality 297 1.3 220 1.5 77 0.8 < 0.001
 Intracranial injury 607 2.6 378 2.6 229 2.5 0.528
 Clinically important injury 4,345 18.3 2,788 19.3 1,557 16.9 < 0.001

IQR, interquartile range; EMS, emergency medical services; ED, emergency department; ICU, intensive care unit.

Table 3

Multivariable logistic regression analysis on study outcomes by seat belt use and driving status

jkms-30-1881-i003
Variables Total Outcomes Unadjusted Adjusted*
No. No. % OR 95% CI OR 95% CI
Primary outcome: Case-fatality
 Seat belt use
  Belted 15,304 58 0.4 1.00 1.00
  Unbelted 8,394 239 2.8 7.70 5.78-10.28 10.43 7.75-14.04
 Driving status
  Driver 9,233 77 0.8 1.00 1.00
  Non-driving passenger 14,465 220 1.5 1.84 1.42-2.38 2.95 2.21-3.94
Secondary outcome: Intracranial injury
 Seat belt use
  Belted 15,304 257 1.7 1.00 1.00
  Unbelted 8,394 350 4.2 2.55 2.16-3.00 2.68 2.25-3.19
 Driving status
  Driver 9,233 229 2.5 1.00 1.00
  Non-driving passenger 14,465 378 2.6 1.06 0.89-1.25 1.34 1.11-1.62
Tertiary outcome: Clinically important injury
 Seat belt use
  Belted 15,304 2,216 14.5 1.00 1.00
  Unbelted 8,394 2,129 25.4 2.01 1.88-2.15 2.19 2.04-2.36
 Driving status
  Driver 9,233 1,557 16.9 1.00 1.00
  Non-driving passenger 14,465 2,788 19.3 1.18 1.10-1.26 1.41 1.30-1.53

*Adjusted for seat belt use, driving status, age, gender, time of injury, day of injury, alcohol use, and past medical history (hypertension and diabetes). OR, odds ratio; CI, confidence interval.

Table 4

Effects of seat belt use in interaction model with the driving status

jkms-30-1881-i004
Outcomes Total Outcome Adjusted*
No. No. % OR 95% CI
Primary outcome: Case-fatality
 Driver
  Seat belt group 11,091 48 0.4 1.00
  No seat belt group 3,374 172 5.1 11.71 8.45-16.22
 Non-driving passenger
  Seat belt group 4,213 10 0.2 1.00
  No seat belt group 5,020 67 1.3 5.52 2.83-10.76
Secondary outcome: Intracranial injury
 Driver
  Seat belt group 11,091 192 1.7 1.00
  No seat belt group 3,374 186 5.5 3.05 2.47-3.75
 Non-driving passenger
  Seat belt group 4,213 65 1.5 1.00
  No seat belt group 5,020 164 3.3 2.06 1.54-2.76
Tertiary outcome: Clinically important injury
 Driver
  Seat belt group 11,091 1,665 15.0 1.00
  No seat belt group 3,374 1,123 33.3 2.64 2.41-2.90
 Non-driving passenger
  Seat belt group 4,213 551 13.1 1.00
  No seat belt group 5,020 1,006 20.0 1.61 1.43-1.81

*Adjusted for seat belt use, driving status, age, gender, time of injury, day of injury, alcohol use, past medical history (hypertension and diabetes), and interaction term (seat belt use×driving status). OR, odds ratio; CI, confidence interval.

Notes

Funding This study was financially supported by the Korea Centers for Disease Control and Prevention (CDC) (Grant No. 2013E3302300).

DISCLOSURE The authors have no potential conflicts of interest to disclose.

AUTHOR CONTRIBUTION Study concept and design: Kwak BH, Ro YS, Shin SD, Song KJ. Acquisition, analysis, or interpretation of data: Kwak BH, Ro YS, Shin SD. Drafting of the manuscript: Kwak BH, Ro YS, Jang DB. Critical revision of the manuscript for important intellectual content: Ro YS, Shin SD, Song KJ, Kim YJ. Statistical analysis: Kwak BH, Ro YS. Administrative, technical, or material support: Kwak BH, Kim YJ, Jang DB. Study supervision: Shin SD, Song KJ. Manuscript approval: all authors.

References

1. Sise RG, Calvo RY, Spain DA, Weiser TG, Staudenmayer KL. The epidemiology of trauma-related mortality in the United States from 2002 to 2010. J Trauma Acute Care Surg. 2014; 76:913–919.
2. GBD 2013 Mortality and Causes of Death Collaborators. Global, regional, and national age-sex specific all-cause and cause-specific mortality for 240 causes of death, 1990-2013: a systematic analysis for the Global Burden of Disease Study 2013. Lancet. 2015; 385:117–171.
3. Lim D, Ha M, Song I. Trends in the leading causes of death in Korea, 1983-2012. J Korean Med Sci. 2014; 29:1597–1603.
4. Haider AH, Chang DC, Haut ER, Cornwell EE 3rd, Efron DT. Mechanism of injury predicts patient mortality and impairment after blunt trauma. J Surg Res. 2009; 153:138–142.
5. Nantulya VM, Reich MR. The neglected epidemic: road traffic injuries in developing countries. BMJ. 2002; 324:1139–1141.
6. Ian R, Irene K. Cochrane Injuries Group Driver Education Reviewers. School based driver education for the prevention of traffic crashes. Cochrane Database Syst Rev. 2001; CD003201.
7. Conner KA, Xiang H, Smith GA. The impact of a standard enforcement safety belt law on fatalities and hospital charges in Ohio. J Safety Res. 2010; 41:17–23.
8. Koushki PA, Bustan MA, Kartam N. Impact of safety belt use on road accident injury and injury type in Kuwait. Accid Anal Prev. 2003; 35:237–241.
9. Costich JF, Slavova SS. Using enforcement and adjudication data to assess the impact of a primary safety belt law. Traffic Inj Prev. 2015; 16:664–668.
10. Tunbridge RJ. The long term effect of seat belt legislation on road user injury patterns. Health Bull (Edinb). 1990; 48:347–349.
11. Elvik R, Vaa T. The handbook of road safety measures. Oxford: Elsevier;2004.
12. Cummings P, Wells JD, Rivara FP. Estimating seat belt effectiveness using matched-pair cohort methods. Accid Anal Prev. 2003; 35:143–149.
13. Salzberg P, Yamada A, Saibel C, Moffat J. Predicting seat belt use in fatal motor vehicle crashes from observation surveys of belt use. Accid Anal Prev. 2002; 34:139–148.
14. Vecino-Ortiz AI, Bishai D, Chandran A, Bhalla K, Bachani AM, Gupta S, Slyunkina E, Hyder AA. Seatbelt wearing rates in middle income countries: a cross-country analysis. Accid Anal Prev. 2014; 71:115–119.
15. Korea Centers for Diseases Control and Prevention. National health statistics of Korea. 2013. accessed on 25 June 2015. Available at http://stat.mw.go.kr/front/statData/publicationView.jsp?menuId=47&topSelect=B00005&bbsSeq=13&nttSeq=21549&searchKey=&searchWord=&nPage=1.
16. Smith KM, Cummings P. Passenger seating position and the risk of passenger death in traffic crashes: a matched cohort study. Inj Prev. 2006; 12:83–86.
17. Pedley DK, Thakore S. Difference in injury pattern between drivers and front seat passengers involved in road traffic accidents in Scotland. Emerg Med J. 2004; 21:197–198.
18. Viano DC, Parenteau CS. Severe-to-fatal injury risks in crashes with two front-seat occupants by seat belt use. Traffic Inj Prev. 2010; 11:294–299.
19. Bose D, Arregui-Dalmases C, Sanchez-Molina D, Velazquez-Ameijide J, Crandall J. Increased risk of driver fatality due to unrestrained rear-seat passengers in severe frontal crashes. Accid Anal Prev. 2013; 53:100–104.
20. Smith KM, Cummings P. Passenger seating position and the risk of passenger death or injury in traffic crashes. Accid Anal Prev. 2004; 36:257–260.
21. Mayrose J, Priya A. The safest seat: effect of seating position on occupant mortality. J Safety Res. 2008; 39:433–436.
22. Ro YS, Shin SD, Holmes JF, Song KJ, Park JO, Cho JS, Lee SC, Kim SC, Hong KJ, Park CB, et al. Comparison of clinical performance of cranial computed tomography rules in patients with minor head injury: a multicenter prospective study. Acad Emerg Med. 2011; 18:597–604.
23. Lee KS. Estimation of the incidence of head injury in Korea: an approximation based on national traffic accident statistics. J Korean Med Sci. 2001; 16:342–346.
24. Kuo CY, Chiou HY, Lin JW, Tsai SH, Chiang YH, Lin CM, Chiu WT. Seatbelt use and traumatic brain injury in Taiwan: a 16-year study. Iran J Public Health. 2015; 44:470–478.
25. Lee LK, Monuteaux MC, Burghardt LC, Fleegler EW, Nigrovic LE, Meehan WP, Schutzman SA, Mannix R. Motor vehicle crash fatalities in states with primary versus secondary seat belt laws: a time-series analysis. Ann Intern Med. 2015; 163:184–190.
26. Carpenter CS, Stehr M. The effects of mandatory seatbelt laws on seatbelt use, motor vehicle fatalities, and crash-related injuries among youths. J Health Econ. 2008; 27:642–662.
27. Fildes B, Fitzharris M, Koppel S, Vulcan P, Brooks C. Benefits of seat belt reminder systems. Annu Proc Assoc Adv Automot Med. 2003; 47:253–266.
TOOLS
ORCID iDs

Bong Hun Kwak
https://orcid.org/http://orcid.org/0000-0001-6431-3039

Young Sun Ro
https://orcid.org/http://orcid.org/0000-0003-3634-9573

Sang Do Shin
https://orcid.org/http://orcid.org/0000-0003-4953-2916

Kyoung Jun Song
https://orcid.org/http://orcid.org/0000-0002-0027-6352

Yu Jin Kim
https://orcid.org/http://orcid.org/0000-0001-7449-9025

Dayea Beatrice Jang
https://orcid.org/http://orcid.org/0000-0002-0167-7166

Similar articles